
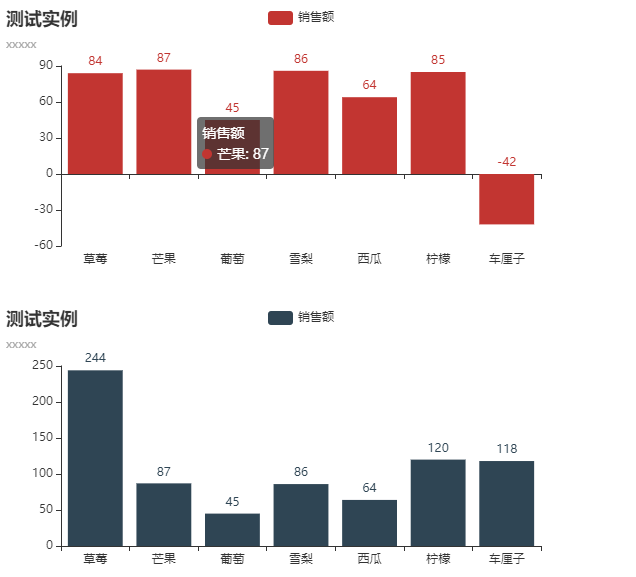
基于python 利用pyecharts作图,实现图表随数据变化实时更新
利用vue和echarts可以设置定时获取数据渲染页面,但pyecharts做的图在前端页面上为JS中的一个对象数据,(利用Python搭建服务器定时返回新作的图表太麻烦目前不想这样做),那位大神有好办法不妨告知。。。
目前采用定时修改pyecharts图表对象的属性值,在渲染页面:
代码如下
<!--  初始化echarts图表 -->
        var chart_65e195a41f494479b5c980b285573936 = echarts.init(
            document.getElementById('65e195a41f494479b5c980b285573936'), 'white', {renderer: 'canvas'});
        // 创建图表各个参数
        var option_65e195a41f494479b5c980b285573936 = {
          "animation": true,
          "animationThreshold": 2000,
          "animationDuration": 1000,
          "animationEasing": "cubicOut",
          "animationDelay": 0,
          "animationDurationUpdate": 300,
          "animationEasingUpdate": "cubicOut",
          "animationDelayUpdate": 0,
          "color": [
             "#c23531",
             "#2f4554",
             "#61a0a8",
             "#d48265",
             "#749f83",
             "#ca8622",
             "#bda29a",
             "#6e7074",
             "#546570",
             "#c4ccd3",
             "#f05b72",
             "#ef5b9c",
             "#f47920",
             "#905a3d",
             "#fab27b",
             "#2a5caa",
             "#444693",
             "#726930",
             "#b2d235",
             "#6d8346",
             "#ac6767",
             "#1d953f",
             "#6950a1",
             "#918597"
             ],
          "series": [
        {
            "type": "bar",
            "name": "\u9500\u552e\u989d",
            "legendHoverLink": true,
            "data": [
                84,
                87,
                45,
                86,
                64,
                85,
                118
            ],
            "showBackground": false,
            "barMinHeight": 0,
            "barCategoryGap": "20%",
            "barGap": "30%",
            "large": false,
            "largeThreshold": 400,
            "seriesLayoutBy": "column",
            "datasetIndex": 0,
            "clip": true,
            "zlevel": 0,
            "z": 2,
            "label": {
                "show": true,
                "position": "top",
                "margin": 8
            }
        }
    ],
          "legend": [
        {
            "data": [
                "\u9500\u552e\u989d"
            ],
            "selected": {
                "\u9500\u552e\u989d": true
            },
            "show": true,
            "padding": 5,
            "itemGap": 10,
            "itemWidth": 25,
            "itemHeight": 14
        }
    ],
          "tooltip": {
        "show": true,
        "trigger": "item",
        "triggerOn": "mousemove|click",
        "axisPointer": {
            "type": "line"
        },
        "showContent": true,
        "alwaysShowContent": false,
        "showDelay": 0,
        "hideDelay": 100,
        "textStyle": {
            "fontSize": 14
        },
        "borderWidth": 0,
        "padding": 5
    },
          "xAxis": [
        {
            "show": true,
            "scale": false,
            "nameLocation": "end",
            "nameGap": 15,
            "gridIndex": 0,
            "inverse": false,
            "offset": 0,
            "splitNumber": 5,
            "minInterval": 0,
            "splitLine": {
                "show": false,
                "lineStyle": {
                    "show": true,
                    "width": 1,
                    "opacity": 1,
                    "curveness": 0,
                    "type": "solid"
                }
            },
            "data": [
                "\u8349\u8393",
                "\u8292\u679c",
                "\u8461\u8404",
                "\u96ea\u68a8",
                "\u897f\u74dc",
                "\u67e0\u6aac",
                "\u8f66\u5398\u5b50"
            ]
        }
    ],
          "yAxis": [
        {
            "show": true,
            "scale": false,
            "nameLocation": "end",
            "nameGap": 15,
            "gridIndex": 0,
            "inverse": false,
            "offset": 0,
            "splitNumber": 5,
            "minInterval": 0,
            "splitLine": {
                "show": false,
                "lineStyle": {
                    "show": true,
                    "width": 1,
                    "opacity": 1,
                    "curveness": 0,
                    "type": "solid"
                }
            }
        }
    ],
          "title": [
        {
            "text": "\u6d4b\u8bd5\u5b9e\u4f8b",
            "subtext": "xxxxx",
            "padding": 5,
            "itemGap": 10
        }
    ]};
        // 为创建的echarst图表添加各设置
        chart_65e195a41f494479b5c980b285573936.setOption(option_65e195a41f494479b5c980b285573936);

       # 定时修改charts对象的series属性中的data值,然后再为chart对象修改参数
        var interval = setInterval(function () {
            option_65e195a41f494479b5c980b285573936.series[0].data[6] -= 1;
            console.log(1);
            chart_65e195a41f494479b5c980b285573936.setOption(option_65e195a41f494479b5c980b285573936);
        },
        1000
        )
效果如下

 浙公网安备 33010602011771号