

一、说明
使用Sysbench工具压测,可对Postgresql进行本机、异机的压测。
二、安装步骤
详见:https://www.cnblogs.com/chengwaixue/p/15073864.html
三、测试资源
-
机器资源
- 测试机:16C/32GB/50G(SSD)
- Postgresql服务器:16C/32GB/50G(SSD)
-
Postgresql配置
四、压测步骤
-
创建Postgresql数据库
-
登录postgresql
ssh posrgres@192.168.0.1

##
cd /opt/postgresql/bin

##
./psql -u postgres -p 5432
-
创建测试database
CREATE DATABASE test_db;
\l
-
-
生成测试数据
-
执行命令
sysbench \
--db-driver=pgsql \
--pgsql-host=127.0.0.1 \
--pgsql-port=5432 \
--pgsql-user=postgres \
--pgsql-password=postgres \
--pgsql-db=test_db \
--tables=4 \
--table-size=100000 \
--threads=50 \
--time=60 \
--events=0 \
--report-interval=10 \
--percentile=99 \
/usr/local/share/sysbench/oltp_read_write.lua \
prepare
-
参数说明
## --db-driver=pgsql : 设置pgsql驱动## --tables=4 :设置为N个table的测试
## --table-size=100000 :每张table的生成测试数据条数,有的版本设置参数为 --oltp-table-size=100000
## --threads=50 :压测发起线程数(并发连接)
## --time=60 : 压测时长,单位秒 , 如果设置events,则无需设置该时间
## --events=0:压测时设置的总请求书,因为上面已经定义了总执行时长,所以总请求数可以设定为 0;也可以只设定总请求数,不设定最大执行时长## --report-interval=10 :表示每10秒输出一次测试进度报告,输出对应下面的,压测中的测试报告## --percentile=99 表示设定采样比例,默认是 95%,即丢弃1%的长请求,在剩余的99%里取最大值,根据需要设定
-
-
执行测试
-
执行命令
sysbench \
--db-driver=pgsql \
--pgsql-host=127.0.0.1 \
--pgsql-port=5432 \
--pgsql-user=postgres \
--pgsql-password=postgres \
--pgsql-db=test_db \
--tables=4 \
--table-size=10000000 \
--threads=50 \
--time=60 \
--events=0 \
--report-interval=10 \
--percentile=99 \
/usr/local/share/sysbench/oltp_read_write.lua \
run
-
压测中测试报告
[ 2s ] thds: 1 tps: 57.42 qps: 1152.35 (r/w/o: 807.34/229.67/115.33) lat (ms,95%): 23.10 err/s: 0.00 reconn/s: 0.00 [ 4s ] thds: 1 tps: 54.51 qps: 1091.20 (r/w/o: 764.14/218.04/109.02) lat (ms,95%): 25.74 err/s: 0.00 reconn/s: 0.00 [ 6s ] thds: 1 tps: 56.01 qps: 1123.61 (r/w/o: 786.58/225.02/112.01) lat (ms,95%): 23.95 err/s: 0.00 reconn/s: 0.00 [ 8s ] thds: 1 tps: 55.50 qps: 1106.46 (r/w/o: 774.47/220.99/111.00) lat (ms,95%): 24.83 err/s: 0.00 reconn/s: 0.00 [ 10s ] thds: 1 tps: 55.45 qps: 1108.51 (r/w/o: 775.81/221.80/110.90) lat (ms,95%): 24.38 err/s: 0.00 reconn/s: 0.00 - 最终测试报告
OLTP test statistics:
    queries performed:
        read:                            941248   #读总数
        write:                           268928   #写总数
        other:                           134464   #其他操作总数(SELECT、INSERT、UPDATE、DELETE之外的操作,例如COMMIT等)
        total:                           1344640  #全部总数
    transactions:                        67232  (112.04 per sec.)  #总事务数(每秒事务数)
    read/write requests:                 1210176 (2016.73 per sec.) #读写总数(每秒读写次数)
    other operations:                    134464 (224.08 per sec.) #其他操作总数(每秒其他操作次数)
    ignored errors:                      0      (0.00 per sec.)
    reconnects:                          0      (0.00 per sec.)

General statistics:
    total time:                          600.0698s   #总耗时
    total number of events:              67232  #共发生多少事务数
    total time taken by event execution: 4799.8569s # 所有事务耗时相加(不考虑并行因素)
    response time:
         min:                                  2.09ms   #最小耗时
         avg:                                 71.39ms  #平均耗时
         max:                                839.32ms #最大耗时
         approx.  95 percentile:             309.40ms 超过95%平均耗时

Threads fairness:
    events (avg/stddev):           8404.0000/17.56
    execution time (avg/stddev):   599.9821/0.02
-
-
测试数据清理
sysbench \
--db-driver=pgsql \
--pgsql-host=127.0.0.1 \
--pgsql-port=5432 \
--pgsql-user=postgres \
--pgsql-password=postgres \
--pgsql-db=test_db \
--tables=4 \
--table-size=10000000 \
--threads=50 \
--time=60 \
--events=0 \
--report-interval=10 \
--percentile=99 \
/usr/local/share/sysbench/oltp_read_write.lua \
cleanup
-
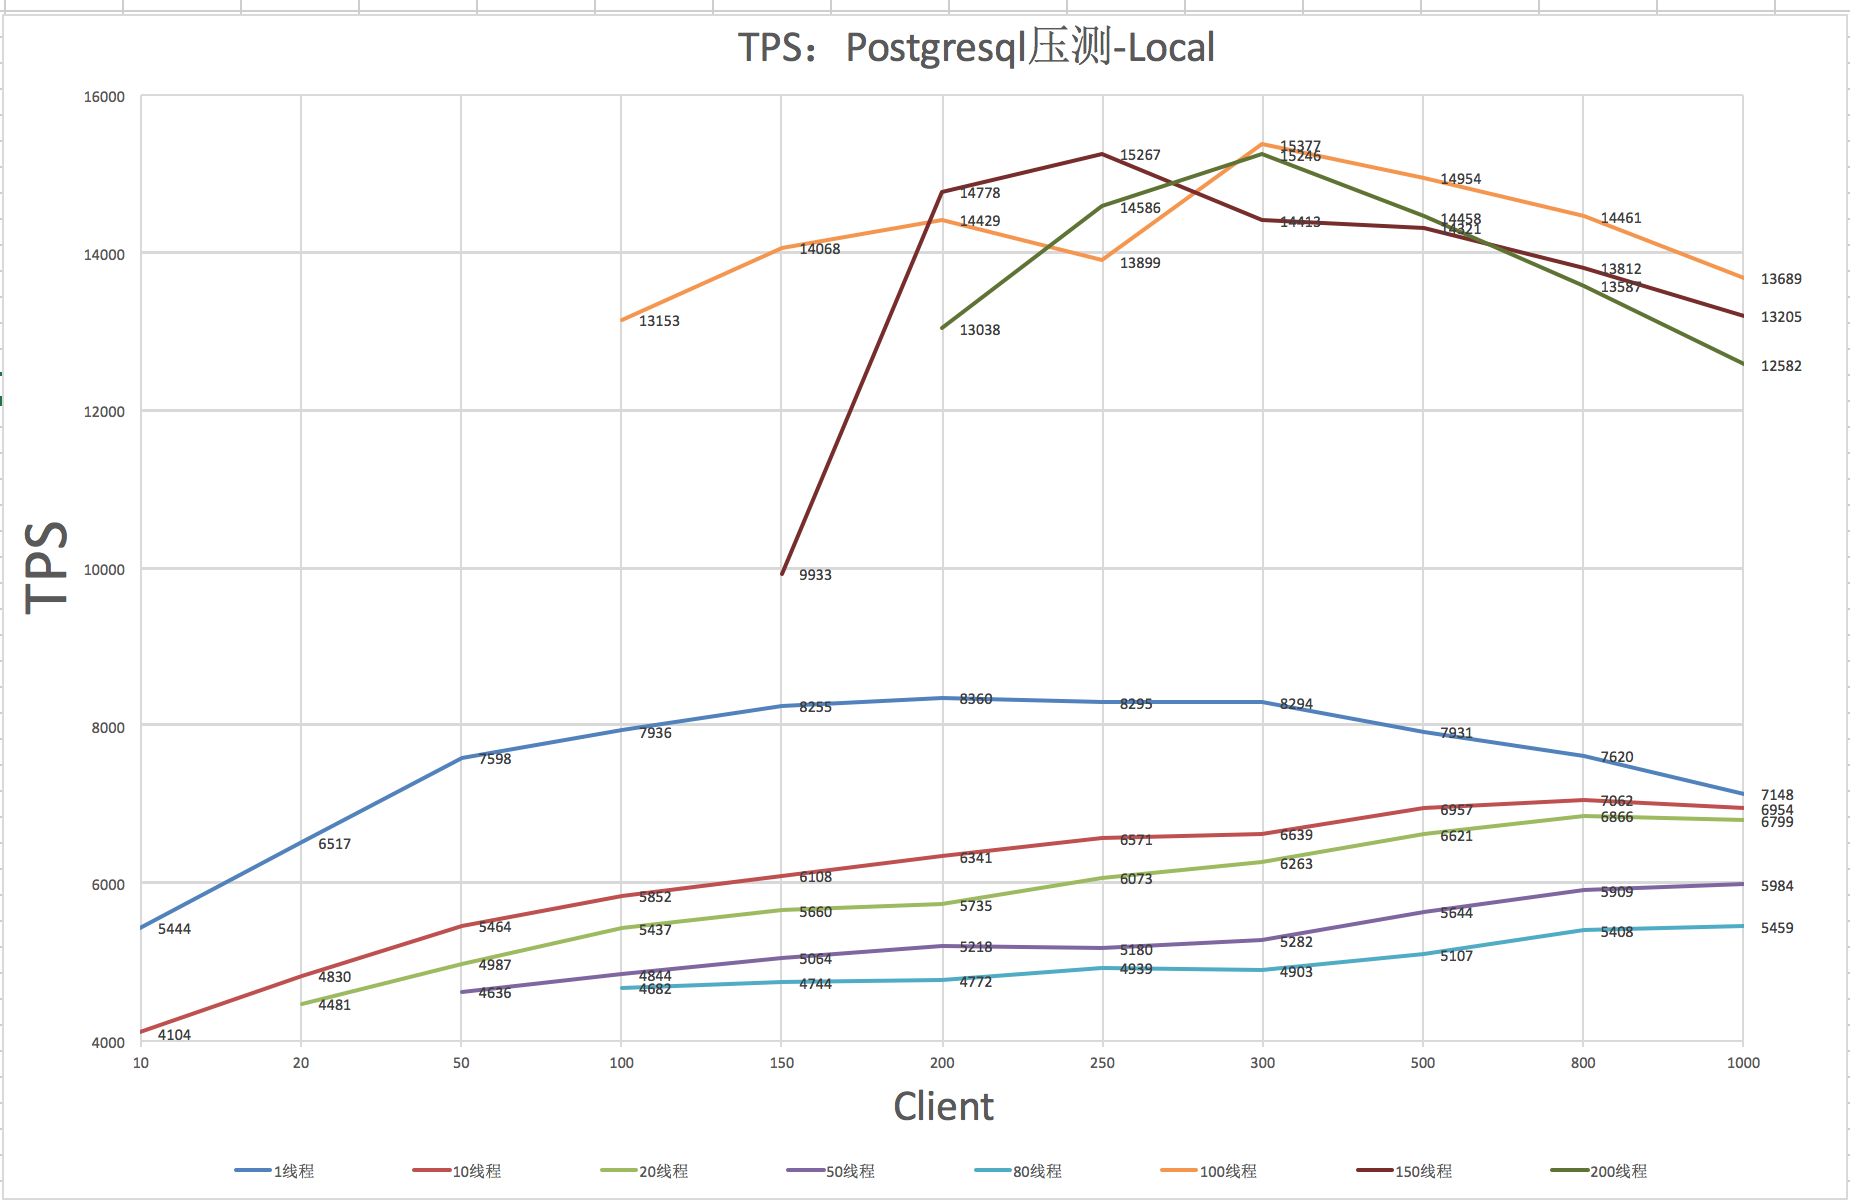
五、压测结果
![]()
六、问题建议
-
补充压测脚本
vim pgyace.sh
  pgsqldb=test_db
  pghost=127.0.0.1
  testpath=/opt/pgtest
  mkdir -p $testpath
  mv $testpath/*.log $testpath/tmp
  #echo '------------------小猪启动$(date "+%Y-%m-%d %H:%M:%S")------------------'
  for i in {1,10,20,50,80,100}
  do
        echo "------------------$i只小猪飞升$(date "+%Y-%m-%d %H:%M:%S")------------------"
        echo "$(date "+%Y-%m-%d %H:%M:%S")" > $testpath/sysbench-pgtest-$i.log
        sysbench --db-driver=pgsql --pgsql-host=$pghost --pgsql-port=5432 --pgsql-user=postgres --pgsql-password=postgres --pgsql-db=$pgsqldb --tables=2 --oltp-table-size=100000 --threads=$i --time=120 --events=0 --report-interval=10 --percentile=99 /usr/local/share/sysbench/tests/include/oltp_legacy/oltp.lua run >> $testpath/sysbench-pgtest-$i.log 2>&1
        echo "$(date "+%Y-%m-%d %H:%M:%S")" >> $testpath/sysbench-pgtest-$i.log
        sleep 60s
  done
后台执行
nohup ./pgyace.sh >/dev/null 2>&1 &
-

 浙公网安备 33010602011771号