Docker搭建EFK日志收集系统,并自定义es索引名
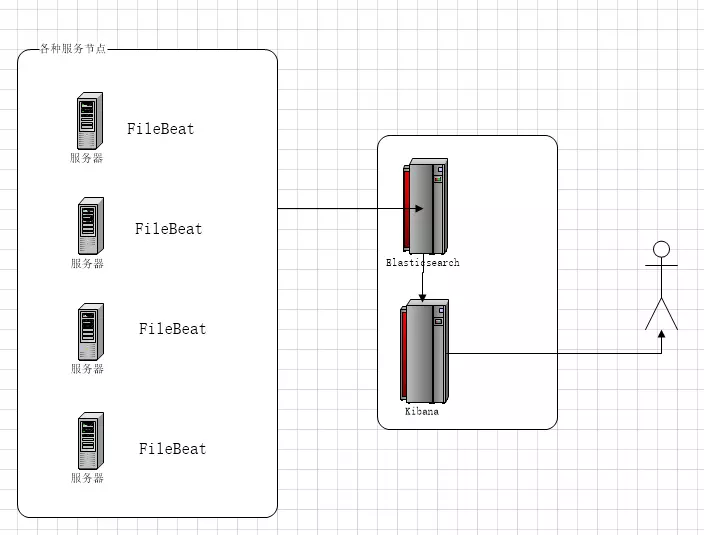
EFK架构图
一、EFK简介
EFK不是一个软件,而是一套解决方案,并且都是开源软件,之间互相配合使用,完美衔接,高效的满足了很多场合的应用,是目前主流的一种日志系统。
EFK是三个开源软件的缩写,分别表示:Elasticsearch , FileBeat, Kibana , 其中ELasticsearch负责日志保存和搜索,FileBeat负责收集日志,Kibana 负责界面

Elasticsearch:是个开源分布式搜索引擎,提供搜集、分析、存储数据三大功能。
特点:分布式,自动发现,索引自动分片,索引副本机制,restful风格接口,多数据源,自动搜索负载等。

kibana:是一个开源和免费的工具,它可以为 Logstash 、Beats和 ElasticSearch提供友好的web可视化界面,帮助您汇总、分析和搜索重要数据日志。

Filebeat由两个主要组件组成:prospector 和harvester。
    启动Filebeat时,它会启动一个或多个查找器(prospector),查看您为日志文件指定的本地路径。 对于prospector 所在的每个日志文件,prospector 启动harvester。 每个harvester都会为新内容读取单个日志文件,并将新日志数据发送到libbeat,后者将聚合事件并将聚合数据发送到您为Filebeat配置的输出。

Filebeat隶属于Beats。目前Beats包含六种工具:
    Packetbeat(搜集网络流量数据)
    Metricbeat(搜集系统、进程和文件系统级别的 CPU 和内存使用情况等数据)
    Filebeat(搜集文件数据)
    Winlogbeat(搜集 Windows 事件日志数据)
    Auditbeat( 轻量型审计日志采集器)
    Heartbeat(轻量级服务器健康采集器)

Logstash替换成了FileBeat,因为Filebeat相对于Logstash来说有2个好处:
    1、侵入低,无需修改程序目前任何代码和配置
    2、相对于Logstash来说性能高,Logstash对于IO占用很大
二、Docker部署EFK
1、部署前考虑安全加密问题
1、修改服务默认的端口号
2、防火墙设置
3、页面用户名密码验证
2、Docker搭建单台elasticsearch,并开启安全验证
#提前准备
docker pull elastic/elasticsearch:7.1.0
mkdir /server/docker/efk/es/
vim /server/docker/efk/es/es.yml
cluster.name: elasticsearch-cluster
network.host: 0.0.0.0
http.port: 9200
xpack.security.enabled: true   #这一步是开启x-pack插件
docker启动es:
docker run --name=es -p 9200:9200 -p 9300:9300 \
-e ES_JAVA_OPTS="-Xms256m -Xmx512m" \
-e "discovery.type=single-node" \
-v /server/docker/efk/es/es.yml:/usr/share/elasticsearch/config/elasticsearch.yml \
-itd elastic/elasticsearch:7.1.0
注:-e "discovery.type=single-node"    #意思为单台启动
   -e ES_JAVA_OPTS="-Xms256m -Xmx512m"    #设置内存限制
EFK版本可以选择最新的,目前是7.12.1
开启安全认证:
docker exec -it es /bin/bash         #进入容器内部
cd /usr/share/elasticsearch/bin
./elasticsearch-certutil cert -out config/elastic-certificates.p12 -pass ""        #开启x-pack安全认证证书
./elasticsearch-users useradd admin -p 123456 -r superuser  #创建一个用户
./elasticsearch-users list       #查看有哪些用户

#如想修改用户密码、删除用户:
./elasticsearch-users userdel admin      #删除用户
./elasticsearch-users passwd 用户名      #修改用户密码
3、Docker搭建kibana
#提前准备
mkdir /server/docker/efk/kibana/
vim /server/docker/efk/kibana/kibana.yml
server.name: kibana
server.host: "0.0.0.0"
server.port: 5601
kibana.index: ".kibana"
elasticsearch.hosts: [ "http://192.168.1.10:9200" ]
elasticsearch.username: "admin"
elasticsearch.password: "123456"
xpack.security.enabled: true
i18n.locale: "zh-CN"
docker启动kibana:
docker run --restart=always --name=kibana -p 5601:5601 \
-e ELASTICSEARCH_URL=http://192.168.1.10:9200 \
-v /server/docker/efk/kibana/kibana.yml:/usr/share/kibana/config/kibana.yml \
-itd elastic/kibana:7.1.0
访问kibana页面:http://192.168.1.10:5601
    登录名:admin
    密码:123456
4、Filebeat俩种方式部署
tar -xf filebeat-7.1.0-linux-x86_64.tar.gz
mv filebeat-7.1.0-linux-x86_64 /usr/local/filebeat-7.1.0
cd /usr/local/filebeat-7.1.0

#默认索引名字为“filebeat-*”,所有的日志都收集在这个索引下,所以我们需要自定义,实现索引开头一致,中间是各自的程序名,看名字就知道是哪个程序日志。
vim filebeat.yml
filebeat.inputs:

#定义日志收集路径
- type: log
  enabled: true
  paths:
    - /server/apache-tomcat-8.5.34-9081/logs/catalina.out
    - /server/apache-tomcat-8.5.34-9081/webapps/thirdBuy/logs/*.log
  fields:
    source: dubbo
- type: log
  enabled: true
  paths:
    - /home/project/logs/eureka-service/eureka-service.log
  fields:
    source: eureka-service
- type: log
  enabled: true
  paths:
    - /home/project/logs/gateway-service/gateway-service.log
  fields:
     source: gateway-service

filebeat.config.modules:
  path: ${path.config}/modules.d/*.yml
  reload.enabled: true

setup.template.settings:
  index.number_of_shards: 1

#定义kibana的IP:PORT
setup.kibana:
  host: "192.168.1.10:5601"

#定义模板的相关信息
setup.template.name: "xm_log"
setup.template.pattern: "xm-*"
setup.template.overwrite: true
setup.template.enabled: true

#自定义ES的索引需要把ilm设置为false
setup.ilm.enabled: false

# 定义ES的IP:PORT
output.elasticsearch:
  hosts: ["192.168.1.10:9200"]
  username: "admin"
  password: "123456"
  # 这里的index前缀"xm"与模板的pattern匹配,中间这一串设置为field.source变量,方面后面具体的匹配
  index: "xm-%{[fields.source]}-*"
  indices:
  #  这里的前缀"xm"同为与模板的pattern匹配,中间为field.source具体的值,当前面的input的field.source值与这里的匹配时,则index设置为定义的值
    - index: "xm-dubbo-%{+yyyy.MM.dd}"
      when.equals:
        fields:
          source: "dubbo"
    - index: "xm-eureka-service-%{+yyyy.MM.dd}"
      when.equals:
        fields:
          source: "eureka-service"
    - index: "xm-gateway-service-%{+yyyy.MM.dd}"
      when.equals:
        fields:
          source: "gateway-service"

processors:
  - add_host_metadata: ~
  - add_cloud_metadata: ~
根据自己的实际情况自定义filebeat.yml配置文件
启动filebeat:(为防止filebeat挂掉,可以写一个启动脚本)
vim /usr/local/filebeat-7.1.0/start.sh
#! /bin/bash
ps -ef | grep filebeat | grep -v grep
if [ $? -eq 0 ];then
    echo "It's running...."
    exit 0
else
    nohup ./filebeat > logs/filebeat.log 2>&1 &
    echo "-----------starting----------"
fi
添加定时:
0 8 * * * /bin/sh /usr/local/filebeat-7.1.0/start.sh
(2)docker部署filebeat
运行时要把需要收集的日志,和filebeat.yml配置文件挂载到容器里面。
vim filebeat.yml
filebeat:
  prospectors:
    - input_type: log
      paths:  # 这里是容器内的path
          - /var/log/command.log
      json.keys_under_root: true  # 使Filebeat解码日志结构化为JSON消息,设置key为输出文档的顶级目录。 如果不需要json格式输出,可以删除这两个json参数
      json.overwrite_keys: true # 覆盖其他字段
  registry_file: /usr/share/filebeat/data/registry/registry  # 这个文件记录日志读取的位置,如果容器重启,可以从记录的位置开始取日志
output:
  elasticsearch:  # 我这里是输出到elasticsearch,也可以输出到logstash
    index: "rocket"  #  kibana中的索引
    hosts: ["192.168.1.10:9200"] # elasticsearch地址
docker运行filebeat:
docker run  --restart=always --name=filebeat \
-v /var/log/command.log:/var/log/command.log:ro \
-v /data/filebeat/filebeat.yml:/usr/share/filebeat/filebeat.yml \
-v /data/filebeat/registry/:/usr/share/filebeat/data/registry/
-d  elastic/filebeat:7.1.0
三、kibana页面操作
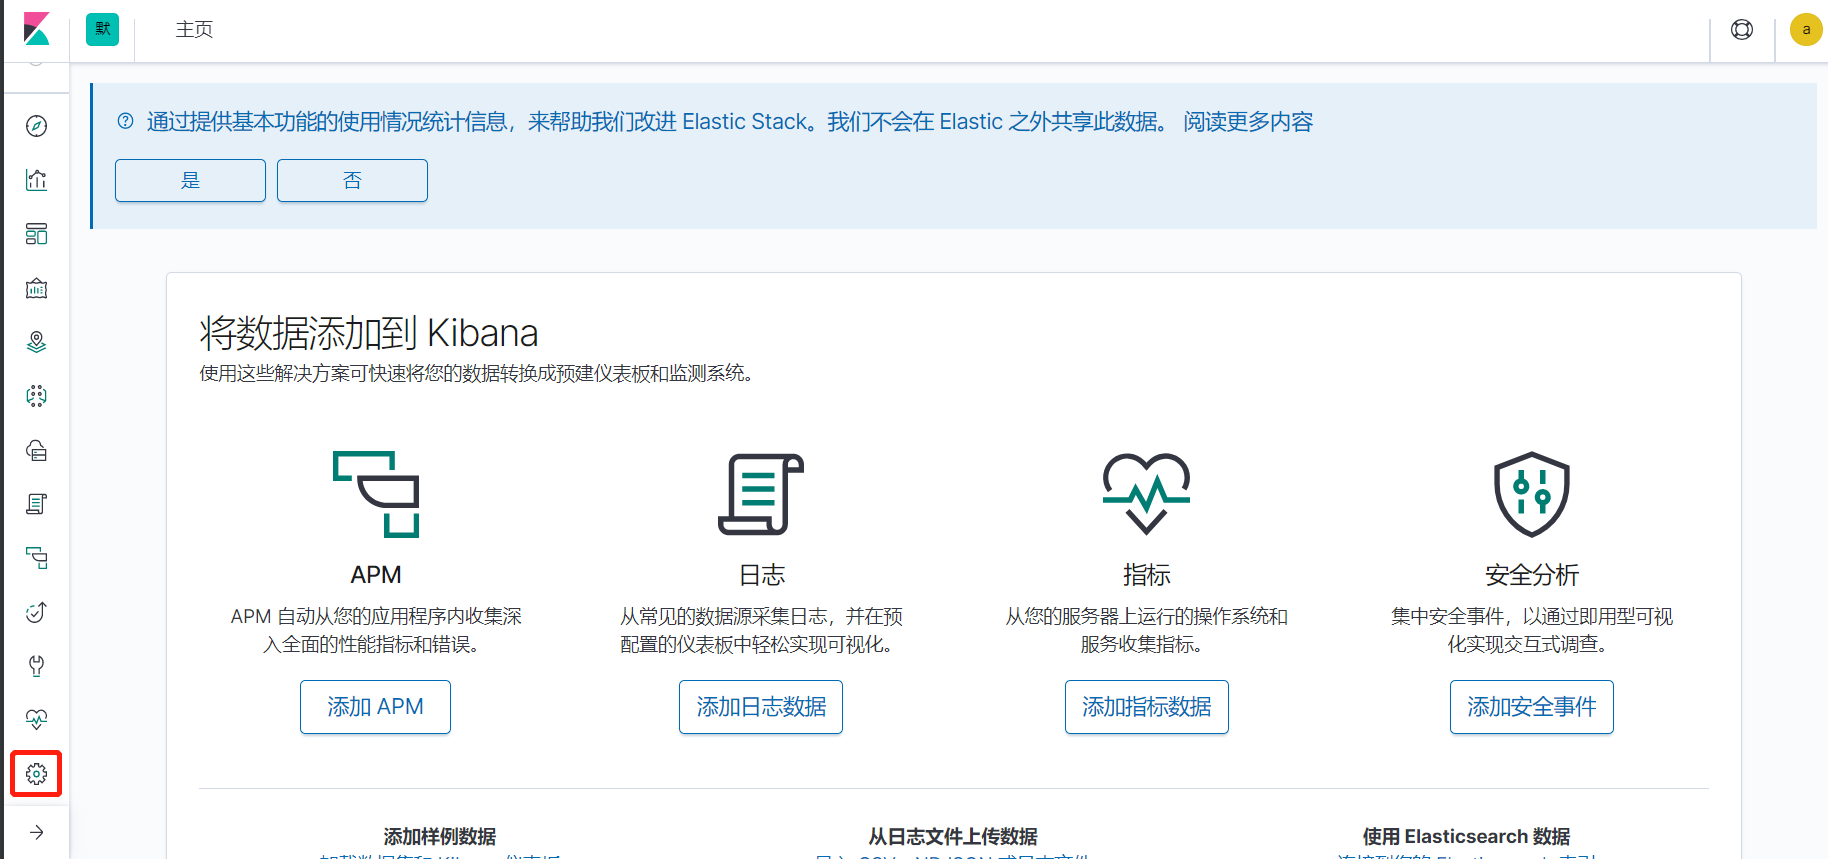
进入管理界面,查看es索引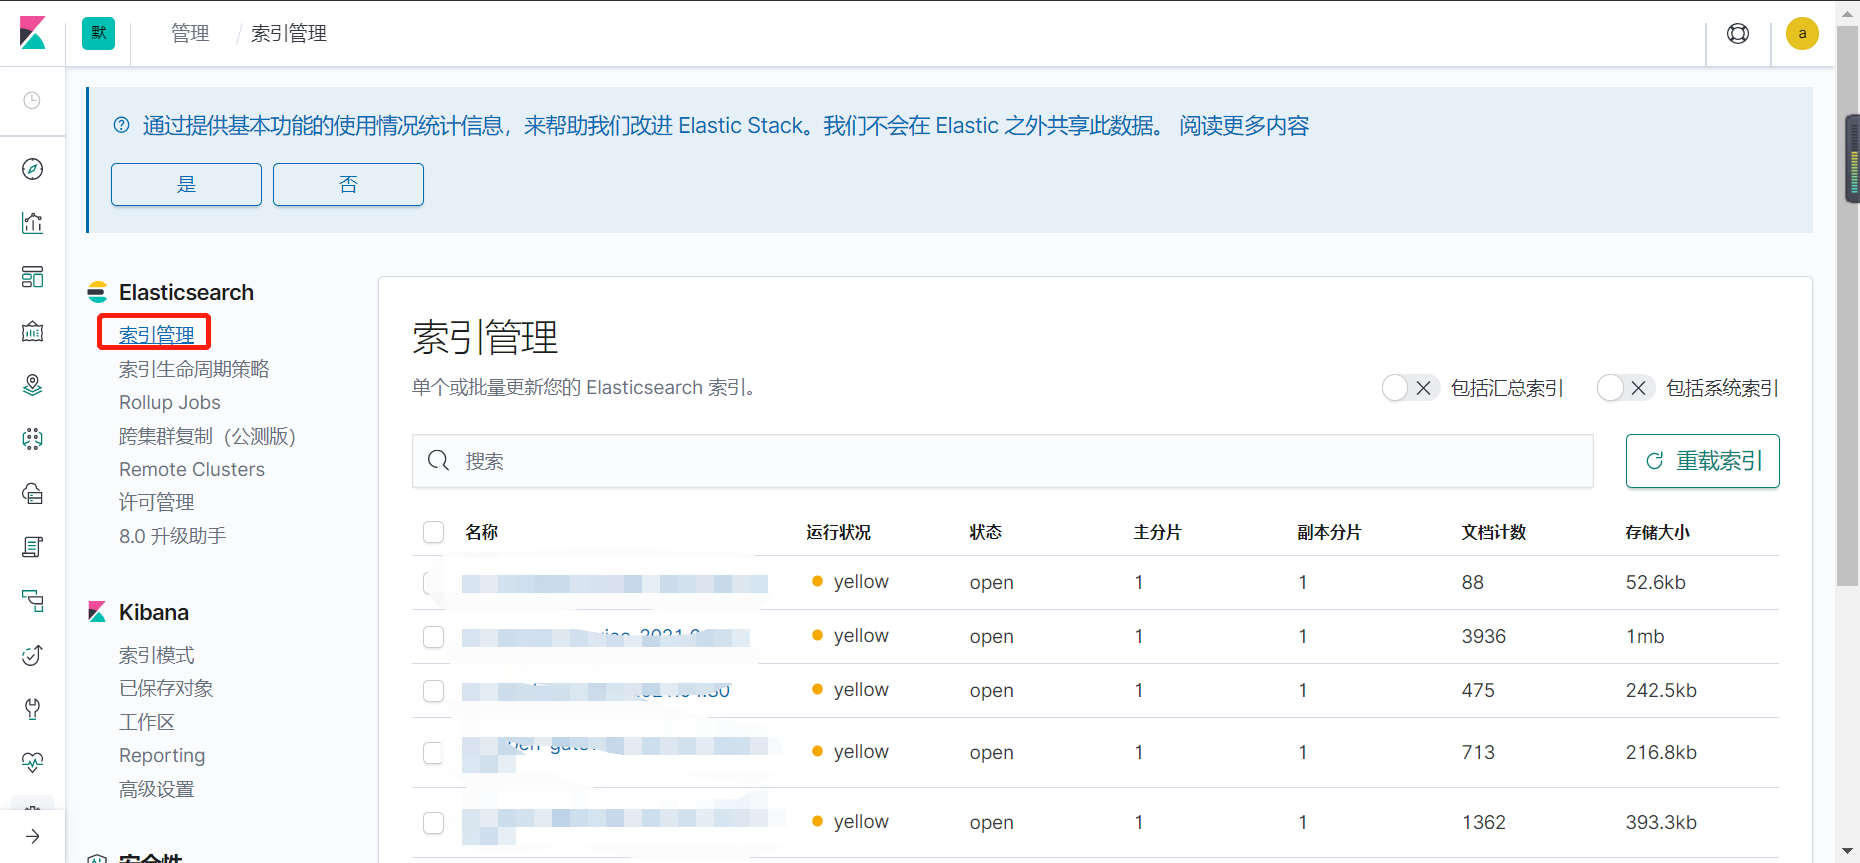
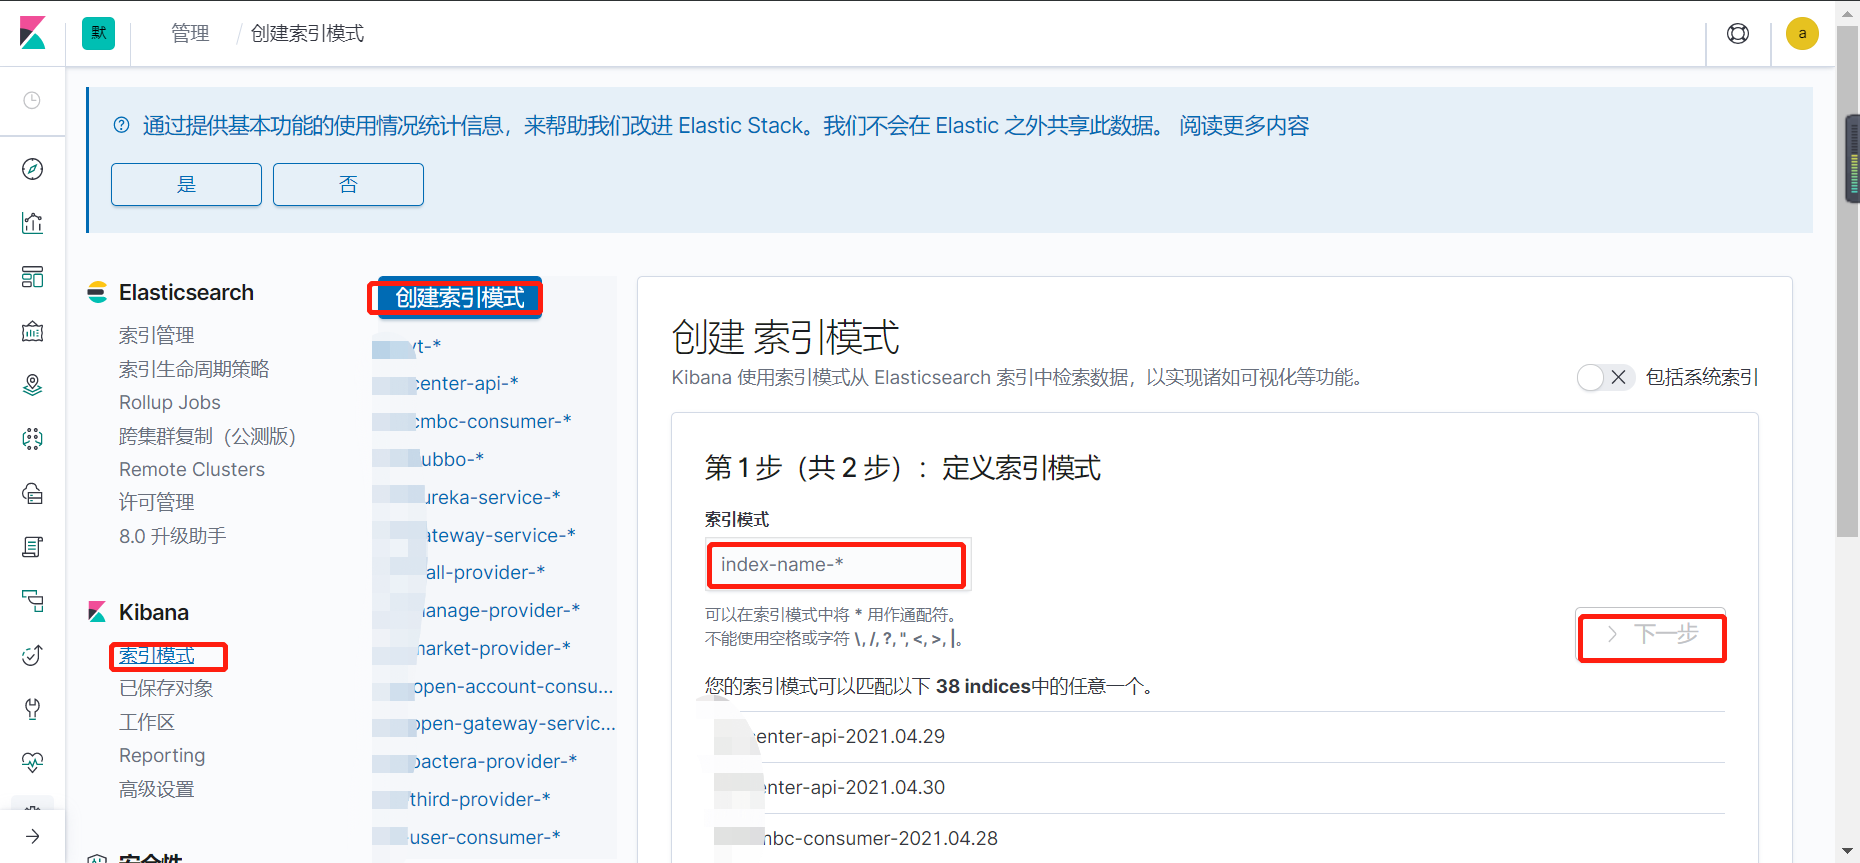
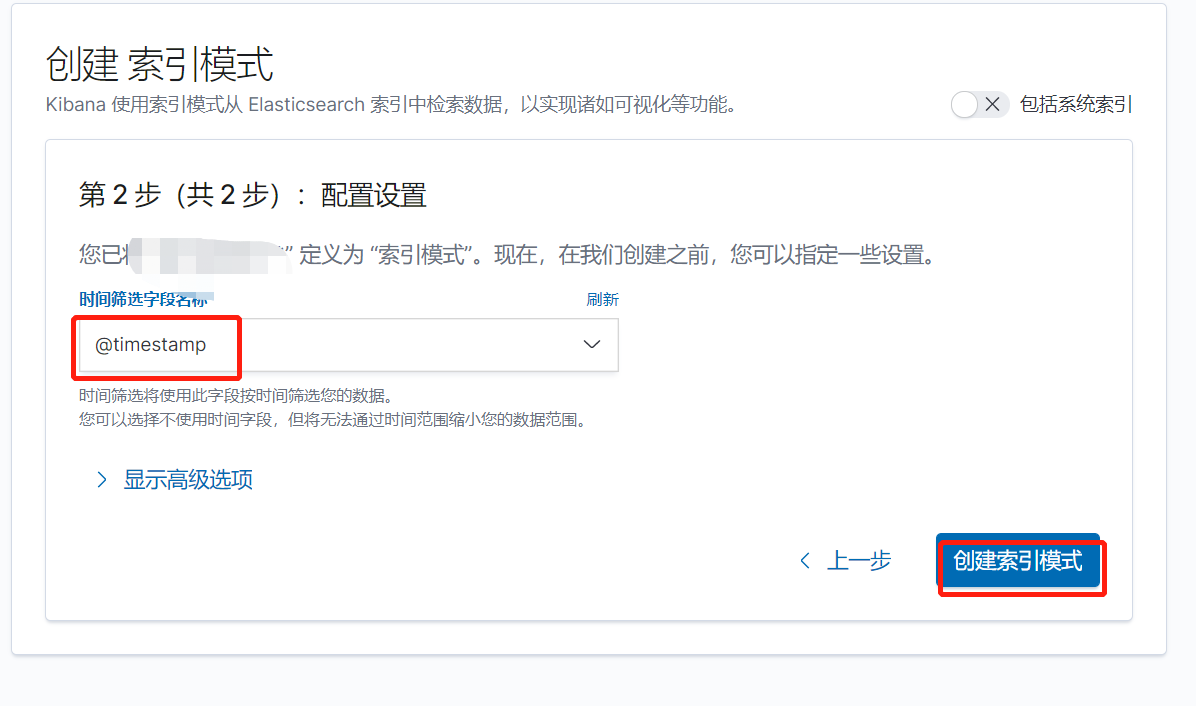
1、创建索引
2、搜索日志
指定项目日志,可以选定字段、时间查看
3、实时查看日志

四、清理efk索引缓冲
由于索引缓冲太多,导致efk运行缓慢,所以需要定时删除几天前的索引缓冲。
手动删除:
curl -u admin:123456 -XGET http://192.168.1.10:9200/_cat/indices?v | grep 2021.04.28 | awk '{print $3}'      #查看某天的索引
curl -s -u admin:123456 -XDELETE http://192.168.1.10:9200/*-2021.03.10        #删除指定索引
脚本定期删除:
vim es-index-clean.sh
#!/bin/bash
DATE=`date -d "10 days ago" +%Y.%m.%d`
#删除10天前的日志
ck=`curl -s -u admin:123456 -XGET http://192.168.1.10:9200/_cat/indices?v | grep $DATE |awk '{print $3}'`

for index in $ck
do
    curl -s -u admin:123456 -XDELETE http://192.168.1.10:9200/$index
    if [ $? -eq 0 ];then
      echo "---------delete $DATE index success--------"
    else
      echo "---------delete $DATE index fail--------"
    fi
done
添加定时:
0 1 * * * /bin/sh /home/docker/server/efk/es/es-index-clean.sh
五、配置域名访问(nginx)
vim /usr/local/nginx/conf/nginx.conf
server {
  listen 80;
  server_name efk.test.com;

  location / {
    pass_proxy http://192.168.1.10:5601;
  }
  access_log logs/efk.test.com_access.log;
}
/usr/local/nginx/sbin/nginx -t #检查nginx配置文件
/usr/local/nginx/sbin/nginx -s reload #重新加载配置文件
访问:http://efk.test.com
原文链接:https://www.cnblogs.com/cfzy/p/14717900.html
大雨里百鬼夜行,我们混在其中,比鬼还高兴。
作者:等风来~~
本博客所有文章仅用于学习、研究和交流目的,欢迎转载。
如果觉得文章写得不错,或者帮助到您了,请点个赞。
如果文章有写的不足的地方,请你一定要指出,因为这样不光是对我写文章的一种促进,也是一份对后面看此文章的人的责任。谢谢。

 浙公网安备 33010602011771号