Nginx Access Log日志统计分析常用命令和工具
首先,确认nginx日志的格式。默认的combined格式通常包含以下字段:
$remote_addr - $remote_user [$time_local] "$request" $status $body_bytes_sent "$http_referer" "$http_user_agent"
其中,$request对应请求方法、URL和协议,$body_bytes_sent是发送的字节数(即流量)
使用AWK处理日志
每秒请求量统计
awk '{print $4}' access.log |cut -c 14-21|sort|uniq -c|sort -nr|head -n 100
查看访问100次以上的IP
awk '{print $1}' access.log | sort -n |uniq -c |awk '{if($1 >100) print $0}'|sort -rn
统计每个 URL 的访问次数(TOP 10)
awk '{ split($7, url, "?"); count[url[1]]++ }
END { for (u in count) print count[u], u }' access.log | sort -nr | head -n10
统计每个 IP 的请求次数(TOP 10)
awk '{ ip_count[$1]++ }
END { for (ip in ip_count) print ip_count[ip], ip }' access.log | sort -nr | head -n10
统计 HTTP 状态码分布
awk '{ code_count[$9]++ }
END { for (code in code_count) print code, code_count[code] }' access.log | sort -k1
统计流量消耗最大的 URL(TOP 10)
awk '{ split($7, url, "?"); bytes[url[1]] += $10 }
END { for (u in bytes) print bytes[u], u }' access.log | sort -nr | head -n10
统计每个 IP 的流量消耗(TOP 10)
awk '{ ip_bytes[$1] += $10 }
END { for (ip in ip_bytes) print ip_bytes[ip], ip }' access.log | sort -nr | head -n10
统计每小时请求量
awk -F'[ :]' '{ hour=$3":"$4; req_count[hour]++ }
END { for (h in req_count) print h, req_count[h] }' access.log | sort -k1
统计 HTTP 方法分布(GET/POST等)
awk '{ split($6, method, "\""); methods[method[2]]++ }
END { for (m in methods) print m, methods[m] }' access.log
统计 User-Agent 类型(TOP 10)
awk -F'"' '{ ua=$6; if (ua ~ /curl|wget|python/) type="Script";
else if (ua ~ /Chrome/) type="Chrome";
else if (ua ~ /Firefox/) type="Firefox";
else type="Other";
ua_count[type]++ }
END { for (t in ua_count) print t, ua_count[t] }' access.log
过滤特定状态码(如 4xx/5xx)的请求
awk '$9 >= 400 && $9 < 600 { print $1, $7, $9 }' access.log | head -n20
统计请求耗时(需日志包含 $request_time)
# 假设日志格式包含 $request_time(例如第 $11 字段)
awk '{ time_sum += $11; count++ }
END { print "Avg:", time_sum/count, "s" }' access.log
使用 mawk(比 GNU awk 更快)
统计独立 IP 数量
awk '{ ip_list[$1]++ } END { print length(ip_list) }' access.log
使用awk提取URL和流量数据
awk '
function format_bytes(bytes) {
if (bytes >= 1024^3) return sprintf("%.2f GB", bytes / 1024^3);
else if (bytes >= 1024^2) return sprintf("%.2f MB", bytes / 1024^2);
else if (bytes >= 1024) return sprintf("%.2f KB", bytes / 1024);
else return bytes " B";
}
{
url = $7;
# 去除URL的查询参数(可选)
sub(/\?.*/, "", url);
# 累加流量(假设$10是body_bytes_sent)
bytes[url] += $10;
}
END {
# 输出结果并格式化
for (u in bytes) printf "%15s %12s\n",format_bytes(bytes[u]), u;
}' all.log | egrep '\s(M|G)B'|sort -nr | head -20
awk '
{
# 去除$5(请求字段)的双引号
gsub(/"/, "", $5);
# 分割请求字段为方法、URL、协议
split($5, req, " ");
url = req[2];
# 去除URL的查询参数(可选)
sub(/\?.*/, "", url);
# 累加流量(假设$7是body_bytes_sent)
bytes[url] += $7;
}
END {
# 输出结果并格式化
for (u in bytes) printf "%10d %s\n", bytes[u], u;
}' access.log | sort -nr | head -n 10
字段位置:根据实际日志格式调整$5(请求)和$7(流量)的位置。
查询参数:若需区分带参数的URL,移除sub(/\?.*/, "", url)。
多文件处理:使用*.log通配符处理多个日志文件。
此方法高效处理大日志文件,快速定位高流量URL
按IP段统计流量
awk '
function format_bytes(bytes) {
if (bytes >= 1024^3) return sprintf("%.2f GB", bytes / 1024^3);
else if (bytes >= 1024^2) return sprintf("%.2f MB", bytes / 1024^2);
else if (bytes >= 1024) return sprintf("%.2f KB", bytes / 1024);
else return bytes " B";
}
{
# 提取IP(假设$1是$remote_addr)
ip = $1;
# 分割IP为4个段(如192.168.1.123 → [192,168,1,123])
split(ip, ip_segments, ".");
# 组合前3段作为IP段(如192.168.1)
ip_segment = ip_segments[1] "." ip_segments[2] "." ip_segments[3];
#ip_segment = ip_segments[1] "." ip_segments[2]
# 提取流量(假设$10是$body_bytes_sent)
bytes = $10;
# 按IP段累加流量
traffic[ip_segment] += bytes;
}
END {
# 输出结果并按流量排序
for (seg in traffic) printf "%15s %12s\n", seg, format_bytes(traffic[seg]);
}' cdn.log| egrep "GB|MB"|sort -k2 -nr|head -30
通过这些命令,可以快速分析 Nginx 日志中的关键指标,定位性能瓶颈或异常请求
如果不想使用上面命令,或者记不住怎么办,其实有个统计日志的神器
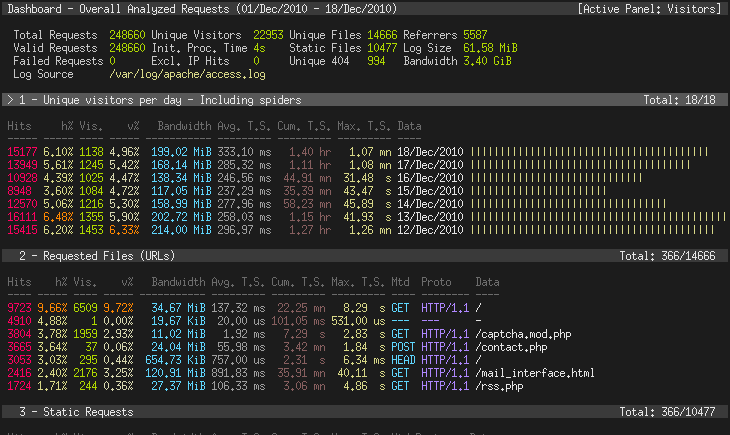
GoAccess - 可视化 Web 日志分析工具
https://goaccess.io/
https://www.goaccess.cc/ #中文版本的
dnf install goaccess -y
GoAccess 是一个开源实时 Web 日志分析器和交互式查看器,可在Linux系统上的 终端中或通过浏览器运行。它为需要动态可视化服务器报告的系统管理员提供快速且有价值的 HTTP 统计信息。
下面列举相关的一些命令,更多命令可以查看官网手册,或者用DeepSeek
goaccess --version #参看当前安装的版本
终端实时报告
goaccess cdn.log --log-format=COMBINED #查看分析结果,主要要加这个日志格式,这个是默认nginx 的格式
goaccess -f /var/log/apache2/access.log --log-format=COMBINED # 实时统计
生成静态 HTML 报告
goaccess cdn.log --log-format=COMBINED -o test.html
这个可以把test.htm 下载到本地,用浏览器打开就可以看到了
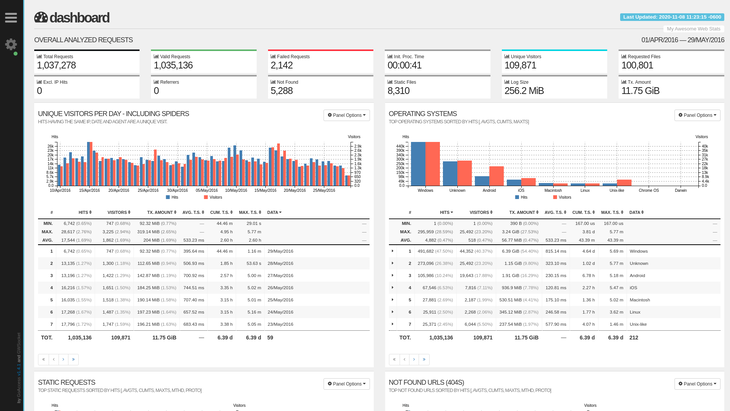
生成支持实时更新的 HTML 报告(需 Web 服务器支持)
goaccess /var/log/nginx/access.log -o /var/www/html/report.html \
--log-format=COMBINED --real-time-html
浏览器访问 http://服务器IP/report.html,报告会自动刷新。
核心参数说明
| 参数 | 用途 |
|---|---|
--log-format=FORMAT |
指定日志格式(如 COMBINED、VCOMBINED) |
--date-format=FORMAT |
日志日期格式(如 %d/%b/%Y) |
--time-format=FORMAT |
日志时间格式(如 %H:%M:%S) |
-o <输出文件> |
输出到文件(支持 .html、.json、.csv) |
--real-time-html |
启用实时 HTML 报告 |
--geoip-database=<文件> |
指定 GeoIP 数据库路径(显示地理位置) |
--ignore-crawlers |
忽略爬虫请求 |
--exclude-ip=<IP> |
排除特定 IP 的请求 |
场景示例
分析 2025 年 05月 10 日的日志
goaccess /var/log/nginx/access.log \
--log-format=COMBINED \
--date-format='%d/%b/%Y' \
--time-format='%H:%M:%S' \
--ignore-panel=VISITORS \ # 隐藏访客面板
--no-progress \ # 不显示进度条
--output=report.html
结合 GeoIP 显示地理位置
dnf install geoipupdate # RockyLinux/CentOS
geoipupdate # 更新数据库
goaccess access.log \
--log-format=COMBINED \
--geoip-database=/usr/share/GeoIP/GeoIP.dat \
-o geo_report.html
排除特定 IP 或爬虫
goaccess access.log \
--log-format=COMBINED \
--exclude-ip=192.168.1.100 \ # 排除 IP
--ignore-crawlers \ # 忽略爬虫
-o filtered_report.html
分析压缩的日志文件
zcat access.log*.gz | goaccess - --log-format=COMBINED -o report.html
自定义日志格式
如果日志格式非默认 COMBINED,需指定日志格式参数。
例如,Nginx 自定义日志格式:
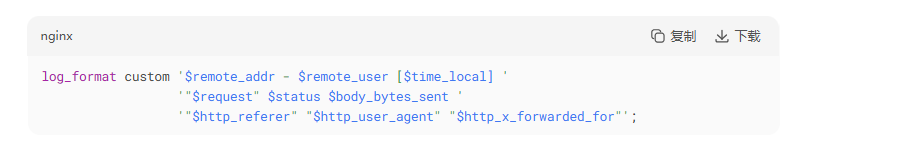
goaccess access.log \
--log-format='%h - %^ [%d:%t %^] "%r" %s %b "%R" "%u" "%^"' \
--date-format='%d/%b/%Y' \
--time-format='%H:%M:%S'
生成 JSON/CSV 报告
goaccess access.log --output=report.json # JSON 格式
goaccess access.log --output=report.csv # CSV 格式
监控实时日志
tail -f /var/log/nginx/access.log | goaccess - --log-format=COMBINED -o realtime.html --real-time-html
过滤 HTTP 状态码
仅分析 4xx 错误请求
awk '$9 ~ /4[0-9]{2}/ {print $0}' access.log | goaccess - --log-format=COMBINED
保留历史数据
合并多日志并保留历史趋势
goaccess access.log access.log.1 --keep-last=30 -o report.html # 保留 30 天数据
生成的报告包含以下核心模块
-
总览面板
-
总请求数、独立访客、流量、错误率等。
-
-
访问来源
-
客户端 IP、地理位置(需 GeoIP)、HTTP 方法。
-
-
请求分析
-
高频 URL、静态文件、404 页面。
-
-
用户行为
-
操作系统、浏览器、设备类型。
-
-
网络指标
-
请求耗时分布(需日志含
$request_time)。
-
通过上述方法,您可以快速掌握 GoAccess 的核心功能,高效分析 Web 访问日志,定位性能瓶颈或异常流量。
上面的内容均来自deepseek,有什么疑问尽可能的去官网看文档,或者通过deepseek 深度提问

 浙公网安备 33010602011771号