

QT QcustomPlot的简单使用
第一步、QcustomPlot是QT提供的一个第三方库,在使用前需要在QcustomPlot官网上进行下载。
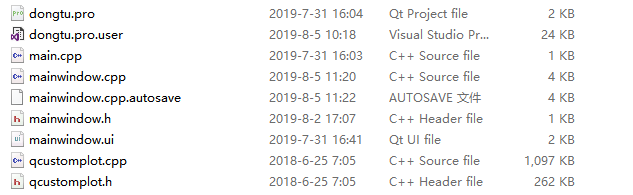
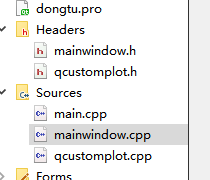
第二步、把解压完的QcustomPlot压缩包中的qcustomplot.h和qcustomplot.cpp文件添加到工程文件中来。使用时应先在源文件处点击添加现有文件,把这两个文件添加进来。
第三步、打开UI界面,把weiget控件添加到界面里,然后右键点击控件,选择提升
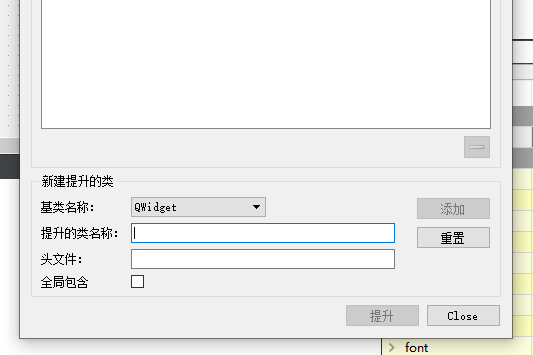
在提升的类名上写QcustomPlot,最后点击提升即可。
这样QcustomPlot这个第三方库就可以使用了。
以下是一简单的曲线代码。
.cpp文件
#include "mainwindow.h"
#include "ui_mainwindow.h"
#include <QTime>
#include <QDebug>

MainWindow::MainWindow(QWidget *parent) :
    QMainWindow(parent),
    ui(new Ui::MainWindow)
{
    ui->setupUi(this);
    //设置鼠标点击精度
    ui->customPlot->setSelectionTolerance(1);

    for(int i=0;i<20;i++)
    {
        num[i]=0;
    }
    n=0;
    QTimer *t = new QTimer(this);
    t->start(500);
    connect(t,SIGNAL(timeout()),this,SLOT(graph_show()));
    connect(ui->customPlot,SIGNAL(mouseRelease(QMouseEvent*)),this,SLOT(mouseReleaseEvent(QMouseEvent*)));
    //connect(tracer,SIGNAL(mouseMove(QMouseEvent*)),this,SLOT(mouseMoveEvent(QMouseEvent*)));

}

MainWindow::~MainWindow()
{
    delete ui;
}

void MainWindow::graph_show()
{
    n += PI/8;
    graph_show(ui->customPlot);
}


void MainWindow::graph_show(QCustomPlot *customPlot)
{

    QVector<double> x(20),y(20);
    for(int i=0;i<19;i++)
    {
        num[i]=num[i+1];
    }
    num[19]=n;
    for(int i=0;i<20;i++)
    {
        x[i] = i;
        y[i] = sin(num[i]);
    }
    //添加一条曲线
    customPlot->addGraph();
    //设置曲线的颜色
    customPlot->graph(0)->setPen(QPen(Qt::red));
    //给曲线传递两个参数
    customPlot->graph(0)->setData(x,y);
    //给曲线的横纵坐标命名
    customPlot->xAxis->setLabel("x");
    customPlot->yAxis->setLabel("y");
    //设置横纵坐标的范围
    customPlot->xAxis->setRange(0,20);
    customPlot->yAxis->setRange(-3,3);
    //进行曲线重画
    customPlot->replot();
    /*
    customPlot->setInteraction(QCP::iRangeZoom,true);
    customPlot->axisRect()->setRangeDrag(Qt::Vertical);
    customPlot->setInteraction(QCP::iRangeDrag,true);
    */
}

void MainWindow::mouseReleaseEvent(QMouseEvent *e)
{
    //排除非左鼠标键
    if (e->button() != Qt::LeftButton)
    {
        return;
    }

    //获取点击的点坐标
    QPointF ChickedPoint = e->pos();
    //排除区间外鼠标点
    if(!ui->customPlot->viewport().contains(e->pos()))
    {
        return;
    }
    //将像素坐标转换为轴值
    double currentx = ui->customPlot->xAxis->pixelToCoord(ChickedPoint.x());
    double currenty = ui->customPlot->yAxis->pixelToCoord(ChickedPoint.y());
    //使用QToolTip输出值,
    QToolTip::showText(mapToGlobal(e->pos()),QString("当前点值为:x=%1,y=%2").arg(currentx).arg(currenty),this);
}
.h文件
#ifndef MAINWINDOW_H
#define MAINWINDOW_H

#include <QMainWindow>
#include "ui_mainwindow.h"
#include <QMouseEvent>

#define PI 3.1415926

namespace Ui {
class MainWindow;
}

class MainWindow : public QMainWindow
{
    Q_OBJECT

public:
    explicit MainWindow(QWidget *parent = 0);
    ~MainWindow();
    //设置一容器
    double num[20];
    double n=0;
    void graph_show(QCustomPlot *customPlot);

public slots:
    void graph_show();
    void mouseReleaseEvent(QMouseEvent *e);
//     void mouseMoveEvent(QMouseEvent *e);

private:
    Ui::MainWindow *ui;
};

#endif // MAINWINDOW_H
静态曲线的命名方法可以选用:
    customPlot->legend->setVisible(true);
    customPlot->graph(0)->setName("sin");
此处是对第一条曲线进行命名为“sin“。

 浙公网安备 33010602011771号