K8S集群 日常操作
K8S
1、简单的日常操作
获取节点信息
kubectl get node
获取更多的信息后面的可以接 -o wide
kubectl get node -o wide
添加节点
可以使用kubeadm join 后面接入 token
2、下线节点相关操作 :
1、 首先要设置node 不能在接受新的pod 到该机器上
kubectl corden 节点名称
2、要把节点上的pod 移除,让它到其他节点上去运行。
kubectl drain 节点名称 --ignore-daemonsets
3、删除节点
kubectl delete node 节点名称
手动生成一个yaml 文件,然后发布
kubectl run nginx_web --image=nginx --replicas=3 --requests="cpu=100m,memory=100Mi" --expose 80 --port 80 --dry-run -o yaml > nginx.yaml
发布一个简单的应用
#kubectl run my-nginx --image=nginx --replicas=2 --port=80
#kubectl get deployments
///#kubectl expose deployment my-nginx --port=80 --type=clusterIP
#kubectl expose deployment my-nginx --port=80
#kubectl get svc
删除一个应用
kubectl delete deploy my-nginx // my-nginx 表是删除应用容器的名字
kubectl get job
kubectl get cj
K8S命令补全工具completion
1、yum install -y bash-completion
source /usr/share/bash-completion/bash_completion
source <(kubectl completion bash)
K8S更新镜像、代码修复bug.
1、 kubecel set image 类型(deployment) 项目名字 项目镜像名字=需要更新的程仓库镜像的名字 // 这里后面可以增加 --record 记录当前的命令
不知道镜像名字,我们也可以,kubectl edit deployment 项目名字 在这里可以看到镜像名字
示例 将nginx:1.17 版本回退到1.16
kubectl set image deployment test_web nginx=ngin:1.16
K8S 回滚镜像
Deployment 控制器
查看历史版本
1、kubectl rollout history 类型(deployment) 项目名称 查看
恢复上一个版本
1、kubectl rollout undo 类型(deployment) 项目名称
回滚到指定版本
kubectl rollout undo 类型 项目名称 --to-revision= 版本号
1、快速的缩容和扩容
kubectl scale 类型(deployment) 项目名称 --replicas=10 //快速的设置副本数量。
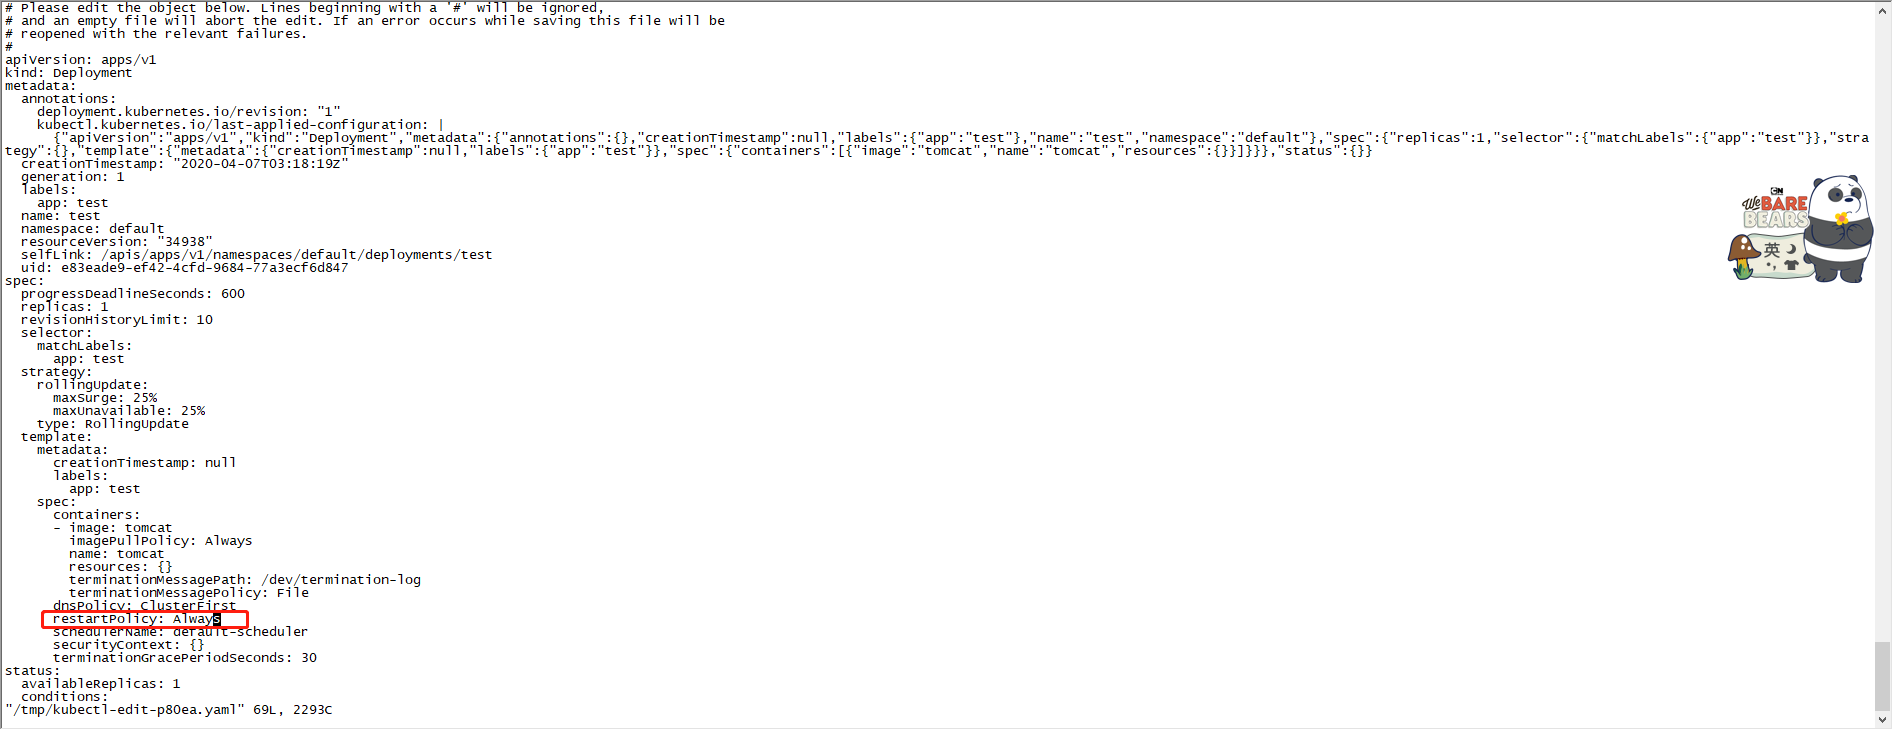
K8s 设置一个HA
kind: Deployment
metadata:
  creationTimestamp: null
  labels:
    app: test
  name: test
spec:
  replicas: 1
  selector:
    matchLabels:
      app: test
  strategy: {}
  template:
    metadata:
      creationTimestamp: null
      labels:
        app: test
    spec:
      containers:
      - image: tomcat
        name: tomcat
        resources: {}
status: {}
创建一个service,yaml
kubectl expose deployment test --port=80 --target-port=8080 --name=test -o yaml --dry-run > test_service.yaml
apiVersion: v1
kind: Service
metadata:
  creationTimestamp: null
  labels:
    app: test
  name: test
spec:
  ports:
  - port: 80
    protocol: TCP
    targetPort: 8080
  selector:
    app: test
  type: NodePort
status:
  loadBalancer: {}
kubectl autoscale deployment 项目名称 --min=2 --max=10
生成一个配置文件
kubectl autoscale deployment my-nginx --min=2 --max=10 -o yaml --dry-run > ha1.yaml
apiVersion: autoscaling/v1   //指定auto scling 版本
kind: HorizontalPodAutoscaler   //指定资源对象
metadata:
  name: my-nginx
spec:
  maxReplicas: 10            //
  minReplicas: 2             // 指定副本缩容扩容的范围
  scaleTargetRef:
    apiVersion: apps/v1
    kind: Deployment       //缩容的对象bind 是 发布 deployment
    name: my-nginx
  targetCPUUtilizationPercentage: 60 //加入指标基于cpu 的使用率来进行缩容扩容
scaleTargetRef:表示当前要伸缩对象是谁
之后应用yaml 文件
查看 hpa
kubectl get hpa 查看获取的指标信息 以及 副本信息
查看 各个pod 负载情况
kubectl top pods
查看hap具体操作信息
kuctl describe hpa 名称
解析json文件 可以安装 jq
yum install jq
工作流程:hpa -> apiserver -> kube aggregation -> metrics-server -> kubelet(cadvisor)
kubectl get hpa.v2beta2.autoscaling -o yaml > /tmp/hpa-v2.yaml
apiVersion: autoscaling/v2beta2
kind: HorizontalPodAutoscaler
metadata:
  name: web
  namespace: default
spec:
  scaleTargetRef:
    apiVersion: apps/v1
    kind: Deployment
    name: web
  minReplicas: 1
  maxReplicas: 10
  metrics:
  - resource:
    type: Resource
      name: cpu
      target:
        averageUtilization: 60
        type: Utilization
和之前的内容差不多,但是v2支持 :Pods和Object。
type: Pods
pods:
  metric:
    name: packets-per-second
  target:
    type: AverageValue
    averageValue: 1k
type: Object
object:
  metric:
    name: requests-per-second
  describedObject:
    apiVersion: networking.k8s.io/v1beta1
    kind: Ingress
    name: main-route
  target:
    type: Value
    value: 2k
metrics中的type字段有四种类型的值:Object、Pods、Resource、External。
-
Resource:指的是当前伸缩对象下的pod的cpu和memory指标,只支持Utilization和AverageValue类型的目标值。
-
Object:指的是指定k8s内部对象的指标,数据需要第三方adapter提供,只支持Value和AverageValue类型的目标值。
-
Pods:指的是伸缩对象Pods的指标,数据需要第三方的adapter提供,只允许AverageValue类型的目标值。
-
External:指的是k8s外部的指标,数据同样需要第三方的adapter提供,只支持Value和AverageValue类型的目标值。
# hpa-v2.yaml
apiVersion: autoscaling/v2beta2
kind: HorizontalPodAutoscaler
metadata:
  name: web
  namespace: default
spec:
  scaleTargetRef:
    apiVersion: apps/v1
    kind: Deployment
    name: web
  minReplicas: 1
  maxReplicas: 10
  metrics:
  - type: Resource
    resource:
      name: cpu
      target:
        type: Utilization
        averageUtilization: 50
  - type: Pods
    pods:
      metric:
        name: packets-per-second
      target:
        type: AverageValue
        averageValue: 1k
  - type: Object
    object:
      metric:
        name: requests-per-second
      describedObject:
        apiVersion: networking.k8s.io/v1beta1
        kind: Ingress
        name: main-route
      target:
        type: Value
        value: 10k
工作流程:hpa -> apiserver -> kube aggregation -> prometheus-adapter -> prometheus -> pods
获取一个正在运行的容器以yaml 方式展现
1、kubectl get deployment 项目名称 -o yaml --export > 新的文件.yaml
Pod的相关使用
apiVersion API版本 kind 资源类型

metadata 资源元数据 spec 资源规格

replicas 副本数量

selector 标签选择器 template Pod模板

metadata Pod元数据 spec Pod规格

containers 容器配置
apiVersion: apps/v1
kind: Deployment
metadata:
name: nginx-deployment
namespace: default
spec:
replicas: 3
selector:
matchLabels:
app: nginx
template:
metadata:
labels:
app: nginx
spec:
containers:
- name: nginx
image: nginx:1.15
ports:
- containerPort: 80
文档参考 ------explain --help
List the fields for supported resources

 This command describes the fields associated with each supported API resource. Fields are identified via a simple
JSONPath identifier:

  <type>.<fieldName>[.<fieldName>]

 Add the --recursive flag to display all of the fields at once without descriptions. Information about each field is
retrieved from the server in OpenAPI format.

Use "kubectl api-resources" for a complete list of supported resources.

Examples:
  # Get the documentation of the resource and its fields
  kubectl explain pods

  # Get the documentation of a specific field of a resource
  kubectl explain pods.spec.containers

Options:
      --api-version='': Get different explanations for particular API version
      --recursive=false: Print the fields of fields (Currently only 1 level deep)

Usage:
  kubectl explain RESOURCE [options]
Pod 文件共享
示例yaml
apiVersion: v1
kind: Pod
metadata:
name: my-pod
spec:
containers:
- name: write
image: centos
command: ["bash","-c","for i in {1..100};do echo $i >> /data/hello;sleep 1;done"]
volumeMounts:
- name: data
mountPath: /data
- name: read
image: centos
command: ["bash","-c","tail -f /data/hello"]
volumeMounts:
- name: data
mountPath: /data
volumes:
- name: data
emptyDir: {}
共享存储就是先创建一个空卷在宿主机上,然后两个容器同时挂载data 数据卷,从而实现数据共享
• Infrastructure Container:基础容器• 维护整个Pod网络空间 指 puse • InitContainers:初始化容器• 先于业务容器开始执行• Containers:业务容器• 并行启动
镜像拉取策略(imagePullPolicy)
• IfNotPresent:默认值,镜像在宿主机上不存在时才拉取
• Always:每次创建 Pod 都会重新拉取一次镜
• Never: Pod 永远不会主动拉取这个镜像
apiVersion: v1
kind: Pod
metadata:
name: foo
namespace: awesomeapps
spec:
containers:
- name: foo
image: janedoe/awesomeapp:v1
imagePullPolicy: IfNotPresent
保存镜像凭据
kubectl create secret docker-registry NAME --docker-username=user --docker-password=password --docker-email=email --docker-server=string
Pod 资源限制☆☆☆☆(必须要做)
limits:实际最大使用的配额
requests:申请的配额,主要用于k8s做资源调度分配时参考值
name: frontend
spec:
containers:
- name: db
image: mysql
env:
- name: MYSQL_ROOT_PASSWORD
value: "password"
resources:
requests://基本的资源使用
memory: "64Mi" /M后面的接i 表示计算的是以1024计算的,不带i就是1000
cpu: "250m" 1c
limits: //最大的资源使用
memory: "128Mi"
cpu: "500m"
资源限制好处:避免影响某个容器资源利用率异常,突发,会去影响其他容器,可能会产生雪崩效应!
重启策略(restartPolicy)
apiVersion: v1
kind: Pod
metadata:
name: foo
namespace: awesomeapps
spec:
containers:
- name: foo
image: janedoe/awesomeapp:v1
restartPolicy: Always
健康检查(Probe)
Probe有以下两种类型:
- livenessProbe(存活检查)
- readinessProbe(就绪检查)
Probe支持以下三种检查方法:
- httpGet
- exec
- tcpSocket
spec:
containers:
- name: liveness
image: busybox
args:
- /bin/sh
- -c
- touch /tmp/healthy; sleep 30; rm -rf /tmp/healthy; sleep 60
livenessProbe:
exec:
command:
- cat
- /tmp/healthy
Pod 的调度策略
常用的:
1、nodeName //指定将pod调度到指定节点上
示例:
apiVersion: v1
kind: Pod
metadata:
name: foo
namespace: awesomeapps
spec:
 nodeName: k8s-node1 //提前定义好这个应用分配到指定那个节点上,不需要 Scheduler 去分配
containers:
- name: foo
image: janedoe/awesomeapp:v1
restartPolicy: Always
2、nodeSelector //需要将每一个node打标签,然后应用会匹配符指定标签的节点上
怎么去给node打标签呢?
我们可以使用 kubectl label nodes 节点名字 key=value (team=dev)
查看:kubectl get node --show-labels
示例:
apiVersion: v1
kind: Pod
metadata:
name: foo
namespace: awesomeapps
spec:
 #nodeName: k8s-node1 //提前定义好这个应用分配到指定那个节点上,不需要 Scheduler 去分配
  nodeSelector
      team:"dev" //该pod会分配到node上有tem=a这个标签的机器
containers
- name: foo
image: janedoe/awesomeapp:v1
restartPolicy: Always
删除标签: kubectl label nodes 节点名字 对应的key加“-“” kubectl label nodes team-
apiVersion: v1
kind: Pod
metadata:
name: foo
namespace: awesomeapps
spec:
 tolerations:
 - key: "test" //污点的key
   operator: "Equal" // 相当于 " = "
   value: "666" //污点的vlane
   effect: "NoSchedule" "节点设置的污点策略"
 containers:
   - name: foo
   image: janedoe/awesomeapp:v1
  restartPolicy: Always
控制器
kubectl get deployment //获取当前部署的deployment应用状态
kubectl get rs // 获取副本状态
kubectl api-resources //获取哪些的缩写资源
查看资源:kubectl describr rs 容器名称
deployment
部署无状态应用
管理pod和Replica set(控制副本的数量)
回滚、更新、发布镜像
RS(replica set)作用:1、控制副本数量 2、管理滚动升级
1、kubectl rollout undo 类型(deployment) 项目名称 回滚到上一个版本
2、快速的缩容和扩容
kubectl scale 类型(deployment) 项目名称 --replicas=10 //快速的设置副本数量。
daemonSet
1、他会在每个容器上运行一个pod
2、新加入的节点也会自动运行这个pod
例如安装agent
Job
分为普通任务(job)和定时任务(cronJob)
job 配置普通任务(执行一次就完毕。)
示例
apiVersion: batch/v1
kind: Job
metadata:
  name: test
spec:
  template:
    metadata:
    spec:
      containers:
      - image: perl
        name: test
        resources: {}
      restartPolicy: Never
创建之后,我们可以使用 kubectl get job 来查看创建的job任务
cronJob(定时任务)
类似linux Crontab
一般用于定时备份、定时短信通知
分 时 日 月 周
* * * * *
示例
apiVersion: batch/v1beta1
kind: CronJob
metadata:
  name: hello
spec:
  jobTemplate:
    metadata:
      name: hello
    spec:
      template:
        metadata:
        spec:
          containers:
          - image: busbox
            name: hello
            args:
            - /bin/bash
            - -c
            - echo "This is cronjob messages!"
            resources: {}
          restartPolicy: OnFailure
  schedule: '*/1 * * * *'
控制器总结:
Deployment :无状态部署
Daemonset : 守护进程部署
job &cronjob :批处理
K8s Service
存在意义:防止pod失联(服务发现)
一组pod访问策略(负载均衡)
通过label 、selector 进行关联
通过service 实现负载均衡
service 只支持四层负载均衡
四层:osi中的传输层、TCP、UDP,源ip、目的ip 、源端口、目录端口(四元组),只负责IP数据包的转发,不会对数据包进行分析
七层:osi中的应用层、HTTP 、FTP、 SNMP ,可以拿到协议头部信息,可实现基于协议层面处理
三种类型:
1、Cluster IP:集群内部使用
2、NodePort 对外暴露应用
3、LoadBalancer
apiVersion: v1
kind: Service
metadata:
 name: metrics-app
labels:
  app: metrics-app
spec:

ports:

 port:

   name: web
   port: 80

  nodePort: 30063    //第一个单词首字母小写,第二个大写
   targetPort: 80
selector:
  app: metrics-app

type: NodePort   //所有单词首字母大写
service 的两种代理模式
1、 ipvs
2、 iptables : 阻断ip访问 、端口映射,数据包更改
默认我们使用的就是iptables
如何应用ipvs呢?
首先我们先检查,节点是否开启了ipvs 这个东西
lsmod | grep ip_vs
如果没有的话
使用 modprobe ip_vs 开启
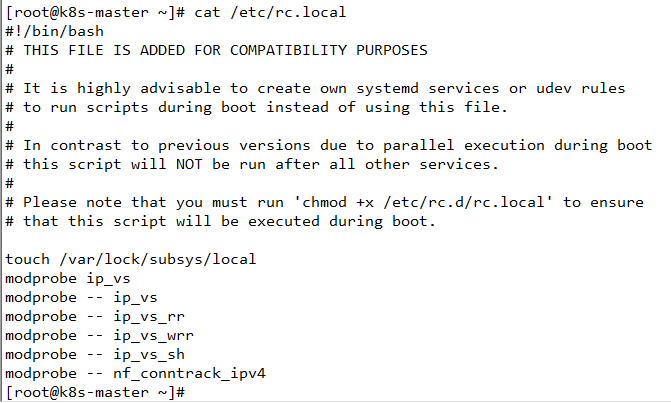
开启相关算法模块
modprobe -- ip_vs
modprobe -- ip_vs_rr //轮询
modprobe -- ip_vs_wrr //加权轮询
modprobe -- ip_vs_sh // 原地址解析
modprobe -- nf_conntrack_ipv4 // 会话保持
配置开机启动。
ipvs里的配置文件都在configmap上。
我们可以先查看configmap
kubectl get cm -n kube-system
查看之后,直接修改
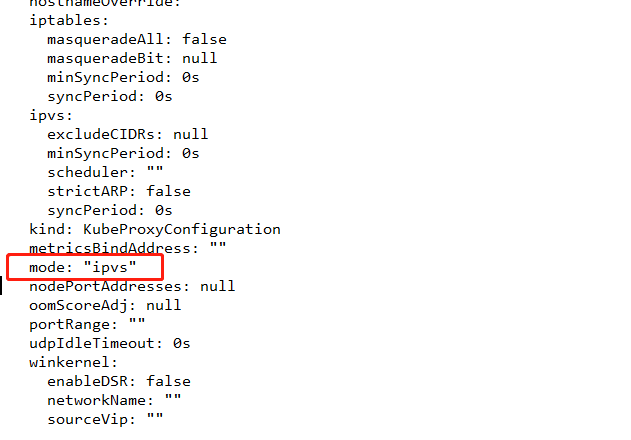
kubectl edit cm kube-proxy -n kube-system
修改mode 字段 默认为空,表示启用iptables ,在这里直接添加ipvs 表示启动
我修改之后,是不会生效的。所以我们需要重构 节点的 proxy
重构直接删除pod 及口
kubectl delete pod kube-proxy -n kube-system
IPVS 和iptable 两者有什么区别呢?
1、iptables:
灵活、功能强大
规则遍历匹配和更新、呈线性时延
2、ipvs
工作实在内核,有更好的性能
丰富的调度算法:rr、wrr、lc、wlc、ip......
集群内部访问,建议使用dns来进程访问
使用方式 你的service名字+你的命名空间
示例:web.kube-system
总结:1、使用NodePort对外暴露应用,前面加上一个LB实现统一的访问入口
2、优先使用ipvs代理模式(使用ipvs后,千万不要删除iptables的规则)
3、集群内应采用DNS 名称访问。
Ingress 服务暴露
nodePort 存在的不足:一个端口只能一个服务访问,端口需要提前规划,支持持4层负载均衡
pod 与 ingress的关系:它是通过service进行关联、通过ingress controller实现pod的负载均衡- 支持tcp/udp 4层和http7层
ingress怎么使用呢?
1、部署ingressControll 控制器
2、创建ingress规则
部署官方的ingress-nginx控制器
kubectl apply -f https://raw.githubusercontent.com/kubernetes/ingress-nginx/nginx-0.30.0/deploy/static/mandatory.yaml
先把这个官网的控制器yaml拉取下来,进行修改
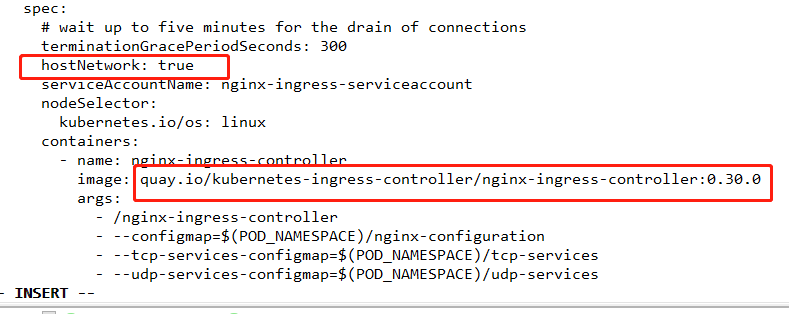
ingress 网络方式有两种:1、pod的网络进行暴露 2、是以宿主机的网络进行暴露
使用宿主机的网络会更好一些,会少一次转发,性能会好一些。
我这边添加一个 hostNetwork: true 表示使用宿主机的网络
安装好ingress控制之后,我们就要配置规则了。
关于角色的配置案例,我们可以在kubernetes.io官网的搜一下就找到了。
apiVersion: networking.k8s.io/v1beta1
kind: Ingress
metadata:
  name: bailicaicai-ingress
spec:
  rules:
  - host: example.bailicaicai.com //访问的绑定域名
    http:
      paths:
      - backend:
          serviceName: web  //service名字,就是即将发布的svc的名字
          servicePort: 80   //服务端口
访问的域名与任意一个节点进行host绑定。
基于htttps的这种访问:
首先将https两个证书放到k8s 主机上,然后k8s创建 secret ,引用两个证书
kubectl create secret tls example-bailicaicai-com --cert=example.bailicaicai.com.pem --key=example.bailicaicai.com-key.pem
部署应用
apiVersion: networking.k8s.io/v1beta1
kind: Ingress
metadata:
  name: tls-example-ingress
spec:
  tls:
  - hosts:
    - example.bailicaicai.com  //填写你的域名
    secretName: example-bailicaicai-com //secret名字
  rules:
    - host: example.bailicaicai.com//你的域名
      http:
        paths:
        - path: /
          backend:
            serviceName: web
            servicePort: 80
annotations对ingress个性化配置
apiVersion: networking.k8s.io/v1beta1
kind: Ingress
metadata:
 name: example-ingress
 annotations:
  kubernetes.io/ingress.class: "nginx“
  nginx.ingress.kubernetes.io/proxy-connect-timeout: "600"
  nginx.ingress.kubernetes.io/proxy-send-timeout: "600"
  nginx.ingress.kubernetes.io/proxy-read-timeout: "600"
  nginx.ingress.kubernetes.io/proxy-body-size: "10m"   //后面的这些参数会自动配置到nginx.cfg配置文件中
spec:
 rules:
 - host: example.ctnrs.com
   http:
    paths:
    - path: /
      backend:
       serviceName: web
       servicePort: 80
ingress 默认配置是会将http 重定向到httpsde ,加上这个参数,就不会重定向了。
PrometheusAdapter 有一个稳定的Helm Charts,我们直接使用。
先准备下helm环境:
wget https://get.helm.sh/helm-v3.0.0-linux-amd64.tar.gz
tar zxvf helm-v3.0.0-linux-amd64.tar.gz
mv linux-amd64/helm /usr/bin/
helm repo add stable http://mirror.azure.cn/kubernetes/charts
helm repo update
helm repo list
部署prometheus-adapter,指定prometheus地址:
# helm install prometheus-adapter stable/prometheus-adapter --namespace kube-system --set prometheus.url=http://prometheus.kube-system,prometheus.port=9090
# helm list -n kube-system

# kubectl get pods -n kube-system
# kubectl get apiservices |grep custom
# kubectl get --raw "/apis/custom.metrics.k8s.io/v1beta1" 这里的custom 地址是apiser注册的地址
基础qps指标部署一个应用
apiVersion: apps/v1
kind: Deployment
metadata:
labels:
app: metrics-app
name: metrics-app
spec:
replicas: 3
selector:
matchLabels:
app: metrics-app
template:
metadata:
labels:
app: metrics-app
annotations:
prometheus.io/scrape: "true" //告诉采集器本应需要你来采集信息
prometheus.io/port: "80" // 采集访问端口
prometheus.io/path: "/metrics" //采集访问路径
spec:
containers:
- image: k8s.ro/metrics-app
name: metrics-app
ports:
- name: web
containerPort: 80
resources:
requests:
cpu: 200m
memory: 256Mi
readinessProbe:
httpGet:
path: /
port: 80
initialDelaySeconds: 3
periodSeconds: 5
livenessProbe:
httpGet:
path: /
port: 80
initialDelaySeconds: 3
periodSeconds: 5
---
apiVersion: v1
kind: Service
metadata:
name: metrics-app
labels:
app: metrics-app
spec:
ports:
port:
name: web
port: 80
targetPort: 80
selector:
app: metrics-app
metrics-app暴露了一个Prometheus指标接口,可以通过访问service看到:
curl 10.1.181.193/metrics 服务地址
创建HPA策略:
# vi app-hpa-v2.yml
apiVersion: autoscaling/v2beta2
kind: HorizontalPodAutoscaler
metadata:
  name: metrics-app-hpa
  namespace: default
spec:
  scaleTargetRef:
    apiVersion: apps/v1
    kind: Deployment
    name: metrics-app
  minReplicas: 1
  maxReplicas: 10
  metrics:
  - type: Pods
    pods:
      metric:
        name: http_requests_per_second
      target:
        type: AverageValue
        averageValue: 800m   # 800m 即0.8个/秒
# kubectl edit cm prometheus-adapter -n kube-system
apiVersion: v1
kind: ConfigMap
metadata:
  labels:
    app: prometheus-adapter
    chart: prometheus-adapter-v0.1.2
    heritage: Tiller
    release: prometheus-adapter
  name: prometheus-adapter
data:
  config.yaml: |
    rules:
    - seriesQuery: 'http_requests_total{kubernetes_namespace!="",kubernetes_pod_name!=""}'
      resources:
        overrides:
          kubernetes_namespace: {resource: "namespace"}
          kubernetes_pod_name: {resource: "pod"}
      name:
        matches: "^(.*)_total"
        as: "${1}_per_second"
      metricsQuery: 'sum(rate(<<.Series>>{<<.LabelMatchers>>}[2m])) by (<<.GroupBy>>)'
...
测试API:
kubectl get --raw "/apis/custom.metrics.k8s.io/v1beta1/namespaces/default/pods/*/http_requests_per_second"
查看HPA状态:
kubectl get hpa
kubectl describe hpa metrics-app-hpa


 浙公网安备 33010602011771号