Matplotlib踩过的坑
笔记:
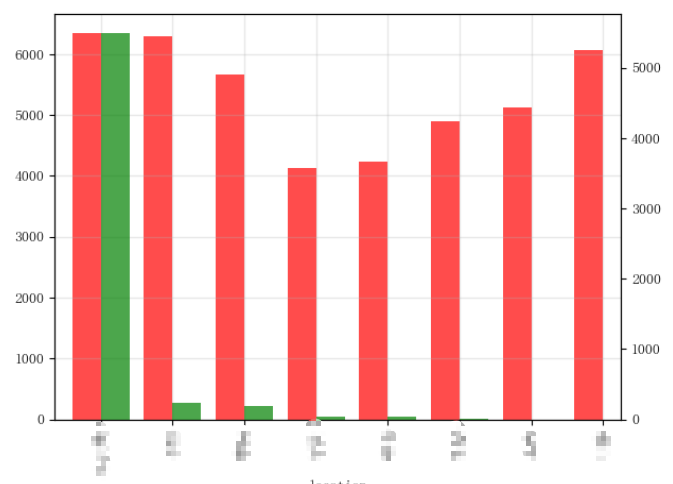
例一:为了方便数据更加明显,想在柱状图上添加数值信息,起初的代码
df['num'] = 1
grouped = df.groupby("location")            #以地区进行分组
com_avg = grouped.agg({"num":"count", "price":"mean"}).sort_values("num", ascending=False)    #统计数量和单价
fig = plt.figure()
ax = fig.add_subplot(1, 1, 1)
width=0.4
x = np.arange(20)
num = com_avg.num
avg_pri = com_avg.price

num.plot.bar(position=0, secondary_y=True, color="g", width=0.4, ax=ax, alpha=0.7)    #position:表示绘图区域位置    secondary_y=True 可以绘制双y轴
avg_pri.plot.bar(position=1, color="r", width=0.4, ax=ax, alpha=0.7)

ax.grid(linestyle='-', linewidth=1,alpha=0.3)
plt.show()
对代码进行加数值:
#添加数值函数
def autolabel(rects):
    for rect in rects:
        height = rect.get_height()
        plt.text(rect.get_x()+rect.get_width()/2.-0.2, 1.03*height, '%s' % float(height))

df['num'] = 1
grouped = df.groupby("location")            #以地区进行分组
top20_com_avg = grouped.agg({"num":"count", "price":"mean"}).sort_values("num", ascending=False)    #统计数量和单价
fig = plt.figure()
ax = fig.add_subplot(1, 1, 1)
width=0.4
x = np.arange(20)
num = top20_com_avg.num
avg_pri = top20_com_avg.price

a = num.plot.bar(position=0, secondary_y=True, color="g", width=0.4, ax=ax, alpha=0.7)     #position:坐标轴
b = avg_pri.plot.bar(position=1, color="r", width=0.4, ax=ax, alpha=0.7)
autolabel(a)
ax.grid(linestyle='-', linewidth=1,alpha=0.3)
plt.show()
发现报了个类型的错误错:
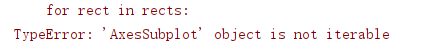
后面经过长时间的了解 ,发现是画图上的错误
  a = num.plot.bar(position=0, secondary_y=True, color="g", width=0.4, ax=ax, alpha=0.7)     #position:坐标轴
  print(type(a))
<class 'matplotlib.axes._subplots.AxesSubplot'>
正确的是:
  a = plt.bar(n,avg_pri.values,width=width,tick_label=n,fc='r')
  print(type(a))
<class 'matplotlib.container.BarContainer'>
可能是我们声明画图时使用不同的方法
正确代码:
df['num'] = 1
grouped = df.groupby("location")

com_avg = grouped.agg({"num":"count", "price":"mean"}).sort_values("num", ascending=False)

def autolabel(rects):
    for rect in rects:
        height = rect.get_height()
        plt.text(rect.get_x()+rect.get_width()/2.-0.2, 1.03*height, '%s' % int(height))

width=0.4
x = np.arange(20)
num = com_avg.num
n = np.arange(len(num)).tolist()
avg_pri = com_avg.price


a = plt.bar(n,avg_pri.values,width=width,tick_label=n,fc='r')for i in range(len(n)):
    n[i] = n[i] + width
b = plt.bar(n,num.values,width=width,fc='g')

autolabel(a)
autolabel(b)
plt.show()


 浙公网安备 33010602011771号