
今天看完soft-margin SVM就又搜了下相关的代码,最后搜到这个,第一次看懂了SVM的实现。
关于代码中cvxopt的使用,可以看下这个简单的介绍。
这里还是将代码贴在这里,里面加了自己的一下注释。
  1 # -*- coding: utf-8 -*-
  2 """
  3 Created on Tue Nov 22 11:24:22 2016
  4
  5 @author: Administrator
  6 """
  7
  8 # Mathieu Blondel, September 2010
  9 # License: BSD 3 clause
 10
 11 import numpy as np
 12 from numpy import linalg
 13 import cvxopt
 14 import cvxopt.solvers
 15
 16 def linear_kernel(x1, x2):
 17     return np.dot(x1, x2)
 18
 19 def polynomial_kernel(x, y, p=3):
 20     return (1 + np.dot(x, y)) ** p
 21
 22 def gaussian_kernel(x, y, sigma=5.0):
 23     return np.exp(-linalg.norm(x-y)**2 / (2 * (sigma ** 2)))
 24
 25 class SVM(object):
 26
 27     def __init__(self, kernel=linear_kernel, C=None):
 28         self.kernel = kernel
 29         self.C = C
 30         if self.C is not None: self.C = float(self.C)
 31
 32     def fit(self, X, y):
 33         n_samples, n_features = X.shape
 34
 35         # Gram matrix
 36         K = np.zeros((n_samples, n_samples))
 37         for i in range(n_samples):
 38             for j in range(n_samples):
 39                 K[i,j] = self.kernel(X[i], X[j])
 40
 41         P = cvxopt.matrix(np.outer(y,y) * K)
 42         q = cvxopt.matrix(np.ones(n_samples) * -1)
 43         A = cvxopt.matrix(y, (1,n_samples))
 44         b = cvxopt.matrix(0.0)
 45
 46         if self.C is None:
 47             G = cvxopt.matrix(np.diag(np.ones(n_samples) * -1))
 48             h = cvxopt.matrix(np.zeros(n_samples))
 49         else:
 50             tmp1 = np.diag(np.ones(n_samples) * -1)
 51             tmp2 = np.identity(n_samples)
 52             G = cvxopt.matrix(np.vstack((tmp1, tmp2)))
 53             tmp1 = np.zeros(n_samples)
 54             tmp2 = np.ones(n_samples) * self.C
 55             h = cvxopt.matrix(np.hstack((tmp1, tmp2)))
 56
 57         # solve QP problem
 58         solution = cvxopt.solvers.qp(P, q, G, h, A, b)
 59         # Lagrange multipliers
 60         '''
 61          数组的flatten和ravel方法将数组变为一个一维向量(铺平数组)。
 62          flatten方法总是返回一个拷贝后的副本,
 63          而ravel方法只有当有必要时才返回一个拷贝后的副本(所以该方法要快得多,尤其是在大数组上进行操作时)
 64        '''
 65         a = np.ravel(solution['x'])
 66         # Support vectors have non zero lagrange multipliers
 67         '''
 68         这里a>1e-5就将其视为非零
 69         '''
 70         sv = a > 1e-5     # return a list with bool values
 71         ind = np.arange(len(a))[sv]  # sv's index
 72         self.a = a[sv]
 73         self.sv = X[sv]  # sv's data
 74         self.sv_y = y[sv]  # sv's labels
 75         print("%d support vectors out of %d points" % (len(self.a), n_samples))
 76
 77         # Intercept
 78         '''
 79         这里相当于对所有的支持向量求得的b取平均值
 80         '''
 81         self.b = 0
 82         for n in range(len(self.a)):
 83             self.b += self.sv_y[n]
 84             self.b -= np.sum(self.a * self.sv_y * K[ind[n],sv])
 85         self.b /= len(self.a)
 86
 87         # Weight vector
 88         if self.kernel == linear_kernel:
 89             self.w = np.zeros(n_features)
 90             for n in range(len(self.a)):
 91                 # linear_kernel相当于在原空间,故计算w不用映射到feature space
 92                 self.w += self.a[n] * self.sv_y[n] * self.sv[n]
 93         else:
 94             self.w = None
 95
 96     def project(self, X):
 97         # w有值,即kernel function 是 linear_kernel,直接计算即可
 98         if self.w is not None:
 99             return np.dot(X, self.w) + self.b
100         # w is None --> 不是linear_kernel,w要重新计算
101         # 这里没有去计算新的w(非线性情况不用计算w),直接用kernel matrix计算预测结果
102         else:
103             y_predict = np.zeros(len(X))
104             for i in range(len(X)):
105                 s = 0
106                 for a, sv_y, sv in zip(self.a, self.sv_y, self.sv):
107                     s += a * sv_y * self.kernel(X[i], sv)
108                 y_predict[i] = s
109             return y_predict + self.b
110
111     def predict(self, X):
112         return np.sign(self.project(X))
113
114 if __name__ == "__main__":
115     import pylab as pl
116
117     def gen_lin_separable_data():
118         # generate training data in the 2-d case
119         mean1 = np.array([0, 2])
120         mean2 = np.array([2, 0])
121         cov = np.array([[0.8, 0.6], [0.6, 0.8]])
122         X1 = np.random.multivariate_normal(mean1, cov, 100)
123         y1 = np.ones(len(X1))
124         X2 = np.random.multivariate_normal(mean2, cov, 100)
125         y2 = np.ones(len(X2)) * -1
126         return X1, y1, X2, y2
127
128     def gen_non_lin_separable_data():
129         mean1 = [-1, 2]
130         mean2 = [1, -1]
131         mean3 = [4, -4]
132         mean4 = [-4, 4]
133         cov = [[1.0,0.8], [0.8, 1.0]]
134         X1 = np.random.multivariate_normal(mean1, cov, 50)
135         X1 = np.vstack((X1, np.random.multivariate_normal(mean3, cov, 50)))
136         y1 = np.ones(len(X1))
137         X2 = np.random.multivariate_normal(mean2, cov, 50)
138         X2 = np.vstack((X2, np.random.multivariate_normal(mean4, cov, 50)))
139         y2 = np.ones(len(X2)) * -1
140         return X1, y1, X2, y2
141
142     def gen_lin_separable_overlap_data():
143         # generate training data in the 2-d case
144         mean1 = np.array([0, 2])
145         mean2 = np.array([2, 0])
146         cov = np.array([[1.5, 1.0], [1.0, 1.5]])
147         X1 = np.random.multivariate_normal(mean1, cov, 100)
148         y1 = np.ones(len(X1))
149         X2 = np.random.multivariate_normal(mean2, cov, 100)
150         y2 = np.ones(len(X2)) * -1
151         return X1, y1, X2, y2
152
153     def split_train(X1, y1, X2, y2):
154         X1_train = X1[:90]
155         y1_train = y1[:90]
156         X2_train = X2[:90]
157         y2_train = y2[:90]
158         X_train = np.vstack((X1_train, X2_train))
159         y_train = np.hstack((y1_train, y2_train))
160         return X_train, y_train
161
162     def split_test(X1, y1, X2, y2):
163         X1_test = X1[90:]
164         y1_test = y1[90:]
165         X2_test = X2[90:]
166         y2_test = y2[90:]
167         X_test = np.vstack((X1_test, X2_test))
168         y_test = np.hstack((y1_test, y2_test))
169         return X_test, y_test
170
171     # 仅仅在Linears使用此函数作图,即w存在时
172     def plot_margin(X1_train, X2_train, clf):
173         def f(x, w, b, c=0):
174             # given x, return y such that [x,y] in on the line
175             # w.x + b = c
176             return (-w[0] * x - b + c) / w[1]
177
178         pl.plot(X1_train[:,0], X1_train[:,1], "ro")
179         pl.plot(X2_train[:,0], X2_train[:,1], "bo")
180         pl.scatter(clf.sv[:,0], clf.sv[:,1], s=100, c="g")
181
182         # w.x + b = 0
183         a0 = -4; a1 = f(a0, clf.w, clf.b)
184         b0 = 4; b1 = f(b0, clf.w, clf.b)
185         pl.plot([a0,b0], [a1,b1], "k")
186
187         # w.x + b = 1
188         a0 = -4; a1 = f(a0, clf.w, clf.b, 1)
189         b0 = 4; b1 = f(b0, clf.w, clf.b, 1)
190         pl.plot([a0,b0], [a1,b1], "k--")
191
192         # w.x + b = -1
193         a0 = -4; a1 = f(a0, clf.w, clf.b, -1)
194         b0 = 4; b1 = f(b0, clf.w, clf.b, -1)
195         pl.plot([a0,b0], [a1,b1], "k--")
196
197         pl.axis("tight")
198         pl.show()
199
200     def plot_contour(X1_train, X2_train, clf):
201         # 作training sample数据点的图
202         pl.plot(X1_train[:,0], X1_train[:,1], "ro")
203         pl.plot(X2_train[:,0], X2_train[:,1], "bo")
204         # 做support vectors 的图
205         pl.scatter(clf.sv[:,0], clf.sv[:,1], s=100, c="g")
206         X1, X2 = np.meshgrid(np.linspace(-6,6,50), np.linspace(-6,6,50))
207         X = np.array([[x1, x2] for x1, x2 in zip(np.ravel(X1), np.ravel(X2))])
208         Z = clf.project(X).reshape(X1.shape)
209         # pl.contour做等值线图
210         pl.contour(X1, X2, Z, [0.0], colors='k', linewidths=1, origin='lower')
211         pl.contour(X1, X2, Z + 1, [0.0], colors='grey', linewidths=1, origin='lower')
212         pl.contour(X1, X2, Z - 1, [0.0], colors='grey', linewidths=1, origin='lower')
213
214         pl.axis("tight")
215         pl.show()
216
217     def test_linear():
218         X1, y1, X2, y2 = gen_lin_separable_data()
219         X_train, y_train = split_train(X1, y1, X2, y2)
220         X_test, y_test = split_test(X1, y1, X2, y2)
221
222         clf = SVM()
223         clf.fit(X_train, y_train)
224
225         y_predict = clf.predict(X_test)
226         correct = np.sum(y_predict == y_test)
227         print("%d out of %d predictions correct" % (correct, len(y_predict)))
228
229         plot_margin(X_train[y_train==1], X_train[y_train==-1], clf)
230
231     def test_non_linear():
232         X1, y1, X2, y2 = gen_non_lin_separable_data()
233         X_train, y_train = split_train(X1, y1, X2, y2)
234         X_test, y_test = split_test(X1, y1, X2, y2)
235
236         clf = SVM(gaussian_kernel)
237         clf.fit(X_train, y_train)
238
239         y_predict = clf.predict(X_test)
240         correct = np.sum(y_predict == y_test)
241         print("%d out of %d predictions correct" % (correct, len(y_predict)))
242
243         plot_contour(X_train[y_train==1], X_train[y_train==-1], clf)
244
245     def test_soft():
246         X1, y1, X2, y2 = gen_lin_separable_overlap_data()
247         X_train, y_train = split_train(X1, y1, X2, y2)
248         X_test, y_test = split_test(X1, y1, X2, y2)
249
250         clf = SVM(C=0.1)
251         clf.fit(X_train, y_train)
252
253         y_predict = clf.predict(X_test)
254         correct = np.sum(y_predict == y_test)
255         print("%d out of %d predictions correct" % (correct, len(y_predict)))
256
257         plot_contour(X_train[y_train==1], X_train[y_train==-1], clf)
258
259     # test_soft()
260     # test_linear()
261     test_non_linear()
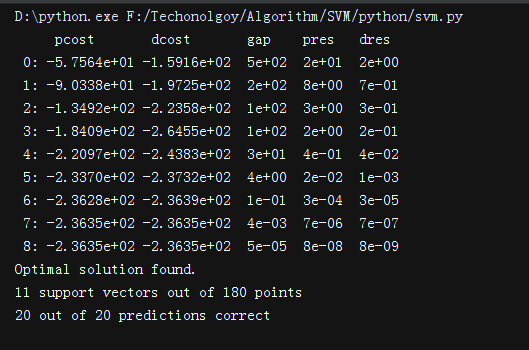
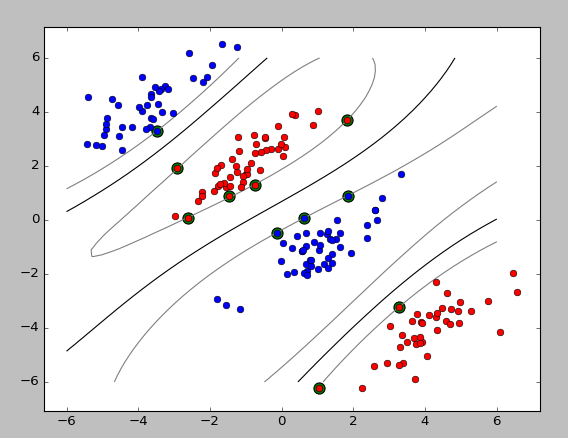
运行结果:

 浙公网安备 33010602011771号