系统调优-1(性能分析)
调优简介
调优的目的:
- 找出系统性能瓶颈(包括硬件瓶颈和软件瓶颈)
- 提供性能优化的方案(升级硬件?改进系统系统结构?)
- 达到合理的硬件和软件配置
- 使系统资源使用达到最大的平衡。
影响性能的因素:
- CPU(cpu的速度与性能很大一部分决定了系统整体的性能,是否使用SMP)
- 内存(物理内存不够时会使用交换内存,使用swap会带来磁盘I0和cpu的开销)
- 硬盘(存储系统)
- 网络带宽
调优的步骤:
- 对资源的使用状况进行长期的监控和数据采集(zabbix nagios or 系统命令收集)
- 如果没有使用图形化的工具,而使用系统命令收集的话,需要通过 awk 格式化数据
- 格式化数据后,通过绘图工具 gnuplot 或 RRDtool 画出图形.
- 依据图形分析系统瓶颈,找出瓶颈所在
性能分析工具
mpstat
查看 cpu 性能 ,由 sysstat 软件包提供。
lscpu or cat /proc/cpuinfo # 查看cpu信息
[root@wpic ~]# mpstat  1 4   # 一秒一次,共收集 4 次
Linux 3.10.0-693.2.2.el7.x86_64 (wpic) 	05/15/2018 	_x86_64_	(1 CPU)

11:02:49 AM  CPU    %usr   %nice    %sys %iowait    %irq   %soft  %steal  %guest  %gnice   %idle
11:02:50 AM  all    0.00    0.00    0.00    0.00    0.00    0.00    0.00    0.00    0.00  100.00
11:02:51 AM  all    0.98    0.00    0.98    0.00    0.00    0.00    0.00    0.00    0.00   98.04
11:02:52 AM  all    0.00    0.00    0.00    0.00    0.00    0.00    0.00    0.00    0.00  100.00
11:02:53 AM  all    3.03    0.00    0.00    0.00    0.00    0.00    0.00    0.00    0.00   96.97
Average:     all    1.00    0.00    0.25    0.00    0.00    0.00    0.00    0.00    0.00   98.75
vmstat
内存性能收集工具,由 procps-ng 软件包提供
cat /proc/meminfo # 查看内存信息
vmstat 1 3 -a # 显示内存活跃数据与非活跃数据
[root@wpic ~]# vmstat 1 3 # 一秒一次,收集三次
procs -----------memory---------- ---swap-- -----io---- -system-- ------cpu-----
 r  b   swpd   free   buff  cache   si   so    bi    bo   in   cs us sy id wa st
 3  0      0 1408576 226788 1697540    0    0     2    27   89   80  1  0 99  0  0
 0  0      0 1408560 226788 1697540    0    0     0     0  219  344  0  0 100  0  0
 0  0      0 1408560 226788 1697540    0    0     0     0  206  319  0  0 100  0  0
iostat
磁盘性能收集工具,由 sysstat 软件包提供。
[root@wpic ~]# iostat 1 3
Linux 3.10.0-693.2.2.el7.x86_64 (wpic) 	05/15/2018 	_x86_64_	(1 CPU)

avg-cpu:  %user   %nice %system %iowait  %steal   %idle
           0.80    0.00    0.19    0.05    0.00   98.96

Device:            tps    kB_read/s    kB_wrtn/s    kB_read    kB_wrtn
vda               1.28         2.48        26.92     835985    9062792

avg-cpu:  %user   %nice %system %iowait  %steal   %idle
           0.00    0.00    0.00    0.00    0.00  100.00

Device:            tps    kB_read/s    kB_wrtn/s    kB_read    kB_wrtn
vda               0.00         0.00         0.00          0          0

avg-cpu:  %user   %nice %system %iowait  %steal   %idle
           0.00    0.00    0.00    0.00    0.00  100.00

Device:            tps    kB_read/s    kB_wrtn/s    kB_read    kB_wrtn
vda               0.00         0.00         0.00          0          0
netstat
网络性能查看与分析工具,由 net-tools 软件包提供。
[root@wpic ~]# netstat -rn
Kernel IP routing table
Destination     Gateway         Genmask         Flags   MSS Window  irtt Iface
0.0.0.0         39.107.155.247  0.0.0.0         UG        0 0          0 eth1
10.0.0.0        10.66.179.247   255.0.0.0       UG        0 0          0 eth0
10.66.176.0     0.0.0.0         255.255.252.0   U         0 0          0 eth0
39.107.152.0    0.0.0.0         255.255.252.0   U         0 0          0 eth1
100.64.0.0      10.66.179.247   255.192.0.0     UG        0 0          0 eth0
169.254.0.0     0.0.0.0         255.255.0.0     U         0 0          0 eth0
169.254.0.0     0.0.0.0         255.255.0.0     U         0 0          0 eth1
172.16.0.0      10.66.179.247   255.240.0.0     UG        0 0          0 eth0
sar
全能的性能查看与分析工具,由 sysstat 软件包提供。
sar 命令结合系统cron定期收集数据并保存到磁盘
rpm -ql sysstat | grep cron # 查看任务计划配置
/etc/cron.d/sysstat # 任务计划配置文件
/etc/sysconfig/sysstat # 收集的数据保存到磁盘的配置文件
/var/log/sa # 收集的数据保存的目录
sar -u  1 10 # 查看 cpu ,默认就是 cpu
sar -r 1 10 # 查看 内存
sar -d 1 10 # 查看 磁盘
sar -n DEV 1 10 # 查看 网络
sar -q 1 10 # 查看平均负载,相当于 uptime
AWK 格式化数据与绘图
AWK 命令介绍,猛击这里,非常重要的文本处理工具
由于许多监控工具都能以图形的形式完美展现,所以我们只需要了解绘图工作流程,万一业务有特殊需求,我们可以做到心中有数。
绘图工具由 gunplot 和 RRDtool,这里仅仅介绍 gunplot
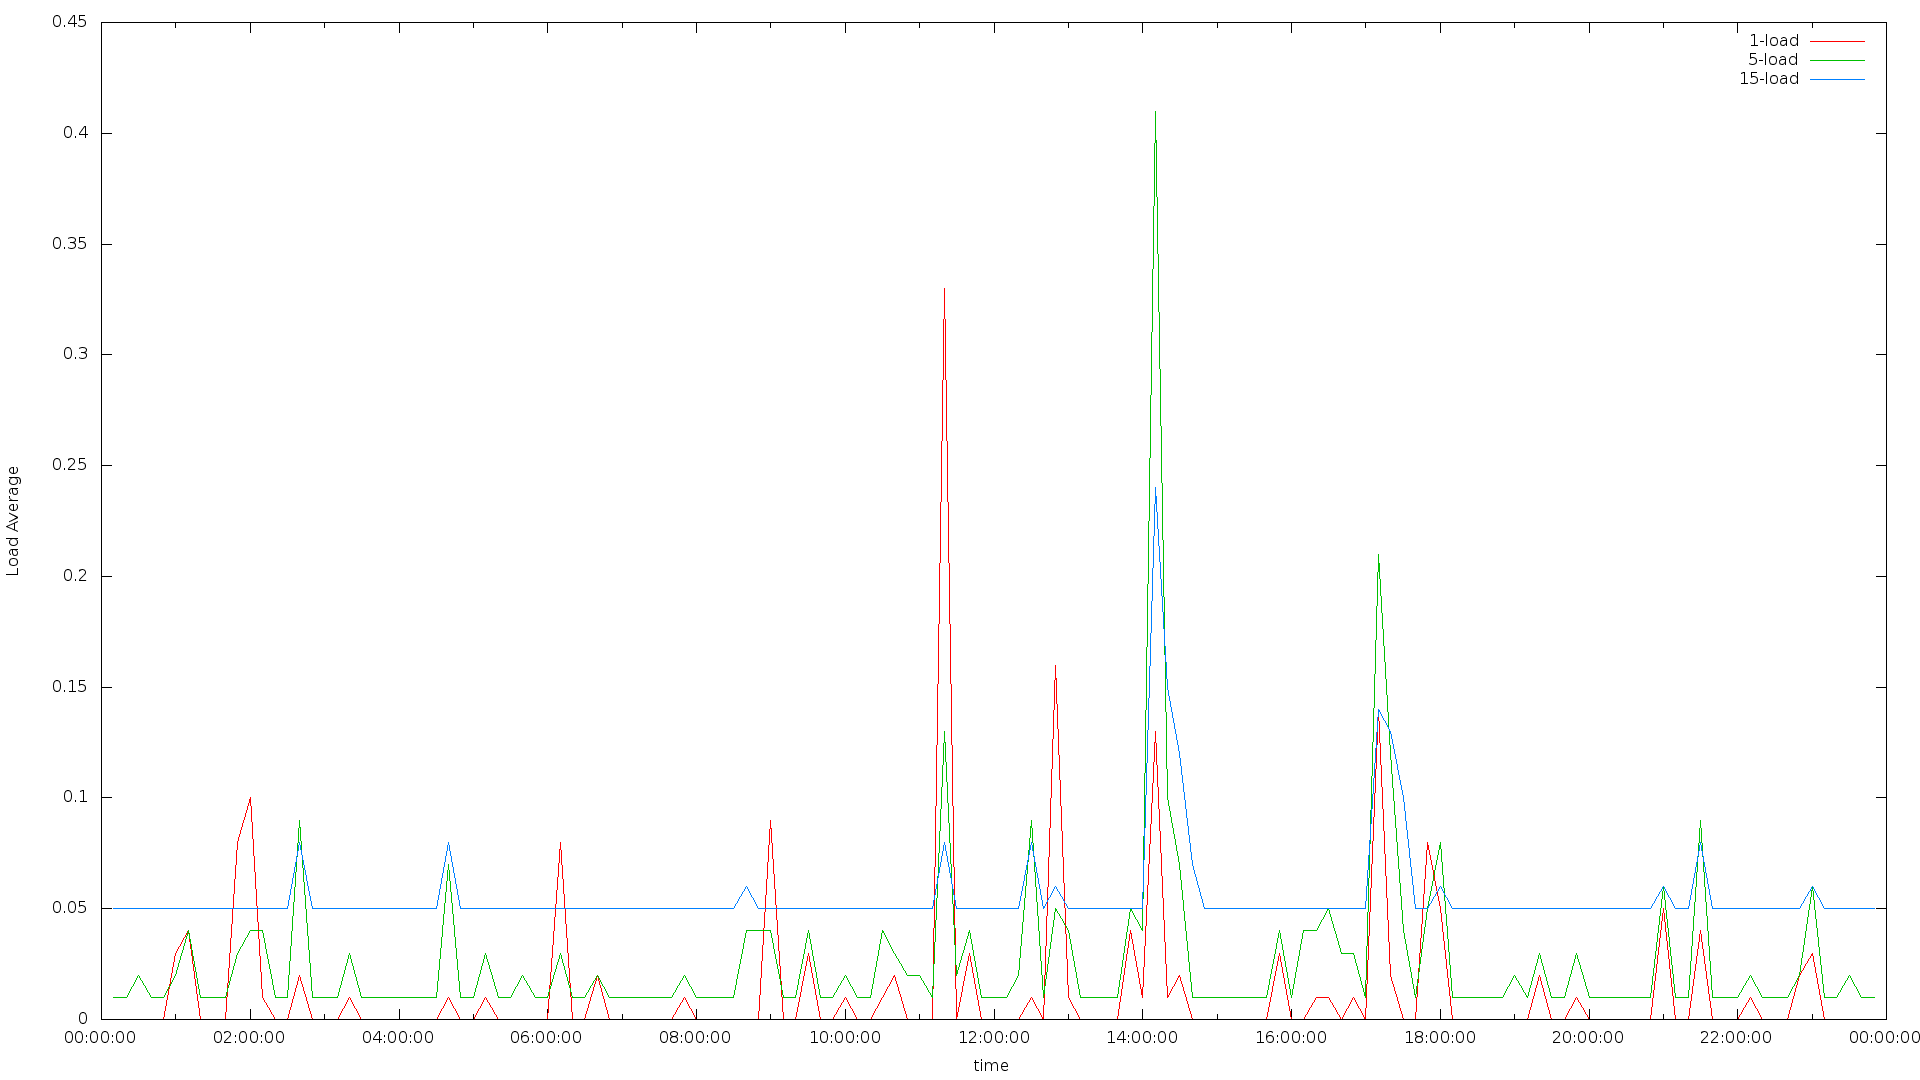
CPU 运行负载绘图示例
格式化数据
sar -q -f /var/log/sa/sa14  # 获取 14 号当天的历史数据
LANG=C sar -q -f /var/log/sa/sa14 # 以 24 小时制的形式展现
LANG=C sar -q -f /var/log/sa/sa14 | awk '/^[^a-zA-Z]+$/{print $0}' # 格式化我们想要的数据
LANG=C sar -q -f /var/log/sa/sa14 | awk '/^[^a-zA-Z]+$/{print $1,$(NF-3),$(NF-2),$(NF-1)}' > /cpu.txt  # 取出我们所需要的绘图数据
gunplot 依据数据文件绘制图形
#安装 gnuplot
yum install gnuplot
#编写 gunplot 绘图配置文件
vim gnuplot.conf
set xdata time # 设置 x 轴数据格式为时间格式
set timefmt "%H:%M:%S" # 说明数据文件的时间格式是什么
set format x "%H:%M:%S" # 设置 x 轴的时间格式
set xlabel "time" # 设置 x 轴的名称
set ylabel "Load Average" # 设置 y 轴的名称
set terminal png size 1920,1080# 设置生成图片的格式和分辨率
set output "/cpuload.png" # 存储文件
# 指定数据文件,使用的字段,标题,并以线的形式绘制。
plot "/cpu.txt" using 1:2 title "1-load" with lines,"/cpu.txt" using 1:3 title "5-load" with lines,"/cpu.txt" using 1:4 title "15-load" with lines
# 生成图片文件并保存,默认保存到当前目录
gnuplot gnuplot.conf
图形展示图

 浙公网安备 33010602011771号