python画图例子代码
- matplotlib包,使得python可以使用类似matlab的命令
- 双坐标,子图例子
fig, axes = plt.subplots( 2,1, figsize=(14, 14) )
ax = badrate.plot.bar('t_len', 'total', ax=axes[0])
ax2 = ax.twinx()
ax2.plot(ax.get_xticks(), badrate['badrate'], 'rs-')


ax_ = badrate1.plot.bar('t_len', 'total', ax=axes[1])
ax2_ = ax_.twinx()
ax2_.plot(ax_.get_xticks(), badrate1['badrate'], 'rs-')
- pandas.DataFrame画图
from pylab import plt
plt.rcParams["figure.dpi"] = 120
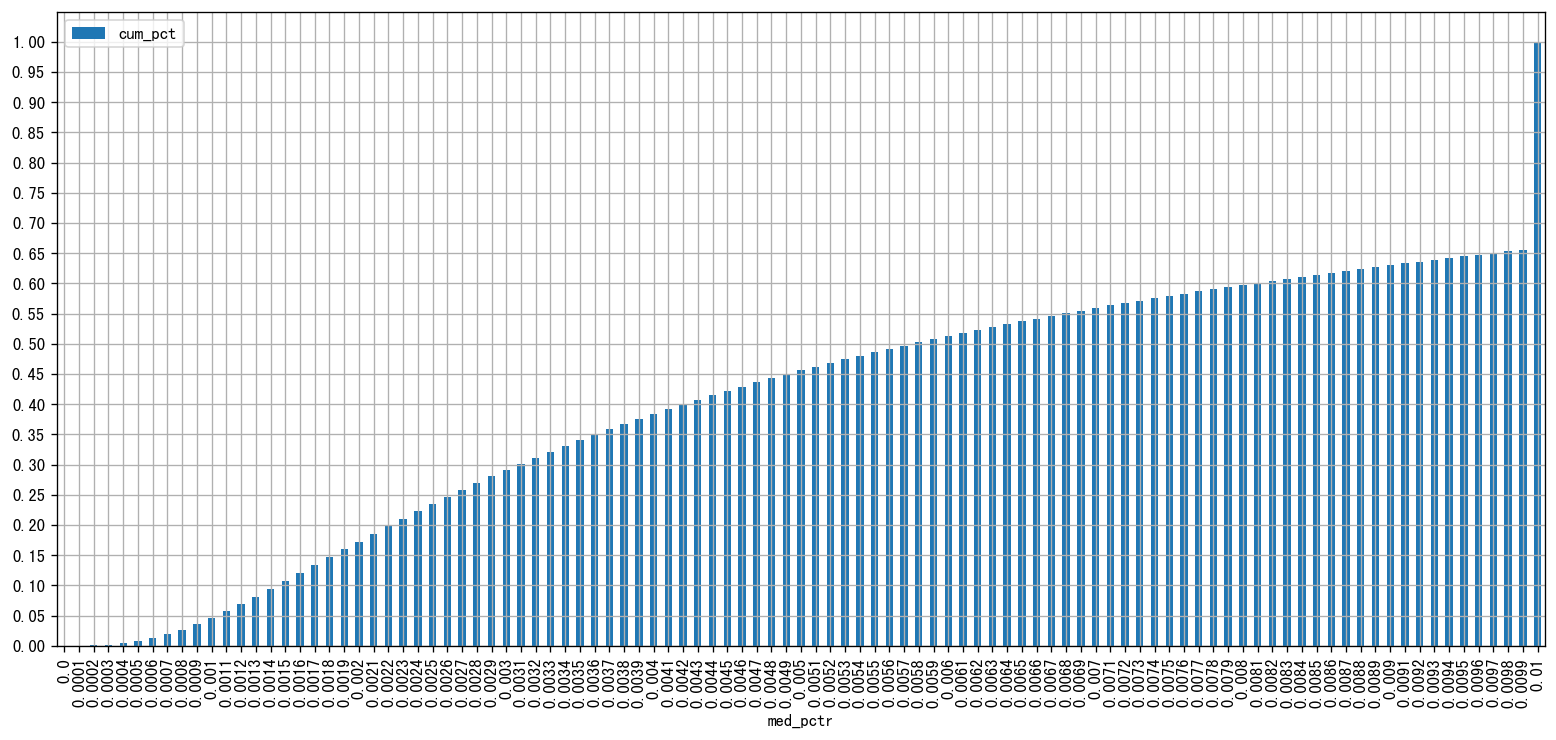
def AA(key='med'):
D_max = D_max.sort_values(f'{key}_pctr')
D_max['cum_pct'] = D_max.cnt.cumsum() / D_max.cnt.sum()
D_max.plot.bar(x=f'{key}_pctr', y='cum_pct', figsize=(16, 7), grid=True, yticks=[ i / 20 for i in range(21)])
- 类似matlab 画图
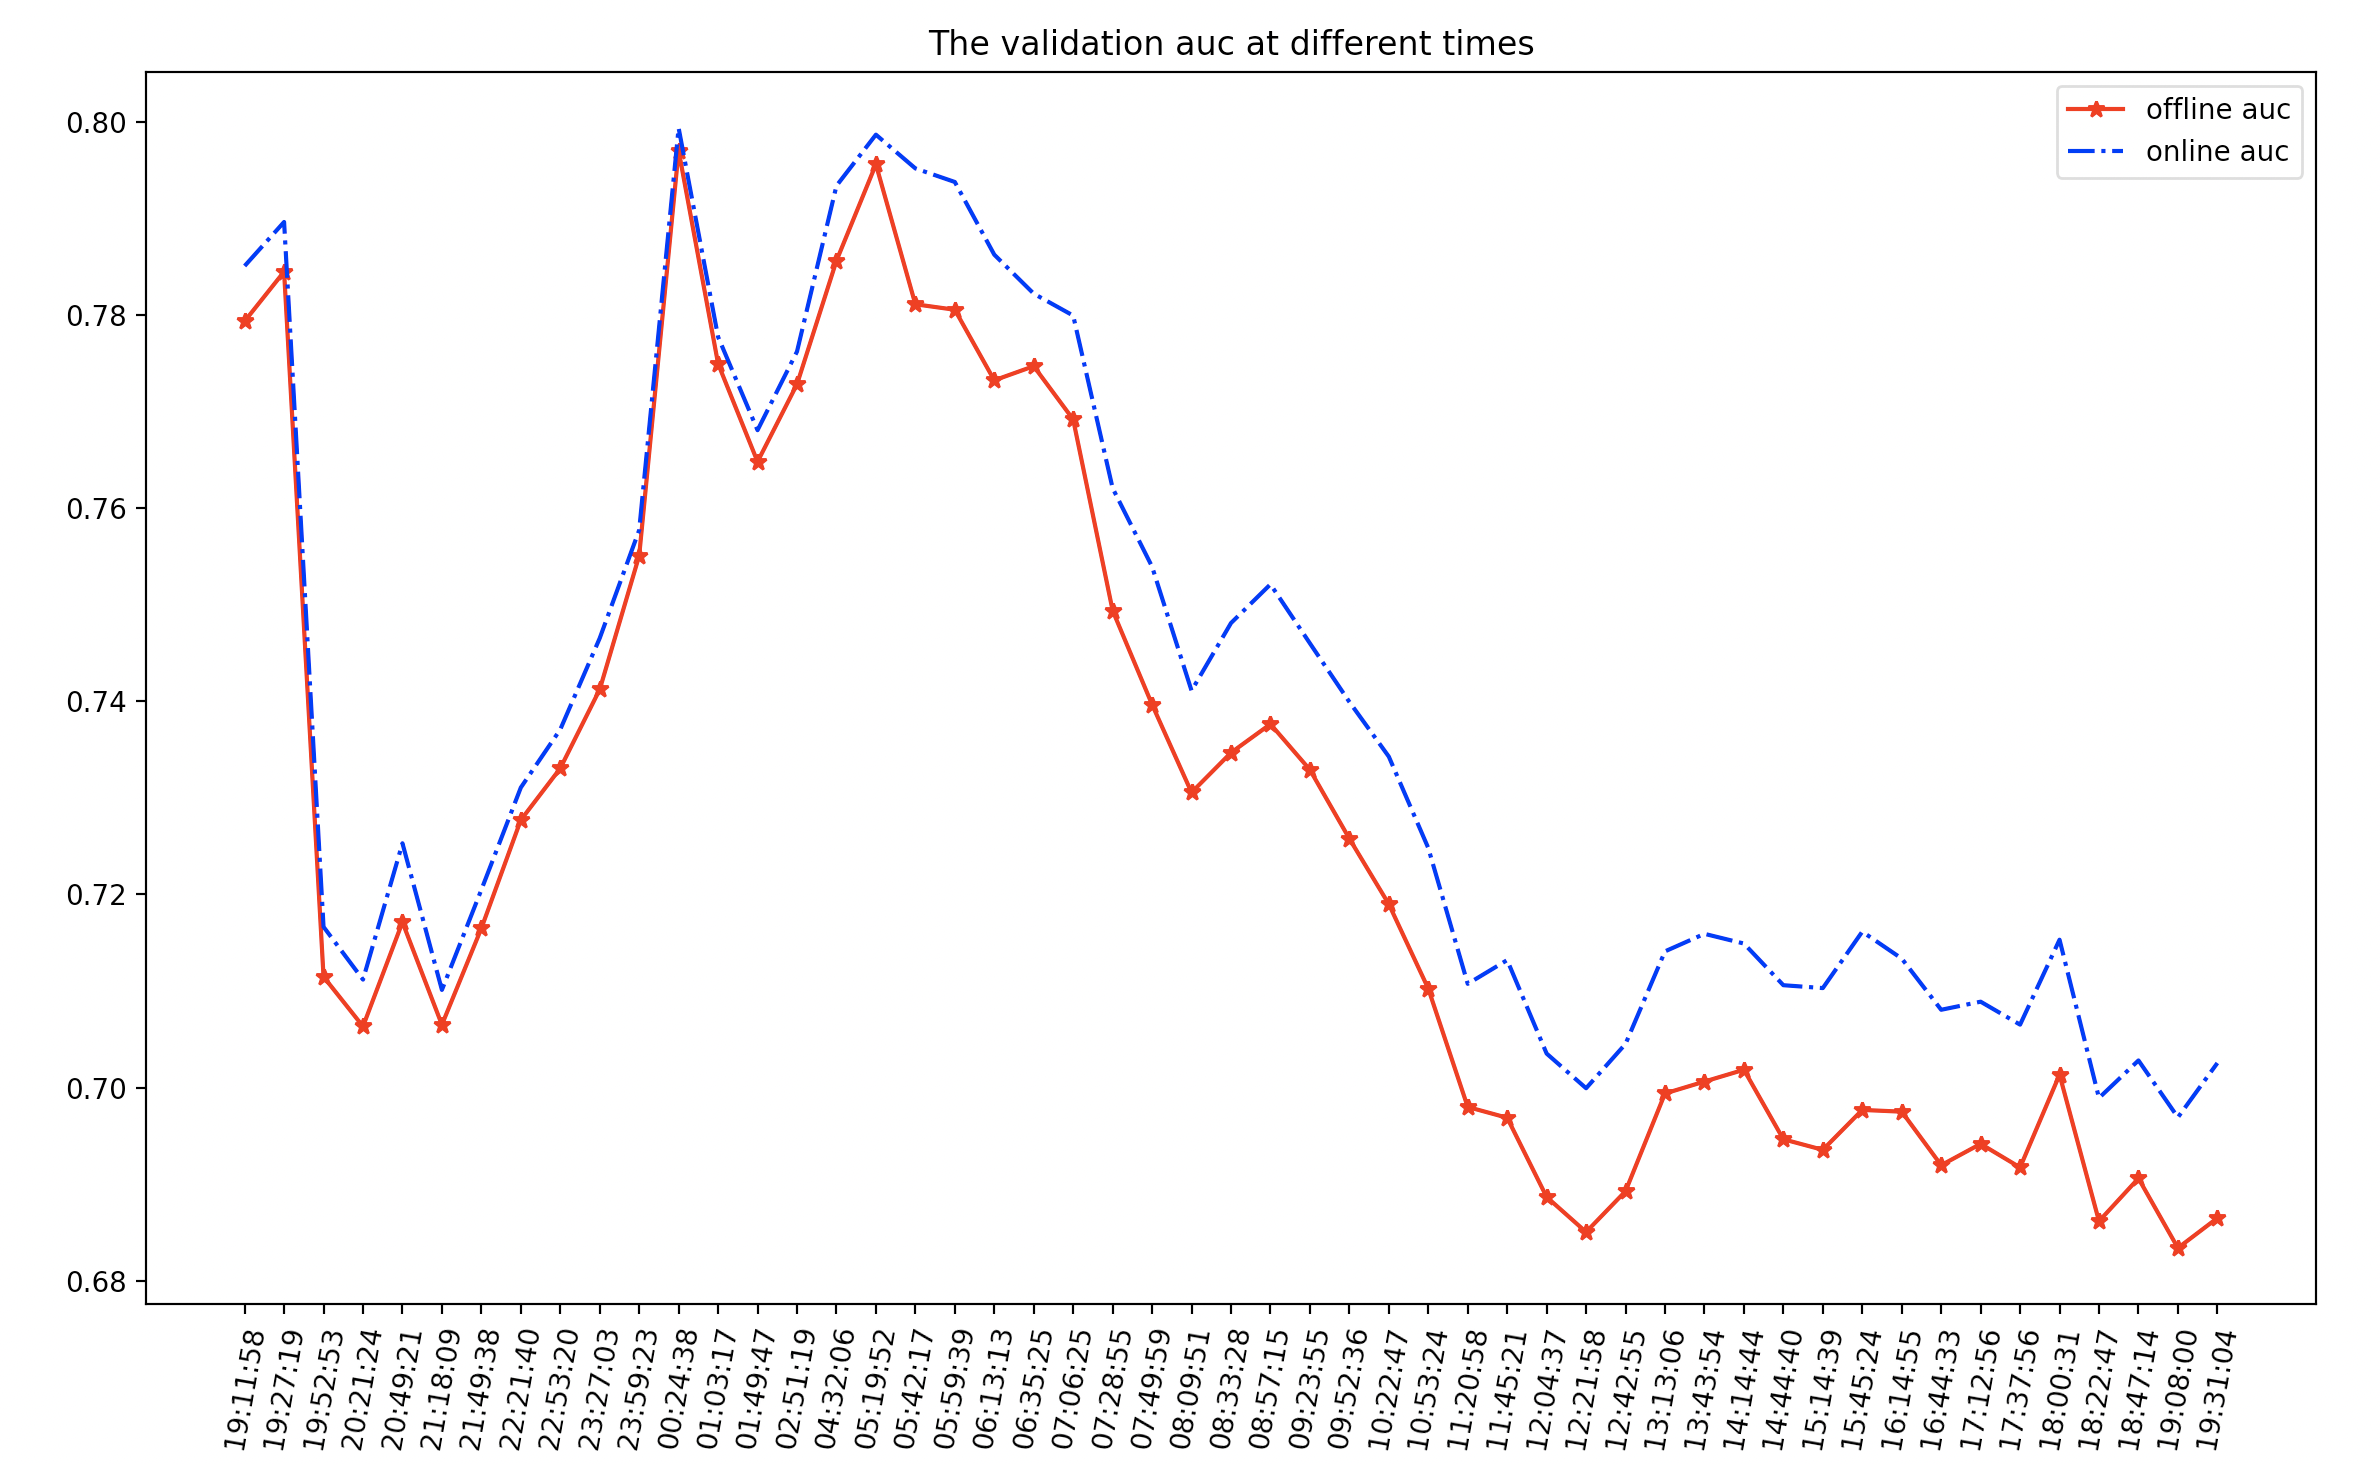
def myplot(Z):
    from pylab import plt
    plt.figure(figsize=(14, 8))
    plt.plot(Z.index, Z.off_auc,  '-*r', Z.index, Z.on_auc, '-.b')
    plt.xticks(Z.index, Z.logedtime.map(lambda x: x.split()[-1]), rotation=80)
    plt.legend(['offline auc', 'online auc'])
    plt.title('The validation auc at different times')
    plt.show()
import numpy as np
import matplotlib.pyplot as plt
from pylab import mpl
# 查看支持的中文字体 [f.name for f in matplotlib.font_manager.fontManager.ttflist]
mpl.rcParams['font.sans-serif'] = ['Heiti TC'] # mac 默认字体
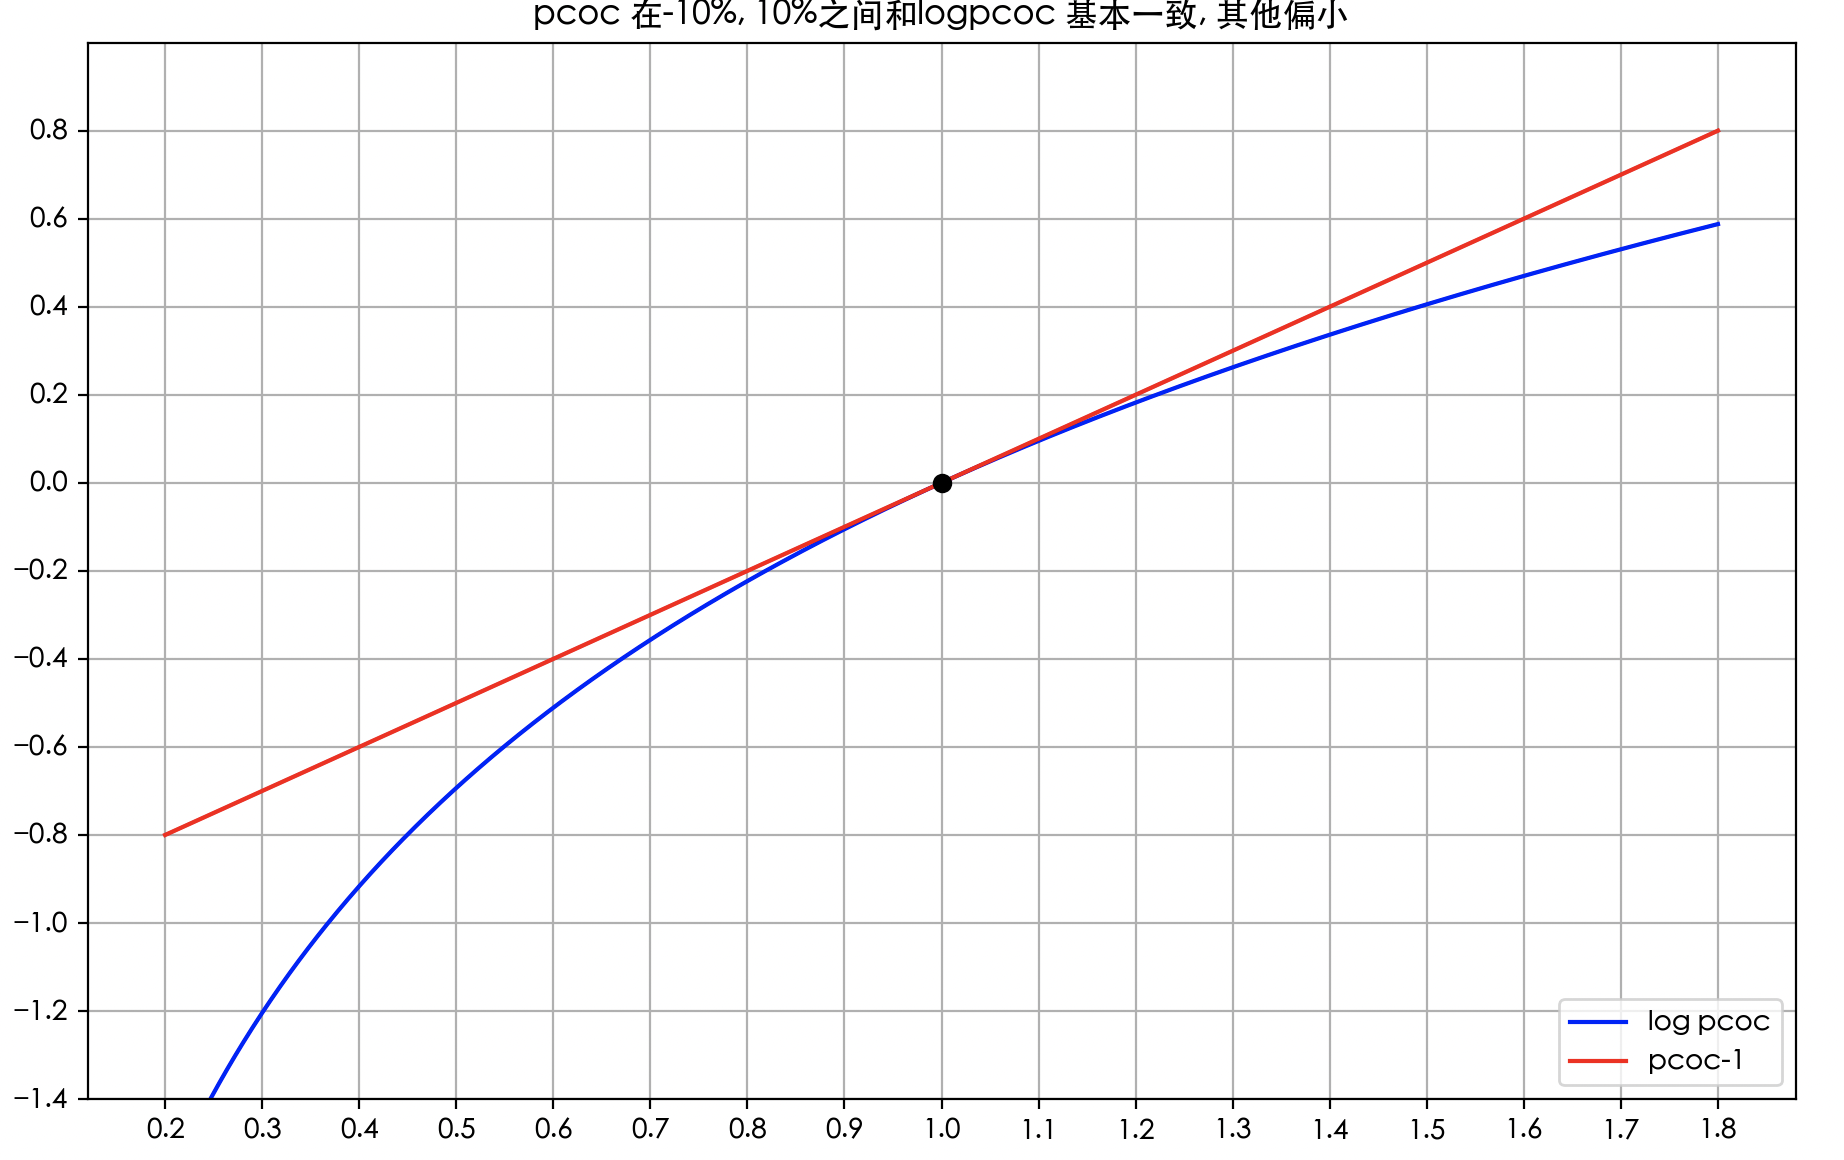
x = np.linspace(0.2, 1.8, 1000)
y1 = np.log(x)
y2 = x-1
plt.plot(x, y1, "-b", label="log pcoc")
plt.plot(x, y2, "-r", [1.0], [0], "k-o", label="pcoc-1")
plt.legend(["log pcoc","pcoc-1"], loc="lower right")
plt.yticks(np.arange(-1.4, 1, 0.2))
plt.xticks(np.arange(0.2, 1.8+0.001, 0.1))
plt.grid(True)
plt.title('pcoc 在-10%, 10%之间和logpcoc 基本一致, 其他偏小')
plt.ylim(-1.4, 1.0)
plt.show()
--- 她说, 她是仙,她不是神

 浙公网安备 33010602011771号