1 #!/usr/bin/env python3
2 #-*- coding:utf-8 -*-
3 #############################################
4 #File Name: ci_ex1.py
5 #Brief: 示例1
6 #Author: frank
7 #Email: frank0903@aliyun.com
8 #Created Time:2018-08-13 19:33:11
9 #Blog: http://www.cnblogs.com/black-mamba
10 #Github: https://github.com/xiaomagejunfu0903/statistic_notes
11 #############################################
12 import matplotlib.pyplot as plt
13 import numpy as np
14 import scipy.stats
15 import random
16
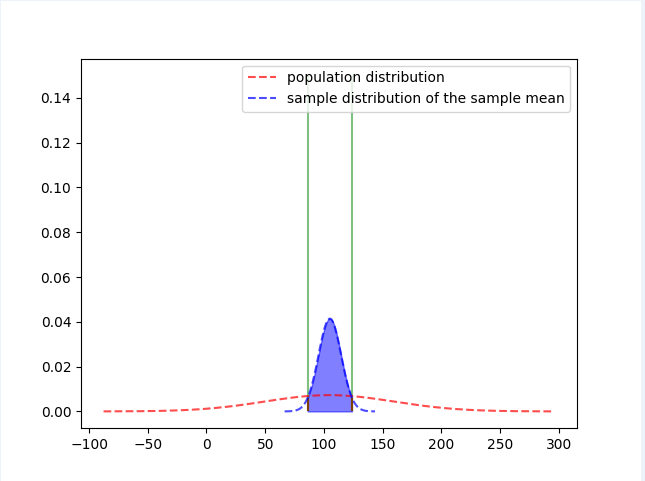
17 #随机抽取36个苹果,计算200,000苹果的重量在100到124g范围的概率
18 def sampling_distribution(data,confidence=0.95,sampling_times=1,sampling_size=30):
19 list_sampling_mean = []
20
21 for i in np.arange(sampling_times):
22 #samples = np.random.choice(data,sampling_size)#重复抽样
23 samples = random.sample(list(data),sampling_size)#不重复抽样
24 #print("samples:{}".format(samples))
25 samples_mean = np.mean(samples)
26 list_sampling_mean.append(samples_mean)
27
28
29 #the sampling distribution of the sampling mean,样本均值的抽样分布
30 sam_mean = np.mean(list_sampling_mean)
31 print("样本均值分布的期望,sam_mean:{}".format(sam_mean))
32 sam_std = np.std(list_sampling_mean)
33 print("样本均值分布的标准差,sam_std:{}".format(sam_std))
34
35 #获取样本均值分布~N(sam_mean, sam_std^2)
36 norm = scipy.stats.norm(loc=sam_mean, scale=sam_std)
37
38 #获取距离sam_mean 4个sam_std的范围
39 x = np.arange(sam_mean-sam_std*4, sam_mean+sam_std*4, 1)
40 #获取x对应的概率密度函数值
41 y = norm.pdf(x)
42 #显示样本均值分布
43 plt.plot(x, y,'b--',alpha=0.7,label='sample distribution of the sample mean')
44
45 #获取置信区间,方法1
46 confidence *= 100
47 c_low = (100 - confidence) / 2
48 c_high = 100 - c_low
49 c_interval = np.percentile(list_sampling_mean,[c_low, c_high])
50 print("95%置信区间端点对应的x坐标:{}".format(c_interval))
51
52
53 #获取置信区间,方法2
54 c_interval1 = [norm.isf(1-0.025),norm.isf(1-0.975)]
55 print("95%置信区间端点对应的x坐标:{}".format(c_interval1))
56 print("[{},{}]".format(sam_mean-sam_std*1.8, sam_mean+sam_std*1.8))
57
58 #绘制置信区间对应的竖线
59 a = c_interval[0]
60 b = c_interval[1]
61 plt.vlines(a, 0, norm.pdf(a),'r')
62 plt.vlines(b, 0, norm.pdf(b),'r')
63
64 a1 = c_interval1[0]
65 b1 = c_interval1[1]
66 plt.vlines(a1, 0, norm.pdf(a1),'g',alpha=0.5)
67 plt.vlines(b1, 0, norm.pdf(b1),'g',alpha=0.5)
68
69 fill_x = np.linspace(a1,b1,100)
70 #print("type of fill_x:{}".format(type(fill_x)))
71 fill_y = norm.pdf(fill_x)
72 #print("type of fill_y:{}".format(type(fill_y)))
73 plt.fill_between(fill_x, fill_y, color='b',alpha=0.5)
74
75
76 #模拟总体200,000个苹果的重量数据
77 #用不同的数据测试
78 #data1 = np.random.randint(10, 200, size=200000)
79 data1 = np.random.randint(50, 200, size=200000)
80
81 #总体均值
82 population_mean = np.mean(data1)
83 print("population mean:{}".format(population_mean))
84
85 #总体标准差
86 population_std = np.std(data1)
87 print("population std:{}".format(population_std))
88
89 #总体分布曲线
90 norm1 = scipy.stats.norm(population_mean, population_std)
91 x = np.arange(population_mean-population_std*3.5, population_mean+population_std*3.5, 1)
92 y = norm1.pdf(x)
93 plt.plot(x, y,'r--',label='population distribution',alpha=0.7)
94
95
96 sampling_distribution(data1,sampling_times=1000,sampling_size=36)
97
98 plt.legend()
99 plt.show()
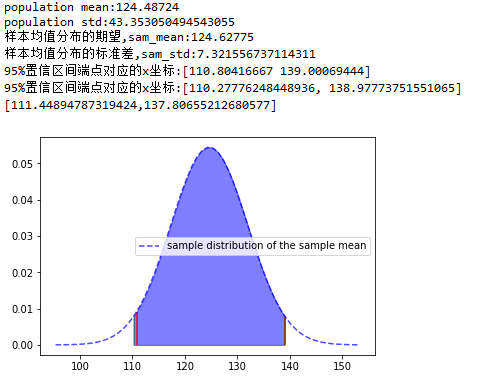
ci_ex1.py 演示了小马哥课堂-统计学-置信区间 的示例1
![]()
![]()
 1 #!/usr/bin/env python3
 2 #-*- coding:utf-8 -*-
 3 #############################################
 4 #File Name: ci_ex2.py
 5 #Brief: 演示示例2
 6 #Author: frank
 7 #Email: frank0903@aliyun.com
 8 #Created Time:2018-08-13 20:14:44
 9 #Blog: http://www.cnblogs.com/black-mamba
10 #Github: https://github.com/xiaomagejunfu0903/statistic_notes
11 #############################################
12 import numpy as np
13 import matplotlib.pyplot as plt
14 import matplotlib as mpl
15 import scipy.stats
16
17 #设置中文字体
18 zhfont = mpl.font_manager.FontProperties(fname='/usr/share/fonts/truetype/wqy/wqy-microhei.ttc')
19
20 #95%置信水平的标准正态分布的置信区间演示
21 norm = scipy.stats.norm()
22 #x轴
23 x = np.linspace(norm.ppf(0.001),norm.ppf(0.999), 10000)
24 #y轴
25 y= norm.pdf(x)
26 #显示标准正态分布曲线
27 plt.plot(x,y)
28
29 #画置信区间的界限
30 plt.vlines(-1.96,ymin=0,ymax=norm.pdf(-1.96),colors='r', linestyles='dashed')
31 plt.vlines(1.96,ymin=0,ymax=norm.pdf(1.96),colors='r', linestyles='dashed')
32
33 #显示 置信区间
34 fill_x = np.linspace(-1.96,1.96,100)
35 #print("type of fill_x:{}".format(type(fill_x)))
36 fill_y = norm.pdf(fill_x)
37 #print("type of fill_y:{}".format(type(fill_y)))
38 plt.fill_between(fill_x, fill_y, color='b',alpha=0.5)
39
40 #已知置信水平,求置信区间
41
42 #方法1:不太准确
43 confidence = 95
44 c_low = (100-confidence)/2
45 c_high = 100-c_low
46 c_interval = np.percentile(x,[c_low, c_high])
47 print(c_interval)
48 plt.vlines(c_interval[0] ,ymin=0,ymax=0.3,colors='purple', linestyles='dashed')
49 plt.vlines(c_interval[1] ,ymin=0,ymax=0.3,colors='purple', linestyles='dashed')
50
51 #方法2:更好的方式
52 c_interval = [norm.isf(1-0.025),norm.isf(1-0.975)]
53 print(c_interval)
54 plt.vlines(c_interval[0] ,ymin=0,ymax=norm.pdf(-1.96),colors='r', linestyles='dashed',alpha=0.5)
55 plt.vlines(c_interval[1] ,ymin=0,ymax=norm.pdf(1.96),colors='r', linestyles='dashed',alpha=0.5)
56
57 plt.title('标准正态分布的95%置信区间',fontproperties=zhfont)
58 plt.savefig("ci_ex2.jpg")
59 #print("pdf(1.96):{}".format(norm.pdf(1.96)))
60 #print("cdf(1.96):{}".format(norm.cdf(1.96)))
61 #print("sf(1.96):{}".format(norm.sf(1.96)))
62 #print("isf(0.025):{}".format(norm.isf(0.025)))
63 plt.show()
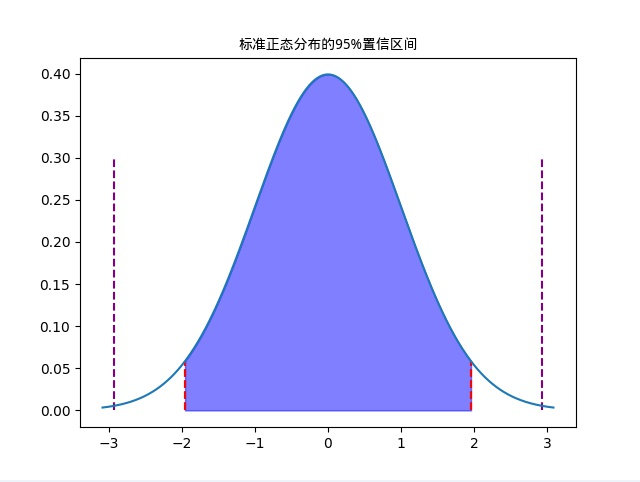
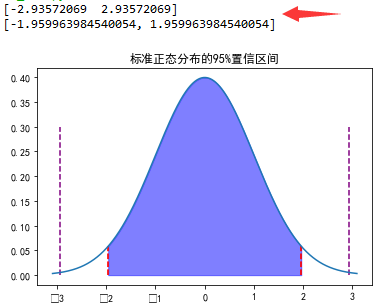
ci_ex2.py 演示了小马哥课堂-统计学-置信区间 的示例2
![]()
![]()


 浙公网安备 33010602011771号