极坐标实现移动轨迹图
写在前面:主要还是根据后台返回的数据类型来修改样式,这里只是给出一个大体思路(菜鸡一个,请大佬轻喷)
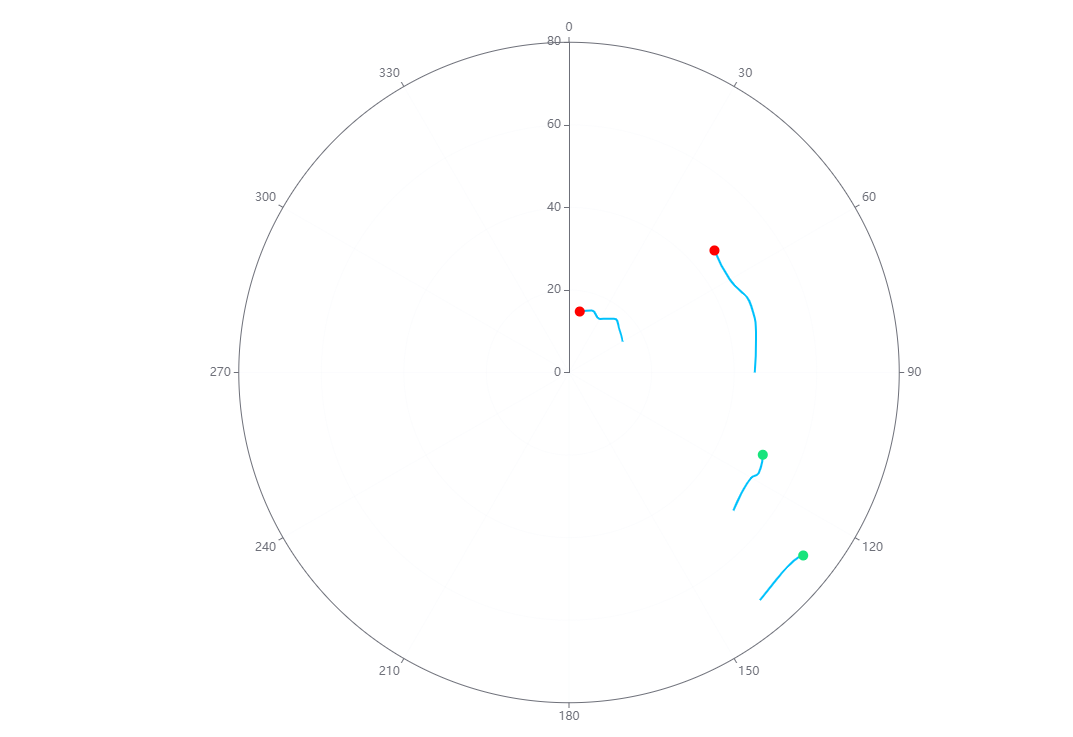
效果图:
数据代码:
data1: [
        [15, 10],
        [16, 20],
        [15, 30],
        [17, 40],
        [16, 50],
        [15, 60],
        [, 10],
        [46, 50],
        [45, 60],
        [47, 70],
        [46, 80],
        [45, 90],
      ],
      data2: [
        [51, 113.0],
        [52, 118.0],
        [51, 120.0],
        [51, 125.0],
        [52, 130.0],
        [51, 125.0],
        [51],
        [72, 128.0],
        [71, 130.0],
        [71, 135.0],
        [72, 140.0],
        [71, 135.0],
      ],
ps:想要通过一个数组实现多段效果,两段之间的单个数据组是关键,如:[51]、[,10]、[]、[""]等
全部代码:
<template>
  <div class="echarts">
    <div id="PolarId" class="echart-container"></div>
  </div>
</template>
<script>
import * as echarts from "echarts";
export default {
  props: ["PolarId"],
  data() {
    return {
      data1: [
        [15, 10],
        [16, 20],
        [15, 30],
        [17, 40],
        [16, 50],
        [15, 60],
        [, 10],
        [46, 50],
        [45, 60],
        [47, 70],
        [46, 80],
        [45, 90],
      ],
      data2: [
        [51, 113.0],
        [52, 118.0],
        [51, 120.0],
        [51, 125.0],
        [52, 130.0],
        [51, 125.0],
        [51],
        [72, 128.0],
        [71, 130.0],
        [71, 135.0],
        [72, 140.0],
        [71, 135.0],
      ],
    };
  },
  mounted() {
    this.$nextTick(() => {
      this.drawscatter(this.data1, this.data2);
    });
  },
  methods: {
    drawscatter(data1, data2) {
      // 初始化echarts
      let PolarEcharts = echarts.init(document.getElementById("PolarId"));
      PolarEcharts.setOption({
        title: {
          text: "",
        },
        legend: {
          data: [""],
        },
        gird: {
          width: "100%",
          height: "100%",
        },
        polar: {
          //极坐标
          radius: ["0%", "85%"], //=半径大小
        },
        tooltip: {
          show: false,
          trigger: "axis",
          axisPointer: {
            type: "line",
          },
        },
        angleAxis: {
          type: "value",
          min: 0,
          max: 360,
          axisTick: {
            show: true,
          },
          axisLabel: {
            show: true,
          },
          axisLine: {
            show: true,
            lineStyle: {
              opacity: 1,
            },
          },
          splitLine: {
            show: true,
            lineStyle: {
              opacity: 0.1,
            },
          },
        },
        radiusAxis: {
          type: "value",
          splitNumber: 3,
          axisLine: {
            show: true,
            lineStyle: {
              opacity: 1,
            },
          },
          splitLine: {
            show: true,
            lineStyle: {
              opacity: 0.1,
            },
          },
          axisTick: {
            show: true,
          },
          axisLabel: {
            show: true,
          },
        },
        series: [
          {
            smooth: true,
            coordinateSystem: "polar",
            name: "line",
            symbolSize: 10,
            symbol: (rawValue, params) => {
              if (params.dataIndex > 0) {
                console.log( data1[params.dataIndex - 1])
                if (
                  data1[params.dataIndex - 1][0] === undefined ||
                  data1[params.dataIndex - 1][1] === undefined
                ) {
                  return "circle";
                }
              }
              if (params.dataIndex === 0) {
                return "circle";
              } else {
                return "none";
              }
            },
            itemStyle: {
              color: "#fe0200",
            },
            lineStyle: {
              color: "#00c1fc",
            },
            show: true,
            formatter: "{b}",
            position: "inside",
            color: "#fff",
            fontSize: 15,
            type: "line",
            data: this.data1,
          },
          {
            smooth: true,
            coordinateSystem: "polar",
            name: "line",
            symbolSize: 10,
            symbol: (rawValue, params) => {
              if (params.dataIndex > 0) {
                if (
                  data2[params.dataIndex - 1][0] === undefined ||
                  data2[params.dataIndex - 1][1] === undefined
                ) {
                  return "circle";
                }
              }
              if (params.dataIndex === 0) {
                return "circle";
              } else {
                return "none";
              }
            },
            label: {
              show: true,
              formatter: "{b}",
              position: "inside",
              color: "#fff",
              fontSize: 15,
            },
            itemStyle: {
              color: "#18e47c",
            },
            lineStyle: {
              color: "#00c1fc",
            },
            type: "line",
            data: this.data2,
          },
        ],
      });
      this.$nextTick(() => {
        PolarEcharts.resize();
      });
    },
  },
};
</script>
<style lang="less" scoped>
.echarts {
  width: 100%;
  height: 100%;
  position: relative;
}
.echart-container {
  position: absolute;
  width: 100%;
  height: 100%;
}
</style>
ps:关键部分代码:
   symbol: (rawValue, params) => {
              if (params.dataIndex > 0) {
                console.log( data1[params.dataIndex - 1])
                if (
                  data1[params.dataIndex - 1][0] === undefined ||
                  data1[params.dataIndex - 1][1] === undefined
                ) {
                  return "circle";
                }
              }
              if (params.dataIndex === 0) {
                return "circle";
              } else {
                return "none";
              }
            },
这里的代码是实现头部圆点部分以及尾巴部分。
新手理解,若有误,请各位大佬指点,Thanks♪(・ω・)ノ

 浙公网安备 33010602011771号