
Golang - Windows本地从0-1搭建go服务监控系统
核心架构:[Gin 应用] (Go暴露/metrics端点)-> [Prometheus] (抓取/存储) -> [Grafana] (可视化)
第一阶段:Gin 应用开发(指标暴露)

Go服务代码:
package main

import (
    "net/http"
    "time"

    "github.com/gin-gonic/gin"
    "github.com/prometheus/client_golang/prometheus"
    "github.com/prometheus/client_golang/prometheus/promhttp"
)

// 定义自定义指标
var (
    httpRequestsTotal = prometheus.NewCounterVec(
        prometheus.CounterOpts{
            Name: "http_requests_total",
            Help: "Total number of HTTP requests",
        },
        []string{"path", "method", "status"}, // 标签(维度)
    )
)

func init() {
    // 注册指标到 Prometheus 默认采集器
    prometheus.MustRegister(httpRequestsTotal)
}

func main() {
    r := gin.Default()

    // 添加 Prometheus 指标端点(/metrics)
    r.GET("/metrics", gin.WrapH(promhttp.Handler()))

    // 模拟一个 API 接口
    r.GET("/api/data", func(c *gin.Context) {
        // 模拟业务逻辑(耗时操作)
        time.Sleep(100 * time.Millisecond)

        // 记录指标
        path := c.Request.URL.Path
        method := c.Request.Method
        status := http.StatusOK

        httpRequestsTotal.WithLabelValues(path, method, string(status)).Inc()

        c.JSON(http.StatusOK, gin.H{
            "message": "Data fetched successfully",
        })
    })

    // 启动服务
    r.Run(":8080") // 默认监听 0.0.0.0:8080
}
第二阶段:Prometheus 部署
1.prometheus.yml:
# D:/docker/prometheus/prometheus.yml
global:
  scrape_interval: 15s
  evaluation_interval: 15s # 告警规则评估频率
scrape_configs:
  - job_name: "prometheus"
    static_configs:
      - targets: ["localhost:9090"]  # 监控自身

  # 添加其他监控目标(示例)
  - job_name: "service"
    static_configs:
      - targets: ["host.docker.internal:9100"]  # 监控宿主机


  # 监控 Gin 应用
  - job_name: 'gin'
    metrics_path: '/metrics'  # Gin 暴露指标的路径
    static_configs:
      - targets: ['host.docker.internal:8080']  # Windows 特殊地址
        labels:
          env: 'local'
          app: 'gin-demo'
2.Docker启动
docker run -d --name prometheus -p 9090:9090 -v "D:\docker\prometheus:/etc/prometheus" prom/prometheus:v2.41.0
第三阶段:Grafana 部署
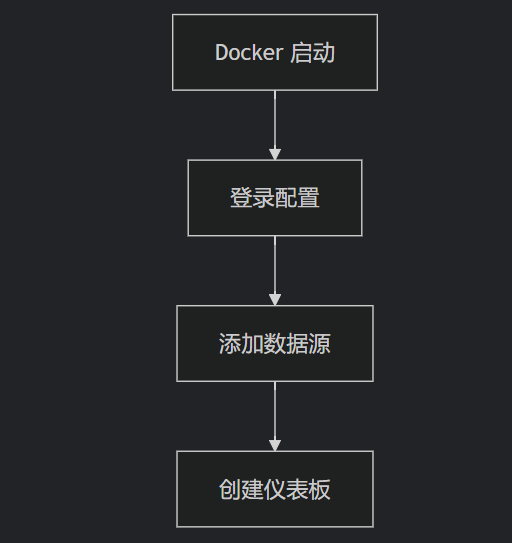
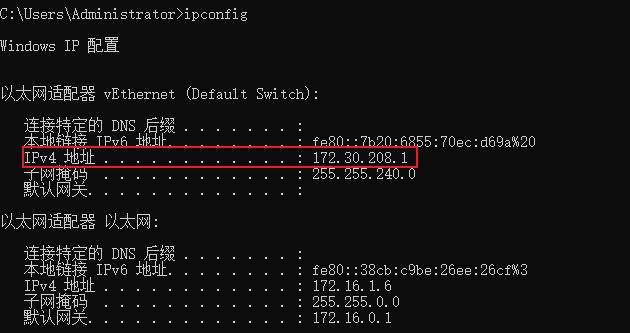
1.关键配置:
URL: http://ip:9090  // 踩过坑,填了127.0.0.1或localhost都不行,只能填
Access: Server(很多文章说必须!但我没看到有这个选项?)
type: prometheus
Scrape interval: 15s
2.仪表板查询:
# 请求速率
sum(rate(http_requests_total[$__rate_interval]))
# 错误率
sum(rate(http_requests_total{status!~"2.."}[$__rate_interval]))
sum(rate(http_requests_total[$__rate_interval]))
3.写QL(关键)
测试查询:up{job="gin-app"}
xxxx
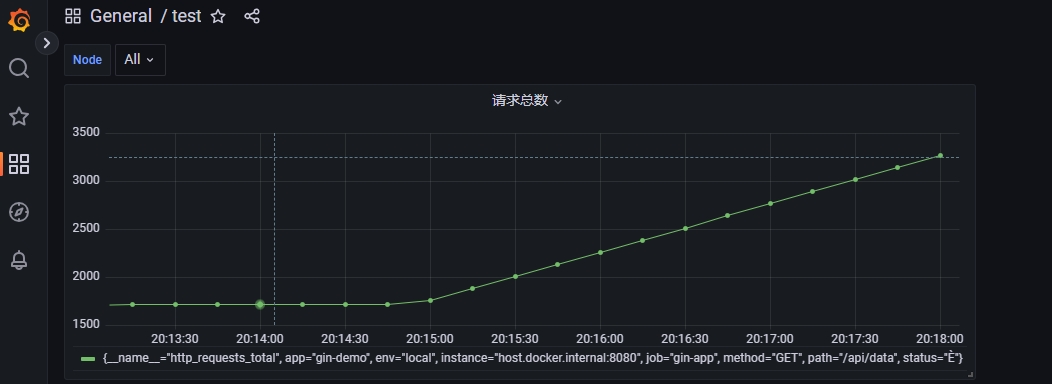
第四阶段:测试验证
简单验证:
curl http://localhost:8080/api/data

在PowerSheel中压测:
$url = "http://localhost:8080/api/data"
$durationSeconds = 10  # 测试持续时间(秒)
$possibleQPS = @(100, 2000,1200,2900, 500)  # 每秒随机请求数(可自定义)

$rng = New-Object System.Random
$stopwatch = [System.Diagnostics.Stopwatch]::StartNew()

while ($stopwatch.Elapsed.TotalSeconds -lt $durationSeconds) {
    # 随机选择当前秒的 QPS(100、2000 或 500)
    $currentQPS = $possibleQPS[$rng.Next(0, $possibleQPS.Length)]

    # 计算请求间隔(毫秒)
    $delayMs = 1000 / $currentQPS

    # 发送 $currentQPS 次请求
    for ($i = 0; $i -lt $currentQPS; $i++) {
        # 异步发送请求(不等待响应)
        $null = Invoke-WebRequest -Uri $url -UseBasicParsing -Method Get -TimeoutSec 1

        # 控制请求频率
        $elapsed = $stopwatch.ElapsedMilliseconds
        $expectedTime = ($i * $delayMs) + ($elapsed - ($elapsed % 1000))
        $sleepTime = $expectedTime - $stopwatch.ElapsedMilliseconds
        if ($sleepTime > 0) {
            Start-Sleep -Milliseconds $sleepTime
        }
    }

    # 等待到下一秒开始
    $nextSecond = [math]::Ceiling($stopwatch.Elapsed.TotalSeconds)
    while ($stopwatch.Elapsed.TotalSeconds -lt $nextSecond) {
        Start-Sleep -Milliseconds 10
    }
}

$stopwatch.Stop()
Write-Host "Test completed in $($stopwatch.Elapsed.TotalSeconds) seconds"
效果展示:
遇到的问题及解决方案总结
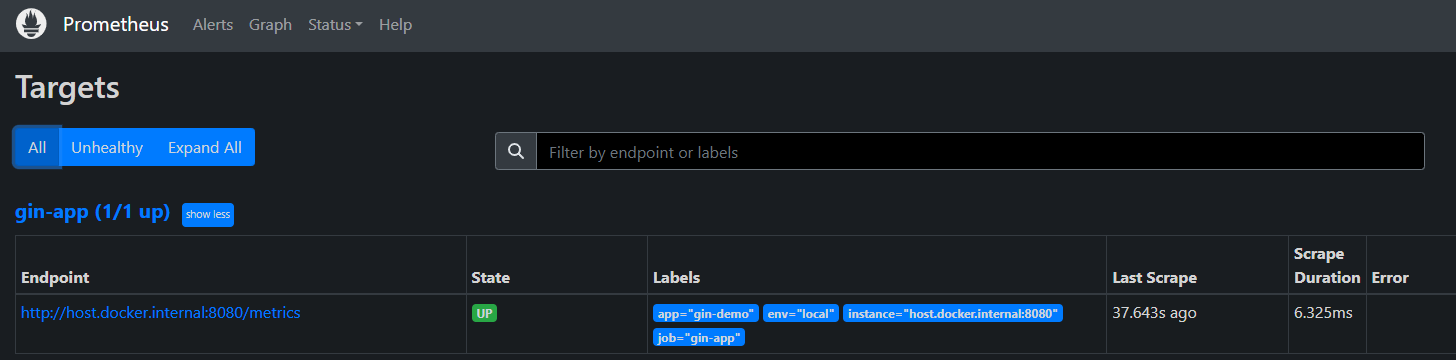
1. Prometheus 无法抓取 Gin 应用
-
现象:Targets 页面显示 DOWN
-
原因:Windows Docker 网络隔离
-
解决:
  prometheus:
    extra_hosts:
      - "host.docker.internal:host-gateway" # Windows 特殊映射
2. Grafana 显示 "Plugin Error"
-
现象:An error occurred within the plugin
-
关键原因:
-
数据源 URL 配置错误(使用了 localhost 而不是服务名)
-
Access 模式未设置为 "Server"
-
-
解决:
# 正确配置
URL: http://ip:9090
Access: Server
3. PromQL 查询无数据
-
现象:Grafana 显示 "No data"
-
排查步骤:
-
直接访问 http://localhost:8080/metrics 确认数据
-
在 Prometheus Web UI 测试相同查询
-
检查时间范围设置
-
使用 $__rate_interval替代固定区间
-
4. 空 URL 错误
-
现象:parse "": empty url
-
原因:数据源配置损坏
-
解决:
-
删除并重建数据源
-
检查 Grafana 数据库
-

 浙公网安备 33010602011771号