简单绘图举例
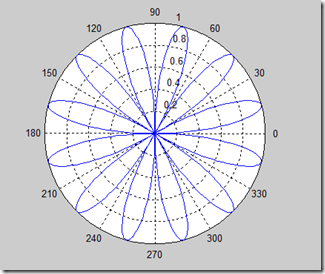
1 极坐标
t=0:0.01:2*pi;
>> polar(t,sin(6*t))
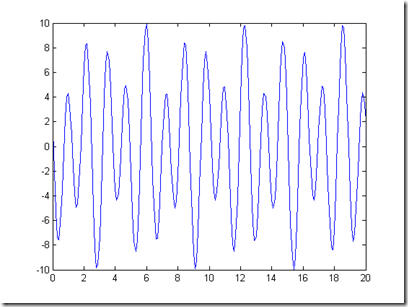
2 直角坐标
x=0:0.1:20;
>> y=3*sin(3*x+3/4*pi)+7*cos(5*x+0.5*pi);
>> plot(x,y)
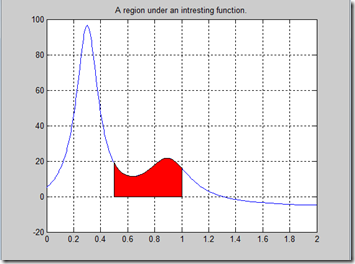
3 填充图
fplot('humps',[0,2],'b')
>> hold on
>> patch([0.5 0.5:0.02:1 1],[0 humps(0.5:0.02:1) 0],'r');
>> hold off
>> title('A region under an intresting function.')
>> grid
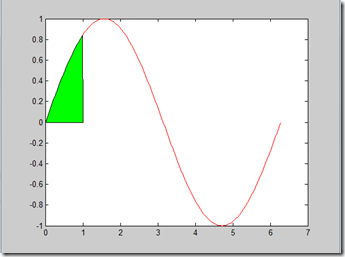
x=0:pi/60:2*pi;
>> y=sin(x);;
>> x1=0:pi/60:1;
>> y1=sin(x1);
>> plot(x,y,'r');
>> hold on
>> fill([x1,1],[y1 0],'g')


 浙公网安备 33010602011771号