Linux启动时间优化-内核和用户空间启动优化实践
关键词:initcall、bootgraph.py、bootchartd、pybootchart等。
启动时间的优化,分为两大部分,分别是内核部分和用户空间两大部分。
从内核timestamp 0.000000作为内核启动起点,到free_initmem()输出"Freeing init memory"作为内核启动的终点。
借助于bootgraph.py对内核的kmsg进行分析,输出bootgraph.html和initcall耗时csv文件。
在紧接着free_initmem()下面,是init进程的启动,作为用户空间的起点。内核的终点和用户空间的起点基本上可以任务无缝衔接。
用户空间借助bootchartd抓取/proc/uptime、/proc/stat、/proc/diskstats、/proc/xxx/stat、/proc/meminfo信息,最后打包到bootlog.tgz。
pybootchart.py对bootlog.tgz进行解析,并生成关于CPU占用率、Memory使用情况、磁盘吞吐率以及各进程执行情况的图标。
基于以上内核和用户空间输出,可以发现initcall和进程启动的异常情况。
比如哪个initcall耗时异常;哪个进程启动耗时过长,可以进入进程启动函数查看是否有阻塞等情况。
1. 内核启动优化
在内核源码中自带了一个工具(scripts/bootgraph.pl)用于分析启动时间,这个工具生成output.svg。
但是bootgraph.py生成的结果可读性更好,也更加容易发现问题。
1.1 准备工作
对内核的修改包括,initcall_debug和CONFIG_LOG_BUF_SHIFT。
1.1.1 打开initcall_debug
bool initcall_debug = true;
这样做的目的是在内核kmsg中记录每个initcall的calling和initcall时间,本工具分析依赖于这些kmsg。
static int __init_or_module do_one_initcall_debug(initcall_t fn)
{
    ktime_t calltime, delta, rettime;
    unsigned long long duration;
    int ret;

    printk(KERN_DEBUG "calling  %pF @ %i\n", fn, task_pid_nr(current));-----------------------initcall开始log
    calltime = ktime_get();
    ret = fn();
    rettime = ktime_get();
    delta = ktime_sub(rettime, calltime);
    duration = (unsigned long long) ktime_to_ns(delta) >> 10;
    printk(KERN_DEBUG "initcall %pF returned %d after %lld usecs\n", fn,
        ret, duration);-----------------------------------------------------------------------initcall结束log

    return ret;
}

int __init_or_module do_one_initcall(initcall_t fn)
{
    int count = preempt_count();
    int ret;

    if (initcall_debug)
        ret = do_one_initcall_debug(fn);
    else
        ret = fn();
...
}
1.1.2 增大log_buf空间
log_buf用于存放printk消息,他类似于RingBuffer,超出部分会覆盖头部。
#define __LOG_BUF_LEN    (1 << CONFIG_LOG_BUF_SHIFT)

static char __log_buf[__LOG_BUF_LEN];
static char *log_buf = __log_buf;
所以将CONFIG_LOG_BUF_SHIFT从16增加到18,即log_buf空间从64K增加到256K。
1.1.3 对bootgraph.py的改进
1.1.3.1 划分内核启动的起点终点
界定内核启动的起点很容易,从时间0开始。
用户空间的起点是init进程,所以将内核空间的终点放在启动init进程之前。
这样就可以清晰看到initcall在整个内核初始化中的位置。
static inline int free_area(unsigned long pfn, unsigned long end, char *s)
{
    unsigned int pages = 0, size = (end - pfn) << (PAGE_SHIFT - 10);
...
    if (size && s)
        printk(KERN_INFO "Freeing %s memory: %dK\n", s, size);-------------输出“Freeing init memory:”到kmsg中。

    return pages;
}

void free_initmem(void)
{
...
    if (!machine_is_integrator() && !machine_is_cintegrator())
        totalram_pages += free_area(__phys_to_pfn(__pa(__init_begin)),
                        __phys_to_pfn(__pa(__init_end)),
                        "init");
}

static noinline int init_post(void)
{
    /* need to finish all async __init code before freeing the memory */
    async_synchronize_full();
    free_initmem();------------------------------------------------------------内核空间的终点
...
    run_init_process("/sbin/init");--------------------------------------------用户空间的起点
    run_init_process("/etc/init");
    run_init_process("/bin/init");
    run_init_process("/bin/sh");
...
}
基于“Freeing init memory”对内核和用户空间初始化进行划分,Split kernel and userspace by free_area()。
commit 6195fa73b5522ec5f2461932c894421c30fc3cd7
Author: Arnold Lu <arnoldlu@qq.com>
Date:   Tue Jun 19 22:49:09 2018 +0800

    Split kernel and userspace by free_area()

diff --git a/bootgraph.py b/bootgraph.py
index 8ee626c..dafe359 100755
--- a/bootgraph.py
+++ b/bootgraph.py
@@ -63,6 +63,7 @@ class SystemValues(aslib.SystemValues):
     timeformat = '%.6f'
     bootloader = 'grub'
     blexec = []
+    last_init=0
     def __init__(self):
         self.hostname = platform.node()
         self.testtime = datetime.now().strftime('%Y-%m-%d_%H:%M:%S')
@@ -223,7 +224,7 @@ class Data(aslib.Data):
             'kernel': {'list': dict(), 'start': -1.0, 'end': -1.0, 'row': 0,
                 'order': 0, 'color': 'linear-gradient(to bottom, #fff, #bcf)'},
             'user': {'list': dict(), 'start': -1.0, 'end': -1.0, 'row': 0,
-                'order': 1, 'color': '#fff'}
+                'order': 1, 'color': 'linear-gradient(to bottom, #456, #cde)'}
         }
     def deviceTopology(self):
         return ''
@@ -345,17 +346,18 @@ def parseKernelLog():
         m = re.match('^initcall *(?P<f>.*)\+.* returned (?P<r>.*) after (?P<t>.*) usecs', msg)
         if(m):
             data.valid = True
-            data.end = ktime
+            sysvals.last_init = '%.0f'%(ktime*1000)
             f, r, t = m.group('f', 'r', 't')
             if(f in devtemp):
                 start, pid = devtemp[f]
                 data.newAction(phase, f, pid, start, ktime, int(r), int(t))
                 del devtemp[f]
             continue
-        if(re.match('^Freeing unused kernel memory.*', msg)):
+        if(re.match('^Freeing init kernel memory.*', msg)):
             data.tUserMode = ktime
             data.dmesg['kernel']['end'] = ktime
             data.dmesg['user']['start'] = ktime
+            data.end = ktime+0.1
             phase = 'user'

     if tp.stamp:
@@ -531,8 +533,8 @@ def createBootGraph(data):
         print('ERROR: No timeline data')
         return False
     user_mode = '%.0f'%(data.tUserMode*1000)
-    last_init = '%.0f'%(tTotal*1000)
-    devtl.html += html_timetotal.format(user_mode, last_init)
+    #last_init = '%.0f'%(tTotal*1000)
+    devtl.html += html_timetotal.format(user_mode, sysvals.last_init)

     # determine the maximum number of rows we need to draw
     devlist = []
1.1.3.2 将每个initcall启动记录到csv
图形化的好处就是直观,但是有时候需要更准确的数据进行排序分析。
这时候生成excel数据,进行处理就很方便了。
增加下面代码会在生成bootgraph.html的同时生成devinit.csv文件,Record data to csv file.。
commit 7bcb705ed30b1e1a0ca3385d01b412f8e6f23b4e
Author: Arnold Lu <arnoldlu@qq.com>
Date:   Tue Jun 19 22:52:43 2018 +0800

    Record data to csv file.

diff --git a/bootgraph.py b/bootgraph.py
index dafe359..7f43cb7 100755
--- a/bootgraph.py
+++ b/bootgraph.py
@@ -33,6 +33,7 @@ import shutil
 from datetime import datetime, timedelta
 from subprocess import call, Popen, PIPE
 import sleepgraph as aslib
+import csv

 # ----------------- CLASSES --------------------

@@ -48,6 +49,7 @@ class SystemValues(aslib.SystemValues):
     kernel = ''
     dmesgfile = ''
     ftracefile = ''
+    csvfile = 'devinit.csv'
     htmlfile = 'bootgraph.html'
     testdir = ''
     kparams = ''
@@ -300,6 +302,9 @@ def parseKernelLog():
         lf = open(sysvals.dmesgfile, 'r')
     else:
         lf = Popen('dmesg', stdout=PIPE).stdout
+    csvfile = open(sysvals.csvfile, 'wb');
+    csvwriter = csv.writer(csvfile)
+    csvwriter.writerow(['Func', 'Start(ms)', 'End(ms)', 'Duration(ms)', 'Return'])
     for line in lf:
         line = line.replace('\r\n', '')
         # grab the stamp and sysinfo
@@ -351,6 +356,7 @@ def parseKernelLog():
             if(f in devtemp):
                 start, pid = devtemp[f]
                 data.newAction(phase, f, pid, start, ktime, int(r), int(t))
+                csvwriter.writerow([f, start*1000, ktime*1000, float(t)/1000, int(r)]);
                 del devtemp[f]
             continue
         if(re.match('^Freeing init kernel memory.*', msg)):
@@ -364,6 +370,7 @@ def parseKernelLog():
         sysvals.stamp = 0
         tp.parseStamp(data, sysvals)
     data.dmesg['user']['end'] = data.end
+    csvfile.close()
     lf.close()
     return data
1.2 生成测试结果
执行如下命令生成两个文件bootgraph.html和devinit.csv。
bootgraph.py依赖于kmsg中的“calling”/“initcall”识别initcall的起点终点,依赖“Freeing init memory”作为内核启动终点。
./bootgraph.py -dmesg kmsg.txt -addlogs
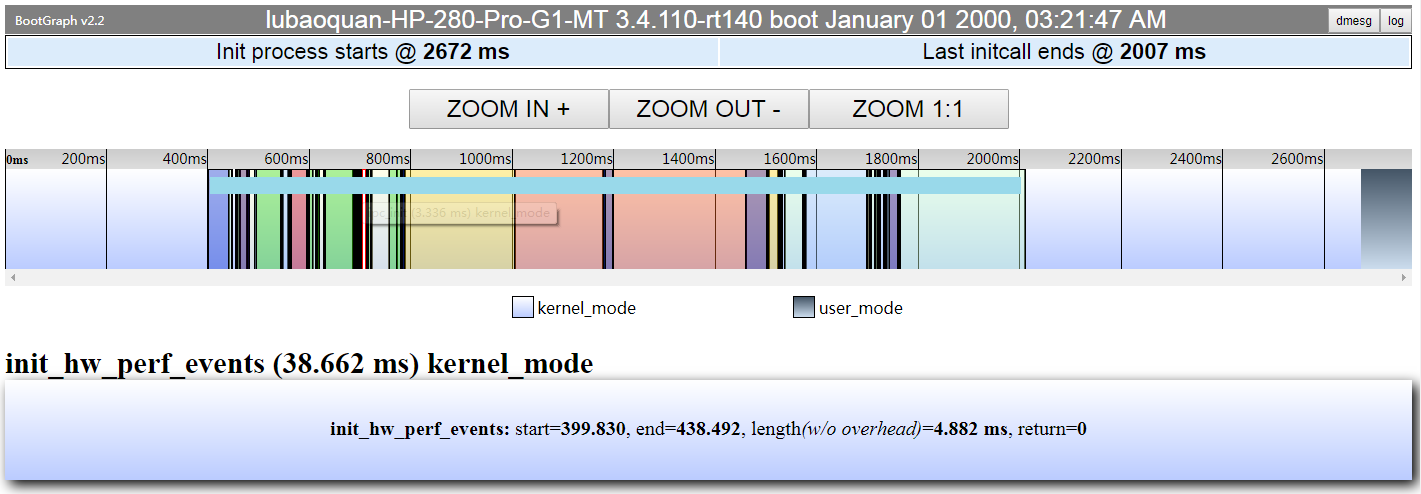
PS:下面两张截图都覆盖了函数名称。
1.2.1 bootgraph.html分析
从下面的图可以看出内核的初始化持续到2672ms处,然后整个内核初始化主要部分就是initcall。
同时从上面可以看出哪几个initcall占用时间较长,点击可以看到持续多久、是否成功等信息。
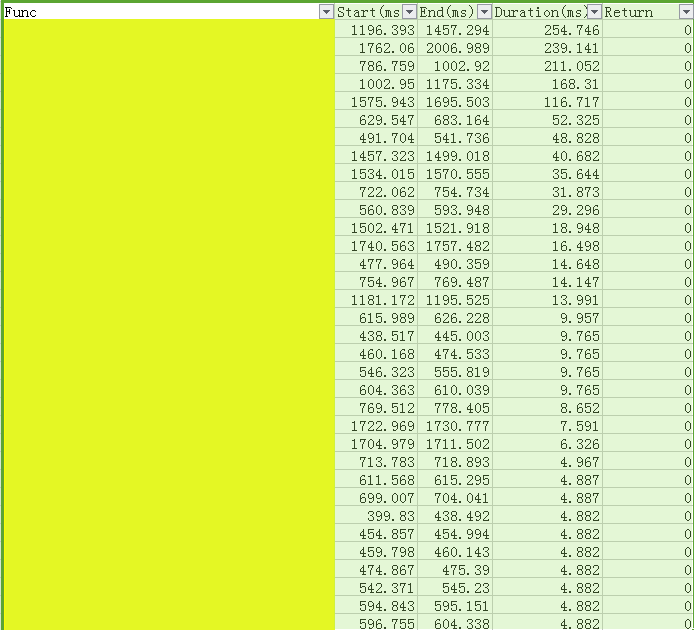
1.2.2 devinit.csv分析
相对于bootgraph.html,devinit.csv更容易进行量化。
对devinit.csv按照Duration进行降序,可以看出占用靠前的initcall。
1.3 优化实例
1.3.1 串口log优化
对于115200的串口速率来说,一个字符耗时大概1/(115200/10)=0.087ms。所以100个字符大概耗时8.7ms。
在内核初始化的时候,输出很多串口log是一件恐怖的事情。
虽然不是什么高深的技巧,但是却很有效。
1.3.1.1 初始状态
在没有打开initcall_debug,console_printk采用默认配置情况下,内核启动总共耗时2881ms。
<6>[ 2.881049] Freeing init memory: 340K
1.3.1.2 打开initcall_debug
在打开initcall_debug用于调试之后,引入了额外的开销。
但又不得不借助于initcall_debug来发现问题。
内核启动共耗时3404ms,引入了523ms开销。
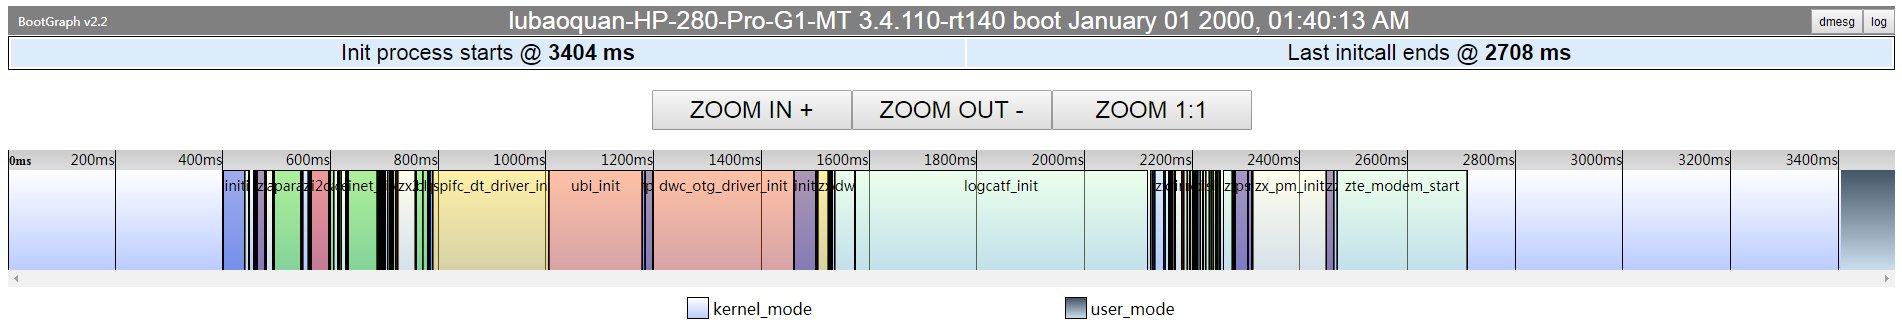
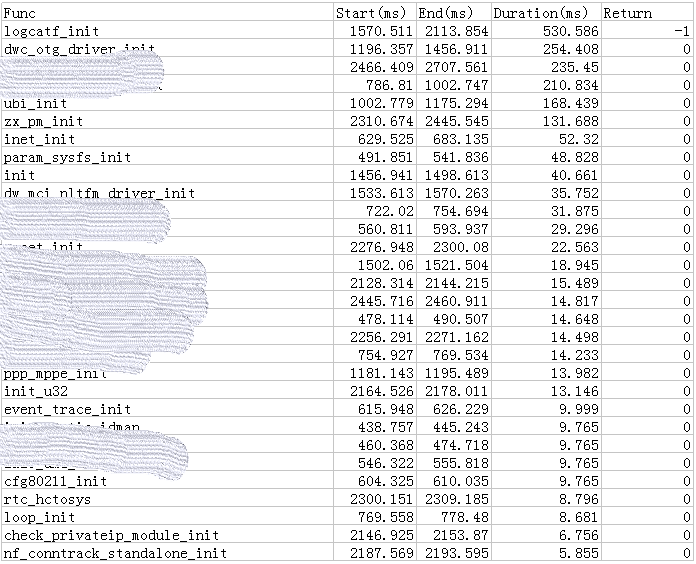
关于initcall耗时列表如下:
1.3.1.3 打开initcall_debug,关闭console显示
在关闭了console显示过后,串口被最大化的关闭。
内核共耗时1281ms,相较原始状态减少了1600ms。也就是说整个内核初始化的一大半时间被节省了。
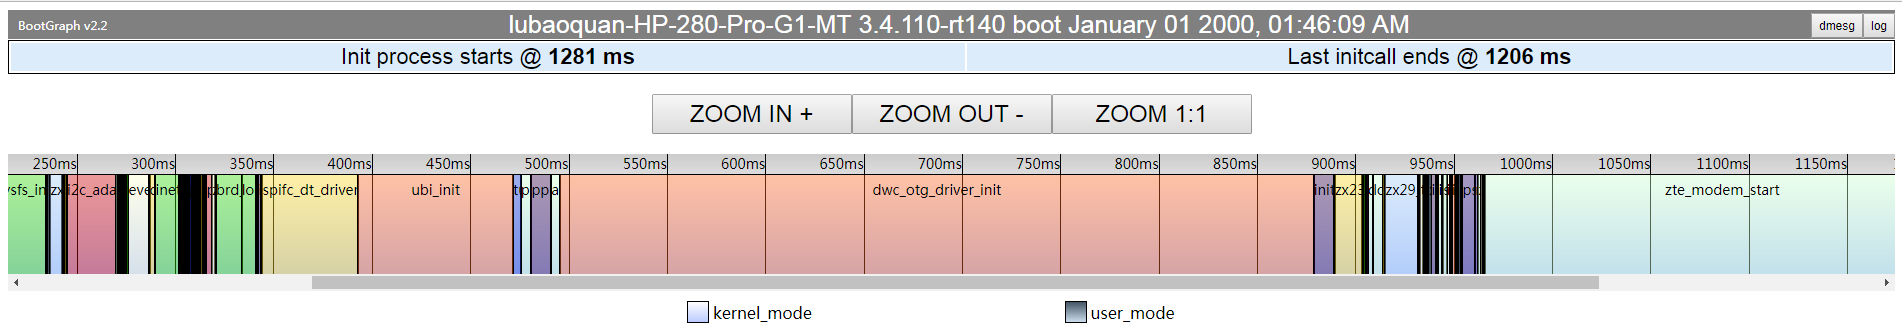
在关闭串口console之后,可以看出initcall的时间大大减少了。

1.3.2 优化耗时top10的initcall
参见上图列表,进入initcall进行优化。
2. 用户空间启动优化
用户空间的优化依赖于bootchartd获取log,然后使用pybootchart.py进行分析。
下面分几部分进行分析:如何在busybox中使能bootchartd;对bootchartd进行简单分析;对pybootchart.py进行简单分析;最后对测试结果进行分析。
2.1 使能bootchartd
要使能bootchartd,需要修改命令行参数以支持从bootchartd启动init;bootchartd本身以及tar、dmesg等支持。
2.1.1 bootloader中修改命令行参数增加
修改bootloader中传递给Linux的命令行参数,如果bootchartd放在ramfs中,使用rdinit=/sbin/bootchartd。
如果bootchartd放在非ramfs中:
init=/sbin/bootchartd
如此使用bootchartd作为init,然后再用bootchartd去启动/sbin/init。
Linux内核init_setup()函数从cmdline解析出init参数,赋给execute_command。
然后在init_post()中就会使用run_init_process()。
static int __init init_setup(char *str)
{
    unsigned int i;

    execute_command = str;------------------------------------------从cmdline中解析出init的值,赋给execute_command。
    /*
     * In case LILO is going to boot us with default command line,
     * it prepends "auto" before the whole cmdline which makes
     * the shell think it should execute a script with such name.
     * So we ignore all arguments entered _before_ init=... [MJ]
     */
    for (i = 1; i < MAX_INIT_ARGS; i++)
        argv_init[i] = NULL;
    return 1;
}
__setup("init=", init_setup);

static noinline int init_post(void)
{
...
    free_initmem();
...
    if (execute_command) {
        run_init_process(execute_command);---------------------------如果execute_command被赋值,那么作为init进程进行初始化。如果成功,后面的run_init_process()不会被执行。
        printk(KERN_WARNING "Failed to execute %s.  Attempting "
                    "defaults...\n", execute_command);
    }
    run_init_process("/sbin/init");
    run_init_process("/etc/init");
    run_init_process("/bin/init");
    run_init_process("/bin/sh");

    panic("No init found.  Try passing init= option to kernel. "
          "See Linux Documentation/init.txt for guidance.");
}
2.1.2 内核中修改busybox
内核中需要打开bootchartd选项、同时还需要支持tar,因为需要对生成的文件进行打包。
由于需要获取内核kmsg,所以需要dmesg支持。
CONFIG_FEATURE_SEAMLESS_GZ=y
CONFIG_GUNZIP=y
CONFIG_GZIP=y
CONFIG_FEATURE_GZIP_LONG_OPTIONS=y
CONFIG_TAR=y
CONFIG_FEATURE_TAR_CREATE=y
CONFIG_FEATURE_TAR_AUTODETECT=y
CONFIG_FEATURE_TAR_FROM=y
CONFIG_FEATURE_TAR_OLDGNU_COMPATIBILITY=y
CONFIG_FEATURE_TAR_OLDSUN_COMPATIBILITY=y
CONFIG_FEATURE_TAR_GNU_EXTENSIONS=y
CONFIG_FEATURE_TAR_LONG_OPTIONS=y
CONFIG_FEATURE_TAR_TO_COMMAND=y
CONFIG_FEATURE_TAR_UNAME_GNAME=y
CONFIG_FEATURE_TAR_NOPRESERVE_TIME=y
CONFIG_BOOTCHARTD=y
CONFIG_FEATURE_BOOTCHARTD_BLOATED_HEADER=y
CONFIG_DMESG=y
2.1.3 对bootchartd的调整
对bootchartd的配置可以通过指定配置文件,ENABLE_FEATURE_BOOTCHARTD_CONFIG_FILE。
或者通过修改sample_period_us和process_accounting。
int bootchartd_main(int argc, char **argv) MAIN_EXTERNALLY_VISIBLE;
int bootchartd_main(int argc UNUSED_PARAM, char **argv)
{
...
    /* Read config file: */
    sample_period_us = 200 * 1000;-----------------------------------如果觉得粒度不够,丢失细节,可以提高采样频率查看更多细节。但代价是bootchard占用更多CPU资源。
    process_accounting = 0;
    if (ENABLE_FEATURE_BOOTCHARTD_CONFIG_FILE) {
        char* token[2];
        parser_t *parser = config_open2("/etc/bootchartd.conf" + 5, fopen_for_read);
        if (!parser)
            parser = config_open2("/etc/bootchartd.conf", fopen_for_read);
        while (config_read(parser, token, 2, 0, "#=", PARSE_NORMAL & ~PARSE_COLLAPSE)) {
            if (strcmp(token[0], "SAMPLE_PERIOD") == 0 && token[1])
                sample_period_us = atof(token[1]) * 1000000;
            if (strcmp(token[0], "PROCESS_ACCOUNTING") == 0 && token[1]
             && (strcmp(token[1], "on") == 0 || strcmp(token[1], "yes") == 0)
            ) {
                process_accounting = 1;
            }
        }
        config_close(parser);
        if ((int)sample_period_us <= 0)
            sample_period_us = 1; /* prevent division by 0 */
    }
...
    return EXIT_SUCCESS;
}
2.1.4 增加meminfo、dmesg
打开对/proc/meminfo的解析,原始数据保存在proc_meminfo.log中。
同时保存内核kmsg到dmesg中。
@@ -212,6 +212,7 @@
 {
     FILE *proc_stat = xfopen("proc_stat.log", "w");
     FILE *proc_diskstats = xfopen("proc_diskstats.log", "w");
+    FILE *proc_meminfo = xfopen("proc_meminfo.log", "w");
     //FILE *proc_netdev = xfopen("proc_netdev.log", "w");
     FILE *proc_ps = xfopen("proc_ps.log", "w");
     int look_for_login_process = (getppid() == 1);
@@ -240,6 +241,7 @@

         dump_file(proc_stat, "/proc/stat");
         dump_file(proc_diskstats, "/proc/diskstats");
+        dump_file(proc_meminfo, "/proc/meminfo");
         //dump_file(proc_netdev, "/proc/net/dev");
         if (dump_procs(proc_ps, look_for_login_process)) {
             /* dump_procs saw a getty or {g,k,x}dm
@@ -306,8 +308,11 @@
     }
     fclose(header_fp);

+    system(xasprintf("dmesg >dmesg"));
+
     /* Package log files */
-    system(xasprintf("tar -zcf /var/log/bootlog.tgz header %s *.log", process_accounting ? "kernel_pacct" : ""));
+    //system(xasprintf("tar -zcf /var/log/bootlog.tgz header %s *.log", process_accounting ? "kernel_pacct" : ""));
+    system(xasprintf("tar -zcf /var/log/bootlog.tgz header dmesg %s *.log", process_accounting ? "kernel_pacct" : ""));
     /* Clean up (if we are not in detached tmpfs) */
     if (tempdir) {
         unlink("header");
@@ -315,6 +320,7 @@
         unlink("proc_diskstats.log");
         //unlink("proc_netdev.log");
         unlink("proc_ps.log");
+        unlink("dmesg");
         if (process_accounting)
             unlink("kernel_pacct");
         rmdir(tempdir);
2.2 bootchartd分析
bootchartd的入口点是bootchartd_main()函数。
在bootchartd_main中主要就是解析start/init/stop参数。如果使能bootchartd.conf的话,解析出sample_period_us和process_accounting。
bootchartd_main()主要通过do_logging()收集log和finalize()做打包收尾工作。
static void do_logging(unsigned sample_period_us, int process_accounting)
{
    FILE *proc_stat = xfopen("proc_stat.log", "w");
    FILE *proc_diskstats = xfopen("proc_diskstats.log", "w");
    FILE *proc_meminfo = xfopen("proc_meminfo.log", "w");
    //FILE *proc_netdev = xfopen("proc_netdev.log", "w");
    FILE *proc_ps = xfopen("proc_ps.log", "w");
    int look_for_login_process = (getppid() == 1);
    unsigned count = 60*1000*1000 / sample_period_us; /* ~1 minute */--------------------------最长统计1分钟时间bootchart

    if (process_accounting) {
        close(xopen("kernel_pacct", O_WRONLY | O_CREAT | O_TRUNC));
        acct("kernel_pacct");
    }

    while (--count && !bb_got_signal) {--------------------------------------------------------如果满足count为0或者bb_got_signal,则停止采样。
        char *p;
        int len = open_read_close("/proc/uptime", G.jiffy_line, sizeof(G.jiffy_line)-2);
        if (len < 0)
            goto wait_more;
        /* /proc/uptime has format "NNNNNN.MM NNNNNNN.MM" */
        /* we convert it to "NNNNNNMM\n" (using first value) */
        G.jiffy_line[len] = '\0';
        p = strchr(G.jiffy_line, '.');
        if (!p)
            goto wait_more;
        while (isdigit(*++p))
            p[-1] = *p;
        p[-1] = '\n';
        p[0] = '\0';

        dump_file(proc_stat, "/proc/stat");---------------------------------------------------保存/proc/stat到proc_stat.og中
        dump_file(proc_diskstats, "/proc/diskstats");-----------------------------------------保存/proc/diskstats到proc_diskstats.log中
        dump_file(proc_meminfo, "/proc/meminfo");---------------------------------------------保存/proc/meminfo到proc_meminfo.log中
        //dump_file(proc_netdev, "/proc/net/dev");
        if (dump_procs(proc_ps, look_for_login_process)) {------------------------------------遍历/proc下所有进程到proc_ps.log中
            /* dump_procs saw a getty or {g,k,x}dm
             * stop logging in 2 seconds:
             */
            if (count > 2*1000*1000 / sample_period_us)
                count = 2*1000*1000 / sample_period_us;
        }
        fflush_all();
 wait_more:
        usleep(sample_period_us);-------------------------------------------------------------每次采样后睡眠sample_period_us,达到周期性的目的。
    }
}
dump_procs()处理/proc目录下每个pid的stat文件。
static int dump_procs(FILE *fp, int look_for_login_process)
{
    struct dirent *entry;
    DIR *dir = opendir("/proc");
    int found_login_process = 0;

    fputs(G.jiffy_line, fp);
    while ((entry = readdir(dir)) != NULL) {------------------------------------遍历/proc目录,返回entry是struct dirent数据结构
        char name[sizeof("/proc/%u/cmdline") + sizeof(int)*3];
        int stat_fd;
        unsigned pid = bb_strtou(entry->d_name, NULL, 10);----------------------这里只取数字类型,其它目录则continue。
        if (errno)
            continue;

        /* Android's version reads /proc/PID/cmdline and extracts
         * non-truncated process name. Do we want to do that? */

        sprintf(name, "/proc/%u/stat", pid);
        stat_fd = open(name, O_RDONLY);
        if (stat_fd >= 0) {
            char *p;
            char stat_line[4*1024];
            int rd = safe_read(stat_fd, stat_line, sizeof(stat_line)-2);

            close(stat_fd);
            if (rd < 0)
                continue;
            stat_line[rd] = '\0';
            p = strchrnul(stat_line, '\n');
            *p++ = '\n';
            *p = '\0';
            fputs(stat_line, fp);----------------------------------------------保存读取的/proc/xxx/stat到fp中
            if (!look_for_login_process)
                continue;
...
        }
    }
    closedir(dir);
    fputc('\n', fp);
    return found_login_process;
}
finalize()生成header、dmesg,然后和do_logging()中生成的文件一起打包到bootlog.tgz中。
static void finalize(char *tempdir, const char *prog, int process_accounting)
{
    //# Stop process accounting if configured
    //local pacct=
    //[ -e kernel_pacct ] && pacct=kernel_pacct

    FILE *header_fp = xfopen("header", "w");

    if (process_accounting)
        acct(NULL);

    if (prog)
        fprintf(header_fp, "profile.process = %s\n", prog);

    fputs("version = "BC_VERSION_STR"\n", header_fp);
    if (ENABLE_FEATURE_BOOTCHARTD_BLOATED_HEADER) {
        char *hostname;
        char *kcmdline;
        time_t t;
        struct tm tm_time;
        /* x2 for possible localized weekday/month names */
        char date_buf[sizeof("Mon Jun 21 05:29:03 CEST 2010") * 2];
        struct utsname unamebuf;

        hostname = safe_gethostname();
        time(&t);
        localtime_r(&t, &tm_time);
        strftime(date_buf, sizeof(date_buf), "%a %b %e %H:%M:%S %Z %Y", &tm_time);
        fprintf(header_fp, "title = Boot chart for %s (%s)\n", hostname, date_buf);
        if (ENABLE_FEATURE_CLEAN_UP)
            free(hostname);

        uname(&unamebuf); /* never fails */
        /* same as uname -srvm */
        fprintf(header_fp, "system.uname = %s %s %s %s\n",
                unamebuf.sysname,
                unamebuf.release,
                unamebuf.version,
                unamebuf.machine
        );

        //system.release = `cat /etc/DISTRO-release`
        //system.cpu = `grep '^model name' /proc/cpuinfo | head -1` ($cpucount)

        kcmdline = xmalloc_open_read_close("/proc/cmdline", NULL);
        /* kcmdline includes trailing "\n" */
        fprintf(header_fp, "system.kernel.options = %s", kcmdline);
        if (ENABLE_FEATURE_CLEAN_UP)
            free(kcmdline);
    }
    fclose(header_fp);

    system(xasprintf("dmesg >dmesg"));

    /* Package log files */
    //system(xasprintf("tar -zcf /var/log/bootlog.tgz header %s *.log", process_accounting ? "kernel_pacct" : ""));
    system(xasprintf("tar -zcf /var/log/bootlog.tgz header dmesg %s *.log", process_accounting ? "kernel_pacct" : ""));
    /* Clean up (if we are not in detached tmpfs) */
    if (tempdir) {
        unlink("header");
        unlink("proc_stat.log");
        unlink("proc_diskstats.log");
        //unlink("proc_netdev.log");
        unlink("proc_ps.log");
        unlink("dmesg");
        if (process_accounting)
            unlink("kernel_pacct");
        rmdir(tempdir);
    }

    /* shell-based bootchartd tries to run /usr/bin/bootchart if $AUTO_RENDER=yes:
     * /usr/bin/bootchart -o "$AUTO_RENDER_DIR" -f $AUTO_RENDER_FORMAT "$BOOTLOG_DEST"
     */
}
2.3 pybootchart分析
pybootchart主要分为两大部分:解析和画图。
从_do_parse()中可以看出解析的数据是从哪个log文件中获取的。而这些log文件是由do_logging()从内核节点获取的。
通过_do_parse()和do_logging()两函数,就可以明白生成结果图表中数据在内核中的对应意义。
2.3.1 pybootchart解析bootload.tgz
pybootchart在解析这些log文件的时候,同时解析了从/proc/uptime获取的时间作为时间轴。
def _do_parse(writer, state, name, file):
    writer.status("parsing '%s'" % name)
    t1 = clock()
    if name == "header":
        state.headers = _parse_headers(file)
    elif name == "proc_diskstats.log":
        state.disk_stats = _parse_proc_disk_stat_log(file, get_num_cpus(state.headers))
    elif name == "taskstats.log":
        state.ps_stats = _parse_taskstats_log(writer, file)
        state.taskstats = True
    elif name == "proc_stat.log":
        state.cpu_stats = _parse_proc_stat_log(file)
    elif name == "proc_meminfo.log":
        state.mem_stats = _parse_proc_meminfo_log(file)
    elif name == "dmesg":
        state.kernel = _parse_dmesg(writer, file)
    elif name == "cmdline2.log":
        state.cmdline = _parse_cmdline_log(writer, file)
    elif name == "paternity.log":
        state.parent_map = _parse_paternity_log(writer, file)
    elif name == "proc_ps.log":  # obsoleted by TASKSTATS
        state.ps_stats = _parse_proc_ps_log(writer, file)
    elif name == "kernel_pacct": # obsoleted by PROC_EVENTS
        state.parent_map = _parse_pacct(writer, file)
    t2 = clock()
    writer.info("  %s seconds" % str(t2-t1))
    return state
2.3.2 pybootchart画图
经过__do_parse()解析的结果,在render()中进行渲染。
#
# Render the chart.
#
def render(ctx, options, xscale, trace):
    (w, h) = extents (options, xscale, trace)
    global OPTIONS
    OPTIONS = options.app_options

    proc_tree = options.proc_tree (trace)

    # x, y, w, h
    clip = ctx.clip_extents()

    sec_w = int (xscale * sec_w_base)
    ctx.set_line_width(1.0)
    ctx.select_font_face(FONT_NAME)
    draw_fill_rect(ctx, WHITE, (0, 0, max(w, MIN_IMG_W), h))
    w -= 2*off_x
    # draw the title and headers
    if proc_tree.idle:
        duration = proc_tree.idle
    else:
        duration = proc_tree.duration

    if not options.kernel_only:
        curr_y = draw_header (ctx, trace.headers, duration)
    else:
        curr_y = off_y;

    if options.charts:
        curr_y = render_charts (ctx, options, clip, trace, curr_y, w, h, sec_w)

    # draw process boxes
    proc_height = h
    if proc_tree.taskstats and options.cumulative:
        proc_height -= CUML_HEIGHT

    draw_process_bar_chart(ctx, clip, options, proc_tree, trace.times,
                   curr_y, w, proc_height, sec_w)

    curr_y = proc_height
    ctx.set_font_size(SIG_FONT_SIZE)
    draw_text(ctx, SIGNATURE, SIG_COLOR, off_x + 5, proc_height - 8)

    # draw a cumulative CPU-time-per-process graph
    if proc_tree.taskstats and options.cumulative:
        cuml_rect = (off_x, curr_y + off_y, w, CUML_HEIGHT/2 - off_y * 2)
        if clip_visible (clip, cuml_rect):
            draw_cuml_graph(ctx, proc_tree, cuml_rect, duration, sec_w, STAT_TYPE_CPU)

    # draw a cumulative I/O-time-per-process graph
    if proc_tree.taskstats and options.cumulative:
        cuml_rect = (off_x, curr_y + off_y * 100, w, CUML_HEIGHT/2 - off_y * 2)
        if clip_visible (clip, cuml_rect):
            draw_cuml_graph(ctx, proc_tree, cuml_rect, duration, sec_w, STAT_TYPE_IO)
渲染图表的主要工作在render_charts()中完成。
def render_charts(ctx, options, clip, trace, curr_y, w, h, sec_w):
    proc_tree = options.proc_tree(trace)

    # render bar legend
    ctx.set_font_size(LEGEND_FONT_SIZE)

    draw_legend_box(ctx, "CPU (user+sys)", CPU_COLOR, off_x, curr_y+20, leg_s)-----------------------CPU占用率部分
    draw_legend_box(ctx, "I/O (wait)", IO_COLOR, off_x + 120, curr_y+20, leg_s)

    # render I/O wait
    chart_rect = (off_x, curr_y+30, w, bar_h)
    if clip_visible (clip, chart_rect):
        draw_box_ticks (ctx, chart_rect, sec_w)
        draw_annotations (ctx, proc_tree, trace.times, chart_rect)
        draw_chart (ctx, IO_COLOR, True, chart_rect, \
                [(sample.time, sample.user + sample.sys + sample.io) for sample in trace.cpu_stats], \
                proc_tree, None)
        # render CPU load
        draw_chart (ctx, CPU_COLOR, True, chart_rect, \
                [(sample.time, sample.user + sample.sys) for sample in trace.cpu_stats], \
                proc_tree, None)

    curr_y = curr_y + 30 + bar_h

    # render second chart
    draw_legend_line(ctx, "Disk throughput", DISK_TPUT_COLOR, off_x, curr_y+20, leg_s)---------------磁盘吞吐率部分
    draw_legend_box(ctx, "Disk utilization", IO_COLOR, off_x + 120, curr_y+20, leg_s)

        # render I/O utilization
    chart_rect = (off_x, curr_y+30, w, bar_h)
    if clip_visible (clip, chart_rect):
        draw_box_ticks (ctx, chart_rect, sec_w)
        draw_annotations (ctx, proc_tree, trace.times, chart_rect)
        draw_chart (ctx, IO_COLOR, True, chart_rect, \
                [(sample.time, sample.util) for sample in trace.disk_stats], \
                proc_tree, None)

    # render disk throughput
    max_sample = max (trace.disk_stats, key = lambda s: s.tput)
    if clip_visible (clip, chart_rect):
        draw_chart (ctx, DISK_TPUT_COLOR, False, chart_rect, \
                [(sample.time, sample.tput) for sample in trace.disk_stats], \
                proc_tree, None)

    pos_x = off_x + ((max_sample.time - proc_tree.start_time) * w / proc_tree.duration)

    shift_x, shift_y = -20, 20
    if (pos_x < off_x + 245):
        shift_x, shift_y = 5, 40

    label = "%dMB/s" % round ((max_sample.tput) / 1024.0)
    draw_text (ctx, label, DISK_TPUT_COLOR, pos_x + shift_x, curr_y + shift_y)

    curr_y = curr_y + 30 + bar_h

    # render mem usage
    chart_rect = (off_x, curr_y+30, w, meminfo_bar_h)
    mem_stats = trace.mem_stats
    if mem_stats and clip_visible (clip, chart_rect):
        #mem_scale = max(sample.records['MemTotal'] - sample.records['MemFree'] for sample in mem_stats)
        mem_scale = max(sample.records['MemTotal'] for sample in mem_stats)
        draw_legend_box(ctx, "Mem cached (scale: %u MiB)" % (float(mem_scale) / 1024), MEM_CACHED_COLOR, off_x, curr_y+20, leg_s)
        draw_legend_box(ctx, "Used", MEM_USED_COLOR, off_x + 240, curr_y+20, leg_s)
        draw_legend_box(ctx, "Buffers", MEM_BUFFERS_COLOR, off_x + 360, curr_y+20, leg_s)
        draw_legend_line(ctx, "Swap (scale: %u MiB)" % max([(sample.records['SwapTotal'] - sample.records['SwapFree'])/1024 for sample in mem_stats]), \
                 MEM_SWAP_COLOR, off_x + 480, curr_y+20, leg_s)
        draw_legend_box(ctx, "Free", MEM_FREE_COLOR, off_x + 700, curr_y+20, leg_s)
        draw_box_ticks(ctx, chart_rect, sec_w)
        draw_annotations(ctx, proc_tree, trace.times, chart_rect)

        draw_chart(ctx, MEM_FREE_COLOR, True, chart_rect, \
               [(sample.time, sample.records['MemTotal']) for sample in trace.mem_stats], \
               proc_tree, [0, mem_scale])
        draw_chart(ctx, MEM_BUFFERS_COLOR, True, chart_rect, \
               [(sample.time, sample.records['MemTotal'] - sample.records['MemFree']) for sample in trace.mem_stats], \
               proc_tree, [0, mem_scale])
        draw_chart(ctx, MEM_CACHED_COLOR, True, chart_rect, \
               [(sample.time, sample.records['MemTotal'] - sample.records['MemFree'] - sample.records['Buffers']) for sample in trace.mem_stats], \
               proc_tree, [0, mem_scale])
        draw_chart(ctx, MEM_USED_COLOR, True, chart_rect, \
               [(sample.time, sample.records['MemTotal'] - sample.records['MemFree'] - sample.records['Buffers'] - sample.records['Cached']) for sample in trace.mem_stats], \
               proc_tree, [0, mem_scale])
        draw_chart(ctx, MEM_SWAP_COLOR, False, chart_rect, \
               [(sample.time, float(sample.records['SwapTotal'] - sample.records['SwapFree'])) for sample in mem_stats], \
               proc_tree, None)
        curr_y = curr_y + meminfo_bar_h

    return curr_y
2.3.3 bootchart进程状态分析
bootchart对进程状态分析依赖于/proc/xxx/stat节点获取的信息,包括进程开始执行时间和终止时间,以及在此过程中的状态变化。
2.3.3.1 proc/xxx/stat解读
每个进程都有自己的一系列节点,bootchart的进程状态、起始点、终止点依赖于proc/xxx/stat节点的分析。
每个sample_period_us,bootchartd就会遍历/proc目录保存其中的stat信息。
stat信息通过do_task_stat()获取相关信息。

上面是proc_ps.log部分内容,可以看出和do_task_stat()中内容对应。
这些信息在pybootchart的__parse_proc_ps_log()中进行解析。
通过start_time可以确定进程的起始时间,然后不同时间的state确定进程在bootchart中的状态,ppid可以确定进程的父子关系,在bootchart中有虚线连接。
static const struct pid_entry tid_base_stuff[] = {
...
    ONE("stat",      S_IRUGO, proc_tid_stat),
...
}

int proc_tid_stat(struct seq_file *m, struct pid_namespace *ns,
            struct pid *pid, struct task_struct *task)
{
    return do_task_stat(m, ns, pid, task, 0);
}


static int do_task_stat(struct seq_file *m, struct pid_namespace *ns,
            struct pid *pid, struct task_struct *task, int whole)
{
    unsigned long vsize, eip, esp, wchan = ~0UL;
    long priority, nice;
    int tty_pgrp = -1, tty_nr = 0;
    sigset_t sigign, sigcatch;
    char state;
    pid_t ppid = 0, pgid = -1, sid = -1;
    int num_threads = 0;
    int permitted;
    struct mm_struct *mm;
    unsigned long long start_time;
    unsigned long cmin_flt = 0, cmaj_flt = 0;
    unsigned long  min_flt = 0,  maj_flt = 0;
    cputime_t cutime, cstime, utime, stime;
    cputime_t cgtime, gtime;
    unsigned long rsslim = 0;
    char tcomm[sizeof(task->comm)];
    unsigned long flags;
...
    /* scale priority and nice values from timeslices to -20..20 */
    /* to make it look like a "normal" Unix priority/nice value  */
    priority = task_prio(task);
    nice = task_nice(task);

    /* Temporary variable needed for gcc-2.96 */
    /* convert timespec -> nsec*/
    start_time =
        (unsigned long long)task->real_start_time.tv_sec * NSEC_PER_SEC
                + task->real_start_time.tv_nsec;
    /* convert nsec -> ticks */
    start_time = nsec_to_clock_t(start_time);---------------------------------------进程的启动时间,单位是ticks。

    seq_printf(m, "%d (%s) %c", pid_nr_ns(pid, ns), tcomm, state);------------------进程的pid、名称以及状态,状态在上一小节有介绍。
    seq_put_decimal_ll(m, ' ', ppid);-----------------------------------------------父进程pid。
    seq_put_decimal_ll(m, ' ', pgid);
    seq_put_decimal_ll(m, ' ', sid);
    seq_put_decimal_ll(m, ' ', tty_nr);
    seq_put_decimal_ll(m, ' ', tty_pgrp);
    seq_put_decimal_ull(m, ' ', task->flags);
    seq_put_decimal_ull(m, ' ', min_flt);
    seq_put_decimal_ull(m, ' ', cmin_flt);
    seq_put_decimal_ull(m, ' ', maj_flt);
    seq_put_decimal_ull(m, ' ', cmaj_flt);
    seq_put_decimal_ull(m, ' ', cputime_to_clock_t(utime));--------------------------用户空间消耗时间
    seq_put_decimal_ull(m, ' ', cputime_to_clock_t(stime));--------------------------内核空间消耗时间
    seq_put_decimal_ll(m, ' ', cputime_to_clock_t(cutime));
    seq_put_decimal_ll(m, ' ', cputime_to_clock_t(cstime));
    seq_put_decimal_ll(m, ' ', priority);
    seq_put_decimal_ll(m, ' ', nice);
    seq_put_decimal_ll(m, ' ', num_threads);
    seq_put_decimal_ull(m, ' ', 0);
    seq_put_decimal_ull(m, ' ', start_time);
    seq_put_decimal_ull(m, ' ', vsize);
    seq_put_decimal_ll(m, ' ', mm ? get_mm_rss(mm) : 0);
    seq_put_decimal_ull(m, ' ', rsslim);
    seq_put_decimal_ull(m, ' ', mm ? (permitted ? mm->start_code : 1) : 0);
    seq_put_decimal_ull(m, ' ', mm ? (permitted ? mm->end_code : 1) : 0);
    seq_put_decimal_ull(m, ' ', (permitted && mm) ? mm->start_stack : 0);
    seq_put_decimal_ull(m, ' ', esp);
    seq_put_decimal_ull(m, ' ', eip);
    /* The signal information here is obsolete.
     * It must be decimal for Linux 2.0 compatibility.
     * Use /proc/#/status for real-time signals.
     */
    seq_put_decimal_ull(m, ' ', task->pending.signal.sig[0] & 0x7fffffffUL);
    seq_put_decimal_ull(m, ' ', task->blocked.sig[0] & 0x7fffffffUL);
    seq_put_decimal_ull(m, ' ', sigign.sig[0] & 0x7fffffffUL);
    seq_put_decimal_ull(m, ' ', sigcatch.sig[0] & 0x7fffffffUL);
    seq_put_decimal_ull(m, ' ', wchan);
    seq_put_decimal_ull(m, ' ', 0);
    seq_put_decimal_ull(m, ' ', 0);
    seq_put_decimal_ll(m, ' ', task->exit_signal);
    seq_put_decimal_ll(m, ' ', task_cpu(task));
    seq_put_decimal_ull(m, ' ', task->rt_priority);
    seq_put_decimal_ull(m, ' ', task->policy);
...
    seq_putc(m, '\n');
    if (mm)
        mmput(mm);
    return 0;
}
2.3.3.2 bootchart中进程状态解释
在bootchart中显示的进程状态是从每个进程的/proc/x/stat中获取并解析的。
def draw_process_bar_chart(ctx, clip, options, proc_tree, times, curr_y, w, h, sec_w):
    header_size = 0
    if not options.kernel_only:
        draw_legend_box (ctx, "Running (%cpu)", PROC_COLOR_R, off_x    , curr_y + 45, leg_s)
        draw_legend_box (ctx, "Unint.sleep (I/O)", PROC_COLOR_D, off_x+120, curr_y + 45, leg_s)
        draw_legend_box (ctx, "Sleeping", PROC_COLOR_S, off_x+240, curr_y + 45, leg_s)
        draw_legend_box (ctx, "Zombie", PROC_COLOR_Z, off_x+360, curr_y + 45, leg_s)
从/proc/x/stat中看到的状态为单字符“RSDTtZXxKW”。
这些字符和内核中task_struct->state的对应关系,可以通过如下代码确定。
static const char * const task_state_array[] = {
    "R (running)",        /*   0 */
    "S (sleeping)",        /*   1 */
    "D (disk sleep)",    /*   2 */
    "T (stopped)",        /*   4 */
    "t (tracing stop)",    /*   8 */
    "Z (zombie)",        /*  16 */
    "X (dead)",        /*  32 */
    "x (dead)",        /*  64 */
    "K (wakekill)",        /* 128 */
    "W (waking)",        /* 256 */
};

#define TASK_RUNNING        0
#define TASK_INTERRUPTIBLE    1
#define TASK_UNINTERRUPTIBLE    2
#define __TASK_STOPPED        4
#define __TASK_TRACED        8
/* in tsk->exit_state */
#define EXIT_ZOMBIE        16
#define EXIT_DEAD        32
/* in tsk->state again */
#define TASK_DEAD        64
#define TASK_WAKEKILL        128
#define TASK_WAKING        256
#define TASK_STATE_MAX        512

#define TASK_STATE_TO_CHAR_STR "RSDTtZXxKW"
所以他们之间的关系如下:
| Bootchart进程状态 | proc状态 | task_struct状态 | |
| Running | R | TASK_RUNNING | |
| Unint.sleep(I/O) | D | TASK_UNINTERRUPTIBLE | |
| Sleeping | S | TASK_INTERRUPTIBLE | |
| Zombie | Z | EXIT_ZOMBIE | |
2.3.4 bootchart对内核log分析
基于dmesg文件,_parse_dmesg()函数进行分析。
终点定义为"Freeing init memory";initcall起点为“calling”,终点为“initcall”。
2.3.5 bootchartd对meminfo分析
proc_meminfo.log如下,经过_parse_proc_meminfo_log()分析,主要提取MemTotal、MemFree、Buffers、Cached等数值。
然后在draw.py的render_charts()中绘制曲线。
MemTotal: 63436 kB
MemFree: 51572 kB
Buffers: 0 kB
Cached: 452 kB
SwapCached: 0 kB
...
SwapTotal: 0 kB
SwapFree: 0 kB
...
2.3.6 bootchart对CPU占用率分析
bootchart通过保存/proc/stat信息,来记录CPU的使用率问题。
cpu 0 0 140 16 0 0 0 0 0 0
cpu0 0 0 140 16 0 0 0 0 0 0
intr 42288 0 0 0 0 0 0 0 0 0 0 0 0 0 0 0 0 0 0 0 0 0 0 0 0 0 0 0 0 0 0 0 0 0 2 0 0 0 0 0 0 0 0 0 254 0 0 0 0 138 0 0 315 0 55 0 0 139 139 0 0 0 0 0 0 0 0 0 0 0 0 2639 0 0 0 0 0 0 0 0 0 93 0 0 0 0 0 0 0 0 0 0 0 0 0 0 105 0 0 534 0 0 0 54 0 0 0 37821 0 0 0 0 0 0 0 0 0 0 0 0 0 0 0 0 0 0 0 0 0 0 0 0 0 0 0 0 0 0 0 0 0 0 0 0 0 0 0 0 0 0 0
ctxt 10926
btime 946692305
processes 708
procs_running 2
procs_blocked 0
softirq 243 0 243 0 0 0 0 0 0 0 0
2.3.6.1 /proc/stat解析
这些信息通过内核的show_stat()获取,这里主要分析第一行数据,第一行数据是所有CPU的累加信息。
第一行的数据表示的是CPU总的使用情况,依次是:user nice system idle iowait irq softirq steal guest guest_nice。
这些数值的单位是jiffies,jiffies是内核中的一个全局变量,用来记录系统以来产生的节拍数。在Linux中,一个节拍大致可理解为操作系统进程调度的最小时间片。
这些数值的单位并不是jiffies,而是USER_HZ定义的单位。也即一单位为10ms。
# define USER_HZ    100        /* some user interfaces are */
# define CLOCKS_PER_SEC    (USER_HZ)       /* in "ticks" like times() */
user: 从系统开始累计到当前时刻,处于用户态的运行时间,包含nice值为负进程。
nice: 从系统启动开始累计到当前时刻,nice值不为负的进程所占用的CPU时间。
system: 从系统启动开始累计到当前时刻,处于核心态的运行时间,不包括中断时间。
idle: 从系统启动开始累计到当前时刻,除IO等待时间以外的其它等待时间
iowait: 从系统启动开始累计到当前时刻,IO等待时间
irq: 从系统启动开始累计到当前时刻,硬中断时间
softirq: 从系统启动开始累计到当前时刻,软中断时间
总的CPU时间=user+nice+system+idle+iowait+irq+softirq
在进行show_stat()分析之前,需要先了解kernel_cpustat和kernel_stat这两个数据结构,这两个数据结构对应的实例都是per-CPU的。
enum cpu_usage_stat {
    CPUTIME_USER,
    CPUTIME_NICE,
    CPUTIME_SYSTEM,
    CPUTIME_SOFTIRQ,
    CPUTIME_IRQ,
    CPUTIME_IDLE,
    CPUTIME_IOWAIT,
    CPUTIME_STEAL,
    CPUTIME_GUEST,
    CPUTIME_GUEST_NICE,
    NR_STATS,
};

struct kernel_cpustat {
    u64 cpustat[NR_STATS];
};

struct kernel_stat {
#ifndef CONFIG_GENERIC_HARDIRQS
       unsigned int irqs[NR_IRQS];
#endif
    unsigned long irqs_sum;
    unsigned int softirqs[NR_SOFTIRQS];
};
内核中tick中断处理函数中调用update_process_times()进行stat更新。
void update_process_times(int user_tick)
{
    struct task_struct *p = current;
    int cpu = smp_processor_id();

    account_process_tick(p, user_tick);
...
}

void account_process_tick(struct task_struct *p, int user_tick)
{
    cputime_t one_jiffy_scaled = cputime_to_scaled(cputime_one_jiffy);
    struct rq *rq = this_rq();

    if (sched_clock_irqtime) {
        irqtime_account_process_tick(p, user_tick, rq);--------------------如果irq时间需要统计,使用此函数。
        return;
    }

    if (steal_account_process_tick())--------------------------------------累积到CPUTIME_STEAL。
        return;

    if (user_tick)---------------------------------------------------------处于用户态,更新用户态统计信息。
        account_user_time(p, cputime_one_jiffy, one_jiffy_scaled);
    else if ((p != rq->idle) || (irq_count() != HARDIRQ_OFFSET))-----------非用户态,则处于内核态;此处统计非idle,或者
        account_system_time(p, HARDIRQ_OFFSET, cputime_one_jiffy,
                    one_jiffy_scaled);
    else
        account_idle_time(cputime_one_jiffy);------------------------------idle状态时间。
}

void account_user_time(struct task_struct *p, cputime_t cputime,
               cputime_t cputime_scaled)
{
    int index;

    /* Add user time to process. */
    p->utime += cputime;
    p->utimescaled += cputime_scaled;
    account_group_user_time(p, cputime);

    index = (TASK_NICE(p) > 0) ? CPUTIME_NICE : CPUTIME_USER;---------------nice大于0的进程,累积到CPUTIME_NICE;nice小于等于的进程,累积到CPUTIME_USER。

    /* Add user time to cpustat. */
    task_group_account_field(p, index, (__force u64) cputime);

    /* Account for user time used */
    acct_update_integrals(p);
}

void account_system_time(struct task_struct *p, int hardirq_offset,
             cputime_t cputime, cputime_t cputime_scaled)
{
    int index;

    if ((p->flags & PF_VCPU) && (irq_count() - hardirq_offset == 0)) {-----虚拟化环境中,累积到CPUTIME_GUEST、CPUTIME_GUEST_NICE。
        account_guest_time(p, cputime, cputime_scaled);
        return;
    }

    if (hardirq_count() - hardirq_offset)----------------------------------硬件中断中,累积到CPUTIME_IRQ。
        index = CPUTIME_IRQ;
    else if (in_serving_softirq())-----------------------------------------表示处于软中断中,累积到CPUTIME_SOFTIRQ。
        index = CPUTIME_SOFTIRQ;
    else
        index = CPUTIME_SYSTEM;--------------------------------------------内核中非idle、硬中断、软中断情况,累积到CPUTIME_SYSTEM。

    __account_system_time(p, cputime, cputime_scaled, index);
}

void account_idle_time(cputime_t cputime)
{
    u64 *cpustat = kcpustat_this_cpu->cpustat;
    struct rq *rq = this_rq();

    if (atomic_read(&rq->nr_iowait) > 0)
        cpustat[CPUTIME_IOWAIT] += (__force u64) cputime;------------------表示当前状态处于io等待,时间累积到CPUTIME_IOWAIT。
    else
        cpustat[CPUTIME_IDLE] += (__force u64) cputime;--------------------处于idle状态时间,累积到CPUTIME_IDLE。
}
关于中断信息的统计,在执行中断和软中断中有相关接口。
在每次硬中断处理中,都会调用kstat_incr_irqs_this_cpu()更新per-cpu的统计变量kernel_stat->irqs_sum,同时也更新irq_desc->kstat_irqs变量。
在软中断处理函数handle_pending_softirqs()中,更新对应软中断计数kernel_stat->softirqs[]。
#define kstat_incr_irqs_this_cpu(irqno, DESC)        \
do {                            \
    __this_cpu_inc(*(DESC)->kstat_irqs);        \
    __this_cpu_inc(kstat.irqs_sum);            \
} while (0)


static void handle_pending_softirqs(u32 pending, int cpu, int need_rcu_bh_qs)
{
    struct softirq_action *h = softirq_vec;
    unsigned int prev_count = preempt_count();

    local_irq_enable();
    for ( ; pending; h++, pending >>= 1) {
...
        kstat_incr_softirqs_this_cpu(vec_nr);
...
    }
    local_irq_disable();
}


static inline unsigned int kstat_softirqs_cpu(unsigned int irq, int cpu)
{
       return kstat_cpu(cpu).softirqs[irq];
}
内核在tick中不停地更新统计数据,然后用户空间想要知道CPU占用率,只需要解析/proc/stat文件信息。
下面就看看/proc/stat对应的函数show_stat()。
static int show_stat(struct seq_file *p, void *v)
{
    int i, j;
    unsigned long jif;
    u64 user, nice, system, idle, iowait, irq, softirq, steal;
    u64 guest, guest_nice;
    u64 sum = 0;
    u64 sum_softirq = 0;
    unsigned int per_softirq_sums[NR_SOFTIRQS] = {0};
    struct timespec boottime;

    user = nice = system = idle = iowait =
        irq = softirq = steal = 0;
    guest = guest_nice = 0;
    getboottime(&boottime);
    jif = boottime.tv_sec;

    for_each_possible_cpu(i) {------------------------------------------遍历所有possible CPU的cpustat,做累加操作。综合所有CPU给出一个统计值。可以看出下面统计和cpu_usage_stat一一对应。
        user += kcpustat_cpu(i).cpustat[CPUTIME_USER];
        nice += kcpustat_cpu(i).cpustat[CPUTIME_NICE];
        system += kcpustat_cpu(i).cpustat[CPUTIME_SYSTEM];
        idle += get_idle_time(i);
        iowait += get_iowait_time(i);
        irq += kcpustat_cpu(i).cpustat[CPUTIME_IRQ];
        softirq += kcpustat_cpu(i).cpustat[CPUTIME_SOFTIRQ];
        steal += kcpustat_cpu(i).cpustat[CPUTIME_STEAL];
        guest += kcpustat_cpu(i).cpustat[CPUTIME_GUEST];
        guest_nice += kcpustat_cpu(i).cpustat[CPUTIME_GUEST_NICE];
        sum += kstat_cpu_irqs_sum(i);-----------------------------------从启动到现在的中断数目,kernel_stat->irqs_sum。
        sum += arch_irq_stat_cpu(i);

        for (j = 0; j < NR_SOFTIRQS; j++) {-----------------------------遍历所有的softirq。
            unsigned int softirq_stat = kstat_softirqs_cpu(j, i);-------从启动到现在的软中断数目,kernel_stat->softirqs[i]。

            per_softirq_sums[j] += softirq_stat;
            sum_softirq += softirq_stat;
        }
    }
    sum += arch_irq_stat();

    seq_puts(p, "cpu ");
    seq_put_decimal_ull(p, ' ', cputime64_to_clock_t(user));
    seq_put_decimal_ull(p, ' ', cputime64_to_clock_t(nice));
    seq_put_decimal_ull(p, ' ', cputime64_to_clock_t(system));
    seq_put_decimal_ull(p, ' ', cputime64_to_clock_t(idle));
    seq_put_decimal_ull(p, ' ', cputime64_to_clock_t(iowait));
    seq_put_decimal_ull(p, ' ', cputime64_to_clock_t(irq));
    seq_put_decimal_ull(p, ' ', cputime64_to_clock_t(softirq));
    seq_put_decimal_ull(p, ' ', cputime64_to_clock_t(steal));
    seq_put_decimal_ull(p, ' ', cputime64_to_clock_t(guest));
    seq_put_decimal_ull(p, ' ', cputime64_to_clock_t(guest_nice));
    seq_putc(p, '\n');

    for_each_online_cpu(i) {-------------------------------------------下面分别处理CUP单核的统计信息。
        /* Copy values here to work around gcc-2.95.3, gcc-2.96 */
        user = kcpustat_cpu(i).cpustat[CPUTIME_USER];
        nice = kcpustat_cpu(i).cpustat[CPUTIME_NICE];
        system = kcpustat_cpu(i).cpustat[CPUTIME_SYSTEM];
        idle = get_idle_time(i);
        iowait = get_iowait_time(i);
        irq = kcpustat_cpu(i).cpustat[CPUTIME_IRQ];
        softirq = kcpustat_cpu(i).cpustat[CPUTIME_SOFTIRQ];
        steal = kcpustat_cpu(i).cpustat[CPUTIME_STEAL];
        guest = kcpustat_cpu(i).cpustat[CPUTIME_GUEST];
        guest_nice = kcpustat_cpu(i).cpustat[CPUTIME_GUEST_NICE];
        seq_printf(p, "cpu%d", i);
        seq_put_decimal_ull(p, ' ', cputime64_to_clock_t(user));
        seq_put_decimal_ull(p, ' ', cputime64_to_clock_t(nice));
        seq_put_decimal_ull(p, ' ', cputime64_to_clock_t(system));
        seq_put_decimal_ull(p, ' ', cputime64_to_clock_t(idle));
        seq_put_decimal_ull(p, ' ', cputime64_to_clock_t(iowait));
        seq_put_decimal_ull(p, ' ', cputime64_to_clock_t(irq));
        seq_put_decimal_ull(p, ' ', cputime64_to_clock_t(softirq));
        seq_put_decimal_ull(p, ' ', cputime64_to_clock_t(steal));
        seq_put_decimal_ull(p, ' ', cputime64_to_clock_t(guest));
        seq_put_decimal_ull(p, ' ', cputime64_to_clock_t(guest_nice));
        seq_putc(p, '\n');
    }
    seq_printf(p, "intr %llu", (unsigned long long)sum);------------------所有CPU的硬中断计数。

    /* sum again ? it could be updated? */
    for_each_irq_nr(j)
        seq_put_decimal_ull(p, ' ', kstat_irqs_usr(j));-------------------再次遍历所有硬件中断描述符,打印中断执行次数。

    seq_printf(p,
        "\nctxt %llu\n"
        "btime %lu\n"
        "processes %lu\n"
        "procs_running %lu\n"
        "procs_blocked %lu\n",
        nr_context_switches(),-------------------------------------------所有核的进程切换统计和。
        (unsigned long)jif,
        total_forks,
        nr_running(),----------------------------------------------------正在运行的进程数目。
        nr_iowait());----------------------------------------------------处于io等待状态的进程数目。

    seq_printf(p, "softirq %llu", (unsigned long long)sum_softirq);------所有软中断计数。

    for (i = 0; i < NR_SOFTIRQS; i++)
        seq_put_decimal_ull(p, ' ', per_softirq_sums[i]);----------------单个软中断计数,依次是HI_SOFTIRQ,TIMER_SOFTIRQ,NET_TX_SOFTIRQ,NET_RX_SOFTIRQ,BLOCK_SOFTIRQ,BLOCK_IOPOLL_SOFTIRQ,TASKLET_SOFTIRQ,SCHED_SOFTIRQ,HRTIMER_SOFTIRQ,RCU_SOFTIRQ。
    seq_putc(p, '\n');

    return 0;
}
从_parse_proc_stat_log()可以看出,bootchart统计的时间。
由于/proc/stat是累加时间,所以下一次时间统计需要减去上次统计值。
在bootchart图表中,CPU=user+system,所以将内核时间分为三类,和内核时间的关系如下。
CPU=user+nice+system+irq+softirq,iowait=iowait,剩余部分为idle。因为都是tick为单位,所以这个占用率也是粗略的。
def _parse_proc_stat_log(file):
    samples = []
    ltimes = None
    for time, lines in _parse_timed_blocks(file):
        # skip emtpy lines
        if not lines:
            continue
        tokens = lines[0].split()
        if len(tokens) < 8:
            continue
        # CPU times {user, nice, system, idle, io_wait, irq, softirq}
        times = [ int(token) for token in tokens[1:] ]
        if ltimes:
            user = float((times[0] + times[1]) - (ltimes[0] + ltimes[1]))----------------------------------bootchart的user时间包括内核的user+nice
            system = float((times[2] + times[5] + times[6]) - (ltimes[2] + ltimes[5] + ltimes[6]))---------bootchart的system时间包括内核的system+irq+softirq
            idle = float(times[3] - ltimes[3])-------------------------------------------------------------bootchart的idle等于内核的idle
            iowait = float(times[4] - ltimes[4])-----------------------------------------------------------bootchart的iowait等于内核的iowait

            aSum = max(user + system + idle + iowait, 1)
            samples.append( CPUSample(time, us er/aSum, system/aSum, iowait/aSum) )

        ltimes = times
        # skip the rest of statistics lines
    return samples
2.4 测试结果分析
开机的时候bootchartd已经运行起来了,可以在shell中运行如下命令停止bootchartd。
bootchartd stop
在/var/log中生成bootlog.tgz文件,一个典型的bootlog.tgz包含如下文件。
如下命令进入interactive模式,如果不带-i则生成一张png图片。
./pybootchartgui.py bootlog/bootlog.tgz --show-all -i
2.4.1 kernel boot
如果bootlog.tgz中包含了dmesg文件,就会生成k-boot相关信息。
可以很粗略的看出kernel boot占用的总时间,以及占用比较大的initcall。

更详细的initcall以阶梯形式在Kernel boot中展示,阶梯的长度和initcall时长成正比。
但这两种形式都不如bootgraph.html展示的更有效。

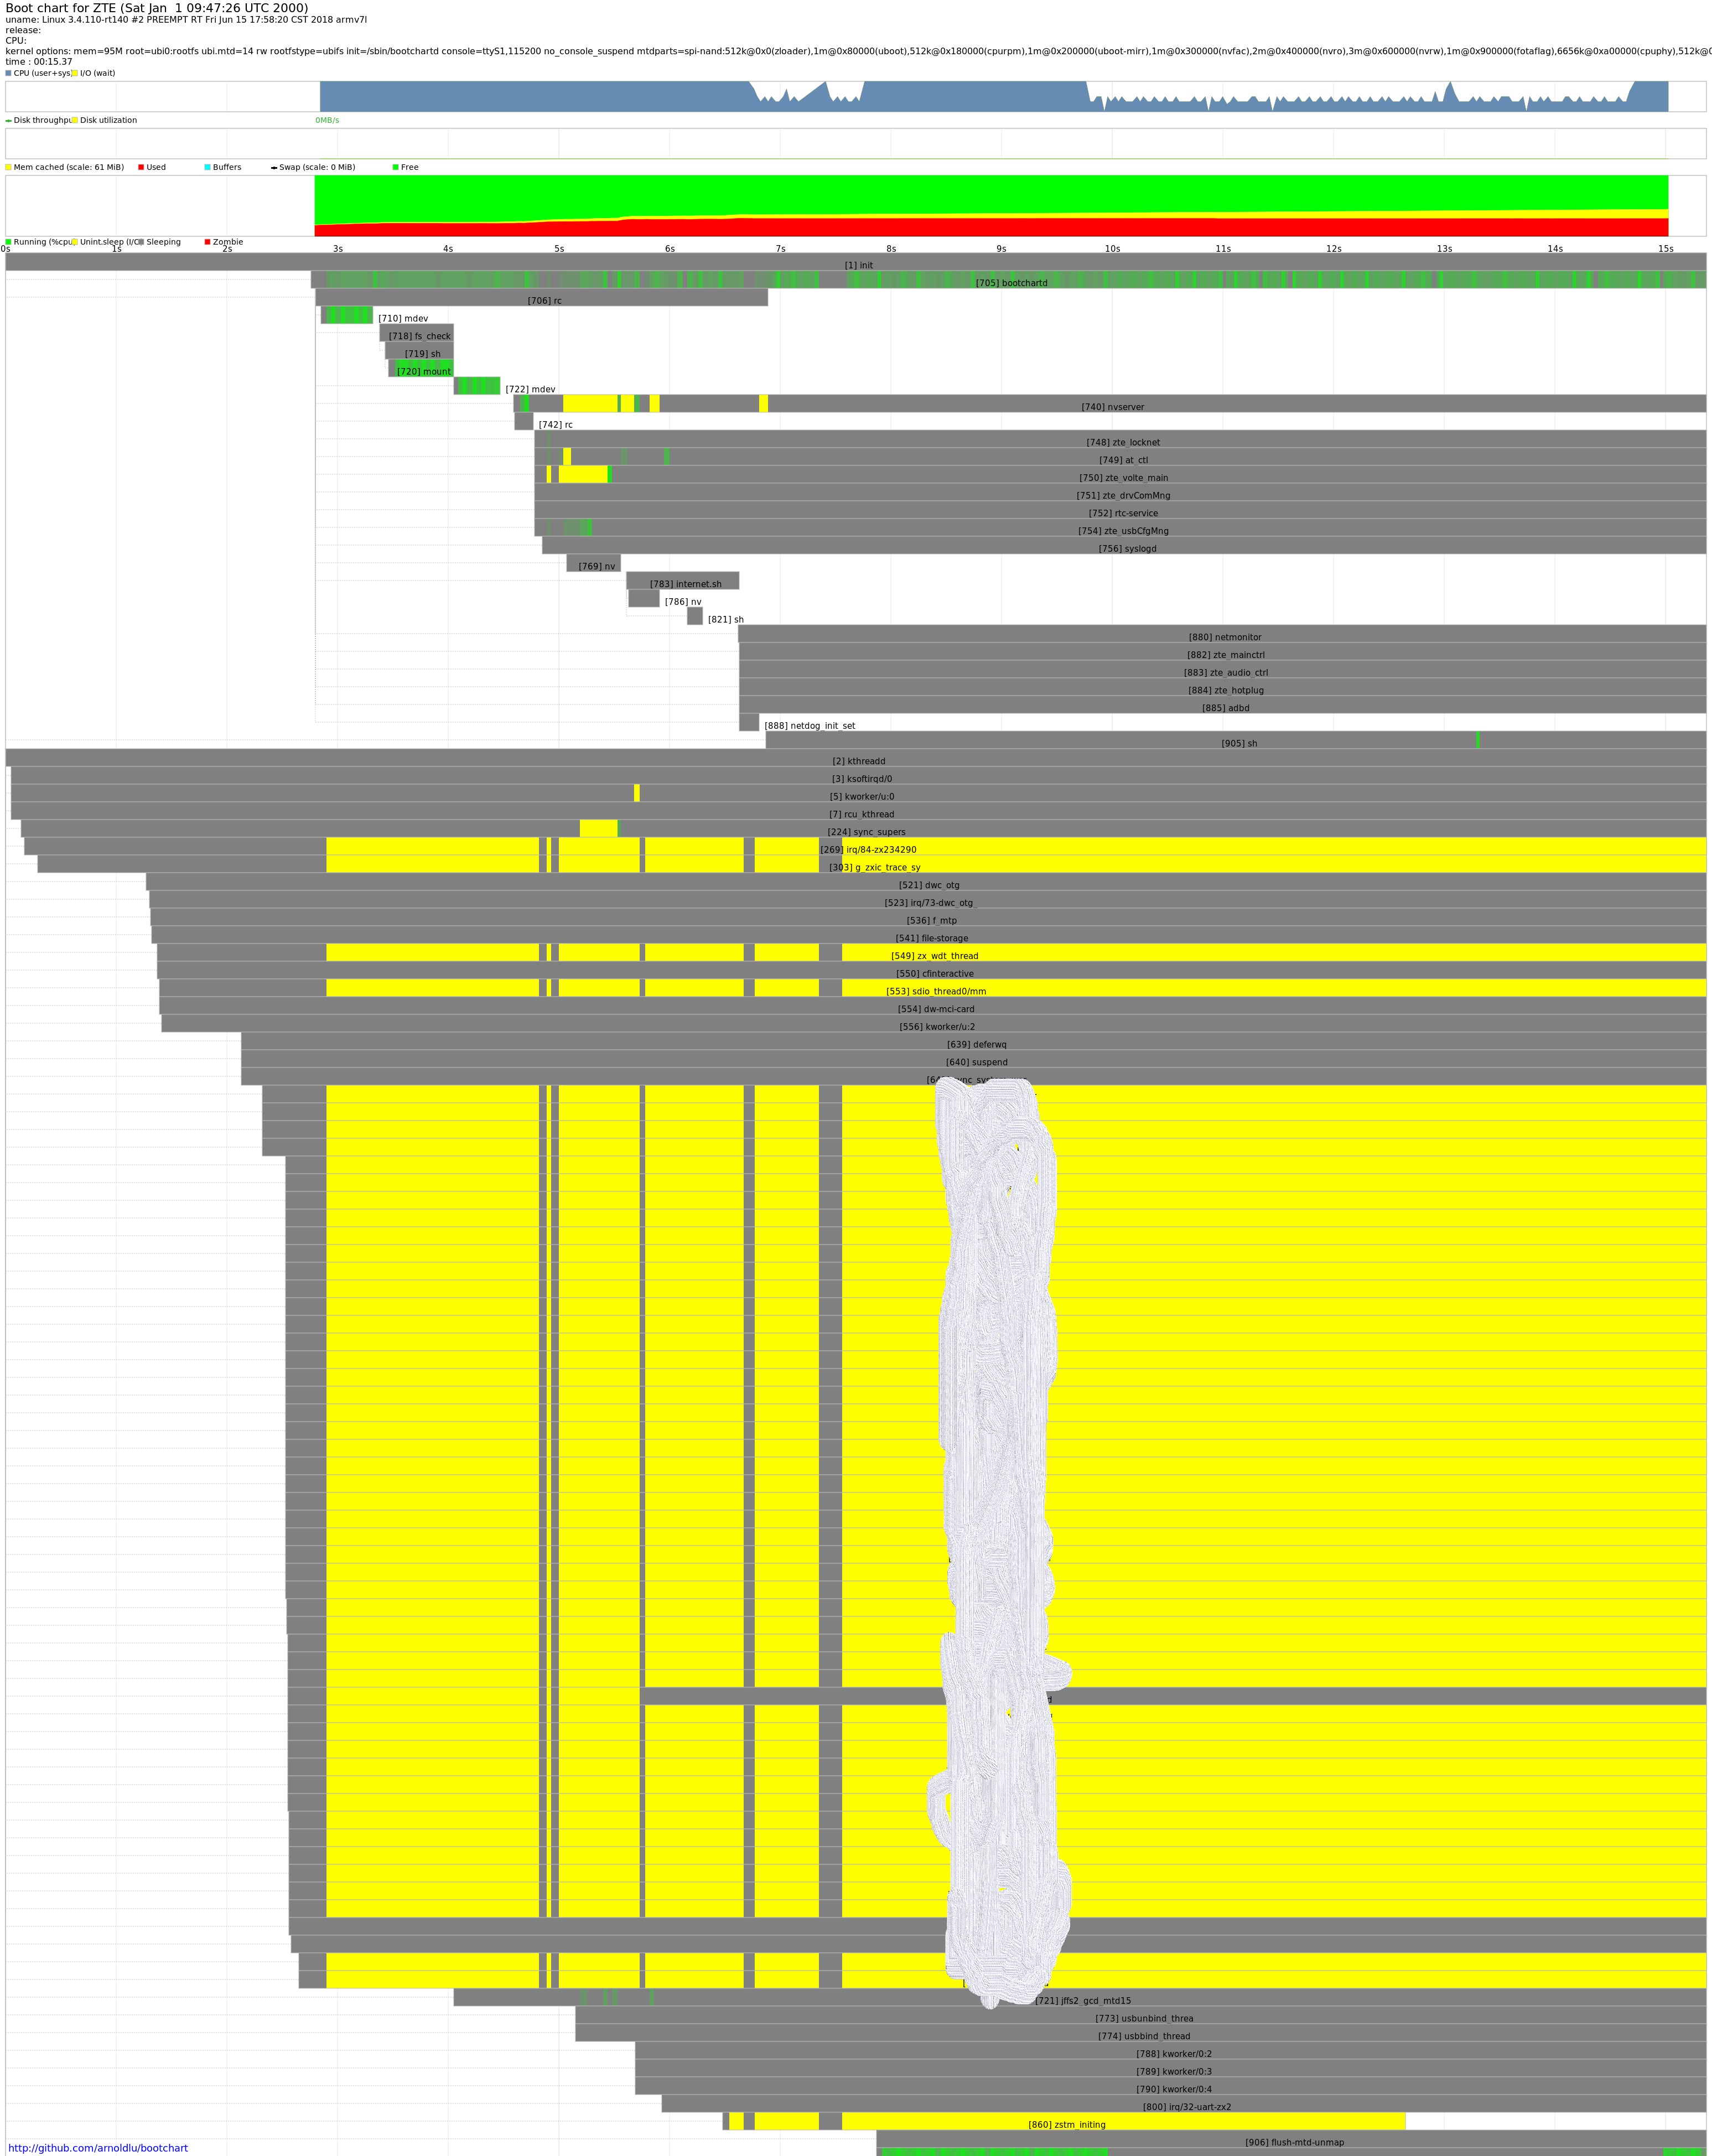
2.4.2 用户空间进程启动分析
下图可以分为5部分:
头信息:包含内核uname信息,内核command line。主要从header中获取。
CPU占用率:分为三部分CPU占用率、I/O占用率、剩下的是idle部分。主要从proc_stat.log中获取。
磁盘信息:磁盘的吞吐率和饱和度。主要从proc_diskstats.log中获取。
内存信息:分为5部分使用中、cached、buffer、swap以及剩余内存。主要从proc_meminfo.log中获取。
进程信息:包含进程的父子关系、启动时间、终止时间、运行状态等信息。主要从pro_ps.log中获取。
从下一张图可以看出主要问题在:
- 由于内核实时进程太多,导致rc启动延迟。
- internet.sh启动延迟太多。
- g_xxxx_trace_sy进程延迟问题。
- VpLoopThread延迟问题。
3. 总结
借助图形化的工具有利于发现问题,但解决问题还需要取具体问题具体对待。
Linux的启动从进入内核那一刻开始,到用户空间达到可用状态。
这个可用状态定义可能不一致,有的是进入shell,有的是弹出登陆框。但只要有一个固定的终点,就有了优化目标。
使用bootgraph.py进行优化,因为测试log本身会引入一些负荷,再找出问题点优化之后,关闭相关log。再和原始状态对比,比较准确。
在使用bootchart进行优化,需要根据实际情况适配采样时间。
如果采样率高,会导致额外负荷增加很多,因为CPU占用率、磁盘吞吐率、内存使用以及进程状态都是通过周期采样的得来的。
如果采样率太低,可能一些进程在采样周期内就启动-执行-退出了,不会被采样到。


 浙公网安备 33010602011771号