matplotlib之matplotlib.pyplot.grid(b=None, which='major', axis='both', **kwargs)显示网格
matplotlib 中的 grid 函数用于在图表上添加网格线
grid 函数
matplotlib.pyplot.grid(b=None, which='major', axis='both', **kwargs)
b: 布尔值,表示是否显示网格。如果为True,则显示网格;如果为False,则不显示。默认为None,即根据下面的其他参数自动判断是否显示网格。which: 字符串,表示要绘制的网格的类型。可以是'major'(主要刻度)、'minor'(次要刻度)或'both'(同时绘制主要和次要刻度的网格)。axis: 字符串,表示在哪个轴上绘制网格。可以是'both'(默认,绘制在 x 和 y 轴上)、'x'(只在 x 轴上绘制)、'y'(只在 y 轴上绘制)。**kwargs: 其他关键字参数,用于控制网格线的样式、颜色等属性。eg:alpha=0.5 透明度
grid 函数示例
import matplotlib.pyplot as plt

# 数据
x = [1, 2, 3, 4, 5]
y = [10, 20, 15, 25, 30]

# 绘制图表
plt.plot(x, y)

# 添加网格线
plt.grid(True, which='both', linestyle='--', color='gray', linewidth=0.5)

# 显示图表
plt.show()
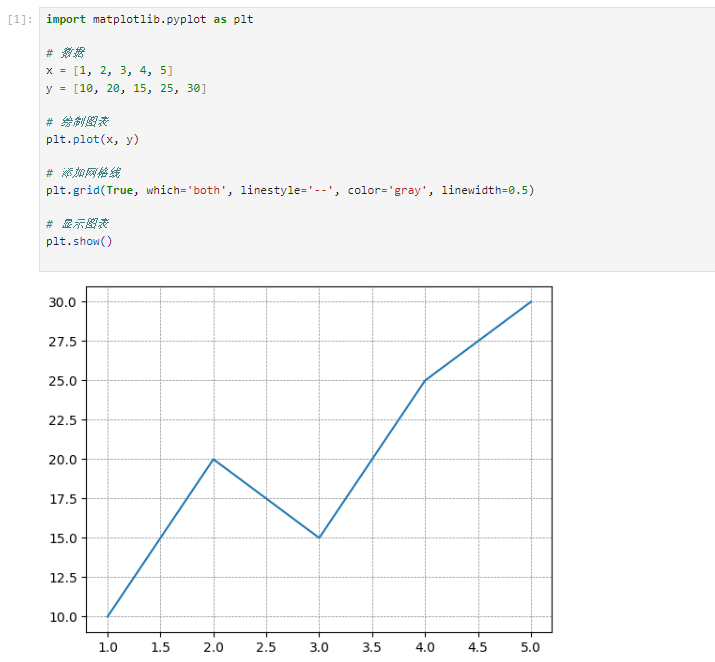
在这个示例中,我们首先用 plt.plot() 绘制了一条折线图,然后使用 plt.grid() 添加了网格线。参数设置如下:
True: 表示显示网格线。which='both': 表示同时绘制主要刻度和次要刻度的网格线。linestyle='--': 设置网格线的样式为虚线。color='gray': 设置网格线的颜色为灰色。linewidth=0.5: 设置网格线的宽度为 0.5。
最后,使用 plt.show() 显示图表,此时图表上将显示网格线。


 浙公网安备 33010602011771号