


[Python]使用python的工具箱做数字滤波器设计和频域分析
 1 # -*- coding: utf-8 -*-
 2 """
 3 Spyder Editor
 4
 5 This is a temporary script file.
 6 """
 7
 8 import matplotlib.pyplot  as plt
 9 import scipy as sci
10 import numpy as np
11
12
13
14 plt.rcParams['font.sans-serif']=['SimHei'] #用来正常显示中文标签
15 plt.rcParams['axes.unicode_minus']=False #用来正常显示负号
16
17
18 fs = 200; #采样频率
19 f1 = 10;  #信号分量1频率
20 f2 = 20;  #信号分量2频率
21 f3 = 30;  #信号分量3频率
22 f4 = 40;  #信号分量1频率
23 n  = np.arange(100)/fs; #采样点
24
25 # 生成信号
26 yn = [20*np.sin(2*np.pi*f1*i) + 10*np.sin(2*np.pi*f2*i) + 5*np.sin(2*np.pi*f3*i) + 20*np.sin(2*np.pi*f4*i) for i in n];
27
28
29
30 # fft分析原始信号
31 fft_result_abs1 = np.abs(sci.fft(yn))*2/len(n);
32 f_idx = np.arange(len(n))*fs/len(n);
33
34 # 滤波器设计和滤波
35 (b,a) = sci.signal.butter(N=5,Wn=(15),btype='lowpass',output='ba',fs=200); #生成低通滤波器参数
36 #print(b)
37 #print(a)
38 yn_filtered = sci.signal.filtfilt(b,a,yn); #滤波器
39 # fft分析滤波后的信号
40 fft_result_abs2 = np.abs(sci.fft(yn_filtered))*2/len(n);
41
42
43
44 # 画图
45 plt.close('all');
46 plt.figure();
47 plt.subplot(2,2,1);
48 plt.plot(n,yn);
49 plt.title(U'原始时域信号');
50 plt.subplot(2,2,2);
51 plt.plot(f_idx[range(int(len(n)/2))],fft_result_abs1[range(int(len(n)/2))]);
52 plt.title(U'原始信号频域分析');
53
54 plt.subplot(2,2,3);
55 plt.plot(n,yn_filtered);
56 plt.title(U'低通滤波后时域信号');
57
58
59 plt.subplot(2,2,4);
60 plt.plot(f_idx[range(int(len(n)/2))],fft_result_abs2[range(int(len(n)/2))]);
61 plt.title(U'低通滤波信号频域分析');
62
63
64 plt.figure();
65 (w,h) = sci.signal.freqs(b,a);
66 #plt.plot(w, 20 * np.log10(abs(h)))     #绘制幅频响应,频率轴取对数,幅度轴转换成dB。
67
68 plt.plot(w, abs(h))
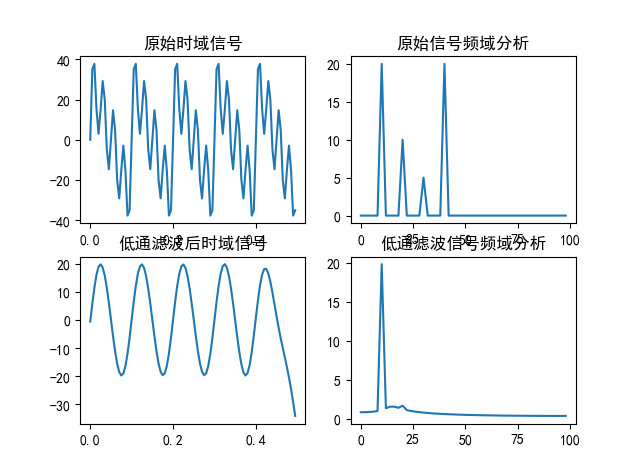
图片显示:
Ref:
https://blog.csdn.net/qq7835144/article/details/88838537
https://segmentfault.com/a/1190000005144275
~不再更新,都不让我写公式,博客园太拉胯了

 浙公网安备 33010602011771号