


matplotlib制图——直方图
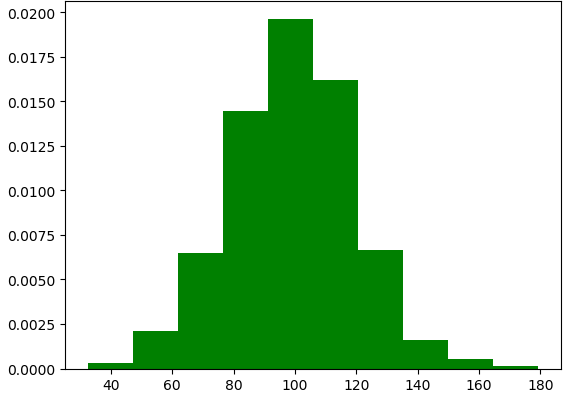
直方图 ——个变量
import numpy as np
import  pandas as pd
import matplotlib.pyplot as plt
mu=100 #均值100
sigma = 20 #标准差20
x = mu +sigma*np.random.randn(2000)
plt.hist(x,bins=10,color='g',normed=True) #bins 分组 normed=True 标准化
plt.show()
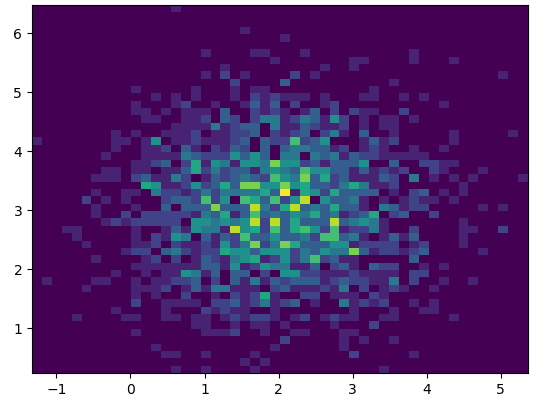
直方图——两个变量
import numpy as np
import  pandas as pd
import matplotlib.pyplot as plt
x=np.random.randn(2000)+2
y=np.random.randn(2000)+3
plt.hist2d(x,y,bins=50)
plt.show()
posted on 2017-12-16 18:30 alimin1987 阅读(282) 评论(0) 收藏 举报

 浙公网安备 33010602011771号