python 并发请求(设定吞吐量)
需求是,每秒发起请求(异步)
前提,压测接口,response time 为3-5秒
 1 from flask import Flask
 2 import random
 3 import time
 4
 5 app = Flask(__name__)
 6
 7
 8 @app.route('/')
 9 def hello_world():
10     return 'Hello, World!'
11
12
13 @app.route('/time', methods=['POST', 'GET'])
14 def atime():
15     a = random.randint(3, 5)
16     time.sleep(a)
17     s = 'time ---->' + str(a)
18     if a == 5:
19         s = 1 / 0
20     return s
21
22
23 if __name__ == '__main__':
24     app.run()
请求地址:http://127.0.0.1:5000/time
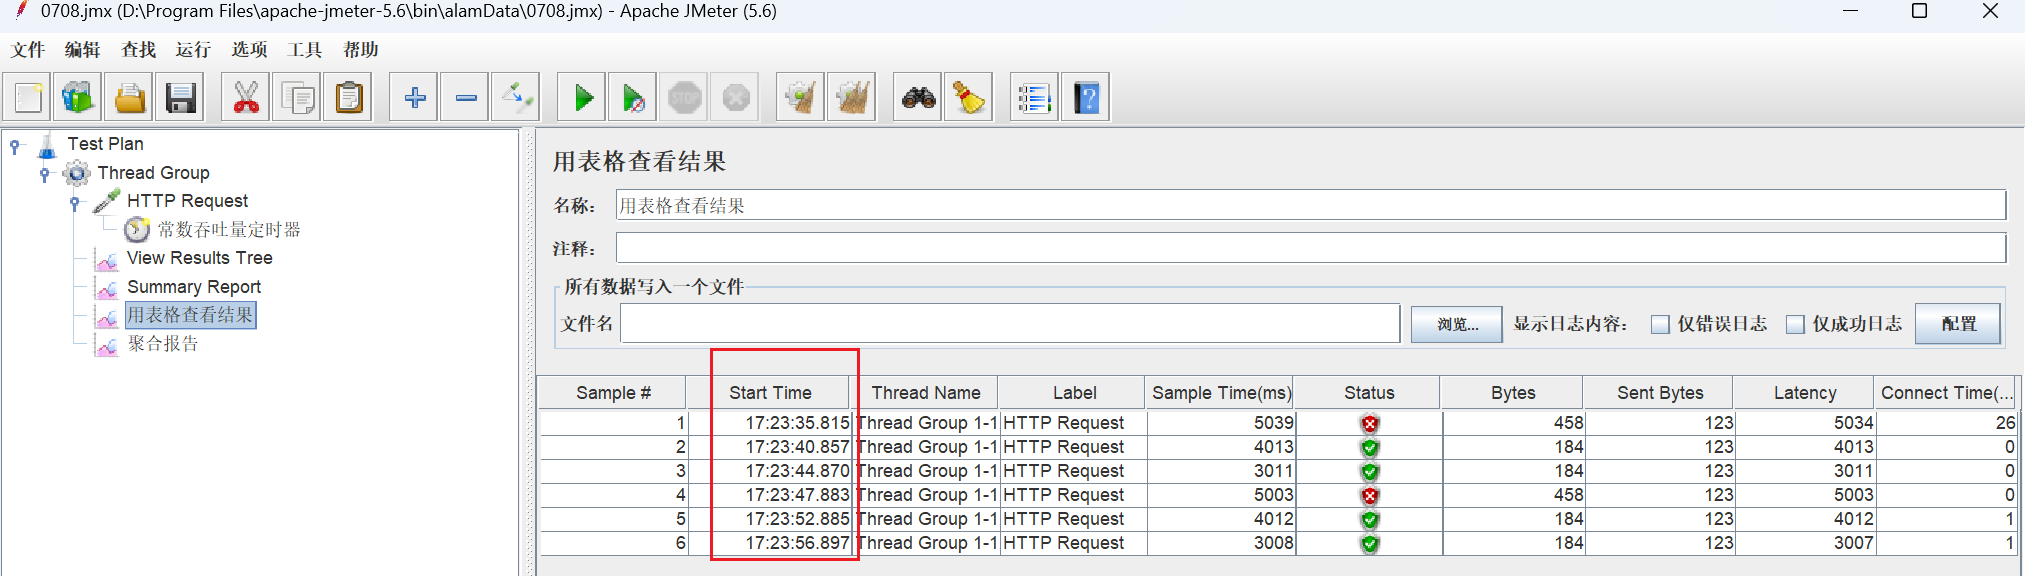
1.尝试使用jmeter压测,发现只能做到同步(获得结果后再发起请求)
2.python实现
#!/usr/bin/env python
# -*- coding:utf-8 -*-

from threading import Thread
import requests
# import matplotlib.pyplot as plt
import datetime
import time
import numpy as np
import json


class ThreadTest(Thread):
    def __init__(self, func, args=()):
        '''
      :param func: 被测试的函数
      :param args: 被测试的函数的返回值
      '''
        super(ThreadTest, self).__init__()
        self.func = func
        self.args = args

    def run(self) -> None:
        self.result = self.func(*self.args)

    def getResult(self):
        try:
            return self.result
        except BaseException as e:
            return e.args[0]


def baiDu(url, code, seconds):
    '''
   :param code: 状态码
   :param seconds: 请求响应时间
   :return:
   '''
    r = requests.get(url=url)
    code = r.status_code
    seconds = r.elapsed.total_seconds()
    return code, seconds


def calculationTime(startTime, endTime):
    '''计算两个时间之差,单位是秒'''
    return (endTime - startTime).seconds + (endTime - startTime).days*24*60*60


def getResult(seconds):
    '''获取服务端的响应时间信息'''
    data = {
        'Max': sorted(seconds)[-1],
        'Min': sorted(seconds)[0],
        'Median': np.median(seconds),
        '99%Line': np.percentile(seconds, 99),
        '95%Line': np.percentile(seconds, 95),
        '90%Line': np.percentile(seconds, 90)
    }
    return data


def highConcurrent(url, count, countPerS):
    '''
   对服务端发送高并发的请求
   :param cout: 并发数
   :return:
   '''
    global throughput
    startTime = datetime.datetime.now()
    sum = 0
    list_count = list()
    tasks = list()
    results = list()
    # 失败的信息
    fails = []
    # 成功任务数
    success = []
    codes = list()
    seconds = list()

    for i in range(int(count)):
        # DispatchIDS = ['CMA01', 'DAA03', 'MPL0A', 'DCA01', 'CUE0A', 'DKA03', 'DRA51', 'MAA01', 'RAA52', 'WHJ02']
        # import random
        # DispatchID = random.choice(DispatchIDS)
        # DispatchID = DispatchIDS[i % 10]
        # url = 'http://10.50.45.240:8080/rtd/92?DispatchID=' + DispatchID
        import random
        alamRandint = random.randint(3,5)
        url = "http://127.0.0.1:5000/time/"+ str(alamRandint)
        t = ThreadTest(baiDu, args=(url, i, i))
        tasks.append(t)
        t.start()
        print(datetime.datetime.now())
        time.sleep(1 / countPerS)


    for t in tasks:
        t.join()
        if t.getResult()[0] != 200:
            fails.append(t.getResult())
        results.append(t.getResult())

    for item in results:
        codes.append(item[0])
        seconds.append(item[1])
    for i in range(len(codes)):
        list_count.append(i)

    # 生成可视化的趋势图
    # fig, ax = plt.subplots()
    # ax.plot(list_count, seconds)
    # ax.set(xlabel='number of times', ylabel='Request time-consuming',
    #        title='olap continuous request response time (seconds)')
    # ax.grid()
    # fig.savefig('olap.png')
    # plt.show()
    # print("seconds ==",seconds)
    # print("list_count ==", list_count)
    # print("fails ==", fails) #[]
    # print("success ==",success) #[]
    # print("results ==", results)

    for i in seconds:
        # print('i', i)
        # print('type(i)', type(i))
        if type(i) == type(1.0):
            sum += i
        else:
            sum += 0
            # len(list_count)-len(fails)
    # print('sum', sum)
    # print("len(list_count)", len(list_count))
    rate = sum / len(list_count)
    endTime = datetime.datetime.now()
    # print('\n总共持续时间:\n',endTime-startTime)
    totalTime = calculationTime(startTime=startTime, endTime=endTime)
    # print('totalTime', totalTime)
    if totalTime < 1:
        totalTime = 1
    # 吞吐量的计算
    try:
        print("float(len(list_count) ", float(len(list_count)))
        print("totalTime", totalTime)
        throughput = float(len(list_count) / totalTime)
    except Exception as e:
        print(e.args[0])
    getResult(seconds=seconds)
    errorRate = 0
    if len(fails) == 0:
        errorRate = 0.00
    else:
        errorRate = len(fails) / len(tasks) * 100
    throughput = str(throughput) + '/S'
    timeData = getResult(seconds=seconds)
    dict1 = {
        '吞吐量(tps)': throughput,
        '平均响应时间(s)': rate,
        '响应时间(s)': timeData,
        '请求总数': len(list_count),
        '错误数': len(fails),
        '错误率(%)': errorRate,
        '执行时间(s)': totalTime
    }
    return json.dumps(dict1, indent=True, ensure_ascii=False)


if __name__ == '__main__':
    DispatchIDS = ['CMA01', 'DAA03', 'MPL0A', 'DCA01', 'CUE0A', 'DKA03', 'DRA51', 'MAA01', 'RAA52', 'WHJ02']
    url = 'http://10.50.45.240:8080/rtd/92?DispatchID='

    days = 1
    hours = 1
    minutes = 1
    seconds = 10
    countPerS = 1  # 每秒请求数量<br>

    counts = days * 24 * 60 * 60 + hours * 60 * 60 + minutes * 60 + seconds
    counts = counts * countPerS
    # print(counts)
    print(highConcurrent(url=url, count=counts, countPerS=countPerS))

'''
2023-07-11 11:30:54.941397
2023-07-11 11:30:55.455986
....
2023-07-11 11:31:24.244365
2023-07-11 11:31:24.750616
{
 "吞吐量(tps)": "1.8181818181818181/S",
 "平均响应时间(s)": 3.963214083333334,
 "响应时间(s)": {
  "Max": 5.02367,
  "Min": 3.005881,
  "Median": 4.009576,
  "99%Line": 5.01937067,
  "95%Line": 5.013791149999999,
  "90%Line": 5.0105454
 },
 "请求总数": 60,
 "错误数": 0,
 "错误率(%)": 0.0,
 "执行时间(s)": 33
}

nohup python my.py >> my.log 2>&1 &
# 等价于下面两行的内容
nohup python my.py 1>> my.log &
nohup python my.py 2>> my.log &
'''
返回结果如下
2023-07-08 16:24:48.524257
2023-07-08 16:24:49.027055
2023-07-08 16:24:49.539939
.......
2023-07-08 17:25:57.709663
2023-07-08 17:25:58.225109

{
 "吞吐量(tps)": "1.9599782194391506/S",
 "平均响应时间(s)": 4.006165397416303,
 "响应时间(s)": {
  "Max": 5.036263,
  "Min": 3.002034,
  "Median": 4.009866,
  "99%Line": 5.01809934,
  "95%Line": 5.0155911,
  "90%Line": 5.0130394
 },
 "请求总数": 7199,
 "错误数": 2368,
 "错误率(%)": 32.893457424642314,
 "执行时间(s)": 3673
}

Process finished with exit code 0
运行方式(后台运行,实时查看数据)
nohup python -u alamThreadRequests.py >> alam0712.log 2>&1 &

tail -f alam0712.log

 浙公网安备 33010602011771号