VUE ECharts人际关系图
1. 概述
1.1 说明
项目中需要对某个人的人际关系进行展示,故使用echarts中的关系图进行处理此需求。
2. 代码
2.1 代码示例
<template>
  <div class="echartLayout">
    <div id="container" style="width:100%; height:100%; overflow:hidden;"></div>
  </div>
</template>

<script>
  import echarts from 'echarts'
  import imgSrc from '../../assets/img/echar_person.png'
  export default {
    name: "personRelation",
    data() {
      return {
        myChart: null,
        chartData:[],
        chartLink:[]
      }
    },
    mounted() {
      this.initEchart()
    },
    methods: {
      initEchart() {
        let dom = document.getElementById("container");
        this.myChart = echarts.init(dom);
        this.chartData=this.dataEChart();
        this.chartLink=this.linkEChart();
        let option = {
          tooltip:{
            show:false
          },
          series: [
            {
              edgeLabel: {
                normal: {
                  formatter:"{c}",
                  show:true
                }
              },
              edgeSymbol:'circle',
              force:{
                repulsion:2000
              },
              layout:'force',
              roam:true,
              itemStyle:{
                normal:{
                  color: '#6495ED'
                },
                //鼠标放上去有阴影效果
                emphasis: {
                  shadowColor: '#3721db',
                  shadowOffsetX: 0,
                  shadowOffsetY: 0,
                  shadowBlur: 40,
                },
              },
              label:{
                normal:{
                  show:true
                }
              },
              //头像
              symbol: `image://${imgSrc}`,
              symbolSize:86,
              type:'graph',
              links: this.chartLink,
              data:this.chartData
            }
          ]
        };
        this.myChart.setOption(option);
        this.myChart.on('click', function (params) {
          console.log(params.data)//获取点击的头像的数据信息
        });
      },
      /**
       * 数据集合
       */
      dataEChart(){
        let data = [
          {
            name: '张1',
            symbolSize: 76,
            id: '1',
          },
          {
            name: '张2',
            id: '2',
          },
          {
            name: '张3',
            id: '3',
          },
          {
            name: '张4',
            id: '4',
          },
          {
            name: '张5',
            id: '5',
          },
          {
            name: '张6',
            id: '6',
          },
          {
            name: '张7',
            id: '7',
          },
          {
            name: '张6',
            id: '8',
          },
        ];
        return data;
      },
      /**
       * 关系数据集合
       */
      linkEChart(){
        let dataLink=[
          {value: "同事",source: "1",target: "2"},
          {value: "同事",source: "1",target: "3"},
          {value: "同事",source: "1",target: "4"},
          {value: "同学",source: "1",target: "5"},
          {value: "同学",source: "1",target: "6"},
          {value: "同学",source: "1",target: "7"},
          {value: "爸爸",source: "1",target: "8"},
        ];
        return dataLink;
      },
    }
  }
</script>

<style scoped>
  .echartLayout {
    margin: auto;
    position: absolute;
    top: 0;
    left: 0;
    bottom: 0;
    right: 0;
  }
</style>
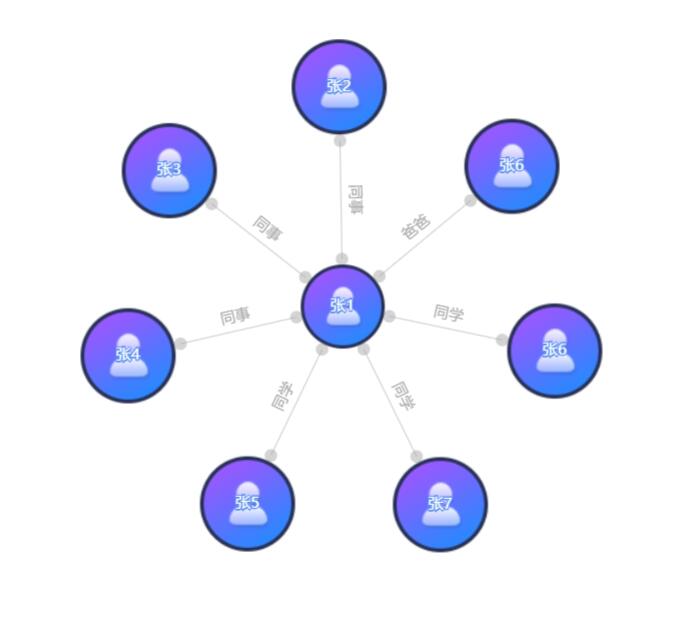
2.2 结果展示

 浙公网安备 33010602011771号