

[metricsQL]通过VictoriaMetrics上报的 histogram 格式中的 `vmrange` 来不精确地统计超时时间
作者:张富春(ahfuzhang),转载时请注明作者和引用链接,谢谢!

1. VictoriaMetrics 上报 histogram 数据的套路
VictoriaMetrics 的轻量级高性能上报组件 https://github.com/VictoriaMetrics/metrics 中,使用了特别的方法来上报 histogram 数据。
例如这个分桶的时延数据:
vm_http_request_duration_seconds_bucket{path="/metrics",vmrange="5.995e-04...6.813e-04"} 4
vm_http_request_duration_seconds_bucket{path="/metrics",vmrange="6.813e-04...7.743e-04"} 1415
vm_http_request_duration_seconds_bucket{path="/metrics",vmrange="7.743e-04...8.799e-04"} 6045
vm_http_request_duration_seconds_bucket{path="/metrics",vmrange="8.799e-04...1.000e-03"} 18729
vm_http_request_duration_seconds_bucket{path="/metrics",vmrange="1.000e-03...1.136e-03"} 11002
vm_http_request_duration_seconds_bucket{path="/metrics",vmrange="1.136e-03...1.292e-03"} 2296
vm_http_request_duration_seconds_bucket{path="/metrics",vmrange="1.292e-03...1.468e-03"} 475
vm_http_request_duration_seconds_bucket{path="/metrics",vmrange="1.468e-03...1.668e-03"} 143
vm_http_request_duration_seconds_bucket{path="/metrics",vmrange="1.668e-03...1.896e-03"} 74
vm_http_request_duration_seconds_bucket{path="/metrics",vmrange="1.896e-03...2.154e-03"} 31
vm_http_request_duration_seconds_bucket{path="/metrics",vmrange="2.154e-03...2.448e-03"} 22
vm_http_request_duration_seconds_bucket{path="/metrics",vmrange="2.448e-03...2.783e-03"} 20
vm_http_request_duration_seconds_bucket{path="/metrics",vmrange="2.783e-03...3.162e-03"} 3
vm_http_request_duration_seconds_bucket{path="/metrics",vmrange="3.162e-03...3.594e-03"} 1
vm_http_request_duration_seconds_bucket{path="/metrics",vmrange="3.594e-03...4.084e-03"} 2
vm_http_request_duration_seconds_bucket{path="/metrics",vmrange="4.084e-03...4.642e-03"} 1
vm_http_request_duration_seconds_bucket{path="/metrics",vmrange="4.642e-03...5.275e-03"} 4
vm_http_request_duration_seconds_bucket{path="/metrics",vmrange="5.275e-03...5.995e-03"} 3
vm_http_request_duration_seconds_bucket{path="/metrics",vmrange="6.813e-03...7.743e-03"} 5
vm_http_request_duration_seconds_bucket{path="/metrics",vmrange="7.743e-03...8.799e-03"} 5
vm_http_request_duration_seconds_bucket{path="/metrics",vmrange="8.799e-03...1.000e-02"} 8
vm_http_request_duration_seconds_bucket{path="/metrics",vmrange="1.000e-02...1.136e-02"} 6
vm_http_request_duration_seconds_bucket{path="/metrics",vmrange="1.136e-02...1.292e-02"} 1
vm_http_request_duration_seconds_bucket{path="/metrics",vmrange="1.292e-02...1.468e-02"} 2
vm_http_request_duration_seconds_bucket{path="/metrics",vmrange="1.468e-02...1.668e-02"} 3
vm_http_request_duration_seconds_bucket{path="/metrics",vmrange="1.896e-02...2.154e-02"} 1
vm_http_request_duration_seconds_bucket{path="/metrics",vmrange="2.448e-02...2.783e-02"} 1
vm_http_request_duration_seconds_bucket{path="/metrics",vmrange="4.642e-02...5.275e-02"} 1
vm_http_request_duration_seconds_bucket{path="/metrics",vmrange="5.275e-02...5.995e-02"} 1
vm_http_request_duration_seconds_bucket{path="/metrics",vmrange="5.995e-02...6.813e-02"} 2
vm_http_request_duration_seconds_bucket{path="/metrics",vmrange="7.743e-02...8.799e-02"} 1
vm_http_request_duration_seconds_bucket{path="/metrics",vmrange="1.136e-01...1.292e-01"} 1
vm_http_request_duration_seconds_bucket{path="/metrics",vmrange="2.448e-01...2.783e-01"} 1
vm_http_request_duration_seconds_bucket{path="/metrics",vmrange="4.642e-01...5.275e-01"} 1
vm_http_request_duration_seconds_sum{path="/metrics"} 40.88543205599984
vm_http_request_duration_seconds_count{path="/metrics"} 40310
VM 使用了 vmrange 这个字段,而不是 prometheus 规范中的 le 字段。
2. 需求
需求就是,假定接口的超时时间是 500 毫秒,能不能根据上面的 metrics 数据,统计出超时的请求数有多少?
3. 思考过程
vmrange 中是一个范围,设定了桶的起始值。
完美的情况是:500ms 刚好是某条数据的开始值,或者结束值。
但是,也可能出现 vmrange="0.4...0.6",这样就无法精确得知 500 毫秒以上的请求数。
不过,不精确的统计也是够用的。
所以,正如标题所写,我试着实现不精确的统计。
$ 4. 查询表达式
sum(
(
	(label_value(label_replace(vm_http_request_duration_seconds_bucket {container="vlsingle",customer_brand="xx",customer_cluster="xxxx",customer_env="stress-test",endpoint="http",instance="172.20.10.252:9428",job="vlsingle-singlenode-k8s",namespace="logging",path="/metrics",pod="vlsingle-singlenode-k8s-86d48b689-67vrx",prometheus="metrics/vmcluster-realtime",service="vlsingle-singlenode-k8s"},"le","$1","vmrange", "([^\\n]+)\\.\\.\\.([^\\n]+)"),"le")>0.5)
	/
	(label_value(label_replace(vm_http_request_duration_seconds_bucket {container="vlsingle",customer_brand="xx",customer_cluster="xxxx",customer_env="stress-test",endpoint="http",instance="172.20.10.252:9428",job="vlsingle-singlenode-k8s",namespace="logging",path="/metrics",pod="vlsingle-singlenode-k8s-86d48b689-67vrx",prometheus="metrics/vmcluster-realtime",service="vlsingle-singlenode-k8s"},"le","$1","vmrange", "([^\\n]+)\\.\\.\\.([^\\n]+)"),"le")>0.5)
) and
    label_replace(vm_http_request_duration_seconds_bucket {container="vlsingle",customer_brand="xx",customer_cluster="xxxx",customer_env="stress-test",endpoint="http",instance="172.20.10.252:9428",job="vlsingle-singlenode-k8s",namespace="logging",path="/metrics",pod="vlsingle-singlenode-k8s-86d48b689-67vrx",prometheus="metrics/vmcluster-realtime",service="vlsingle-singlenode-k8s"},"le","$1","vmrange", "([^\\n]+)\\.\\.\\.([^\\n]+)")
)
表达式的计算流程如下:
- label_replace(vm_http_request_duration_seconds_bucket{vmrange="xxxx"}, ,"le","$1","vmrange", "([\n]+)\.\.\.([\n]+)")
- 通过正则表达式,取出 vmrange 中的第一段,变成 prometheus 规范中的 le 字段
- label_value(vm_http_request_duration_seconds_bucket{le="xx"}, "le")>0.5
- 过滤出时延范围大于 0.5 的 time series
- 这一步过滤后,并非返回 true/false 或者 1/0,而是返回了 label_value 的值
- 我认为这是不合理的,提了个 issue: label_value(timeseries,"label_name")>0.5 should be return 1 or 0, should not return label value
- 因为 label_value(xx,label_name)>0.5 这里返回了值,我不得不把这个表达式自己除以自己,以便得到 1
- 上面的表达式,再与全部的符合条件的 time series 做 and 运算,完成了过滤
- 过滤后再做 sum
- 最终实现了统计
延迟超过 500 毫秒的请求数
- 最终实现了统计
label_value 这部分表达式重复计算了,白白浪费了资源:
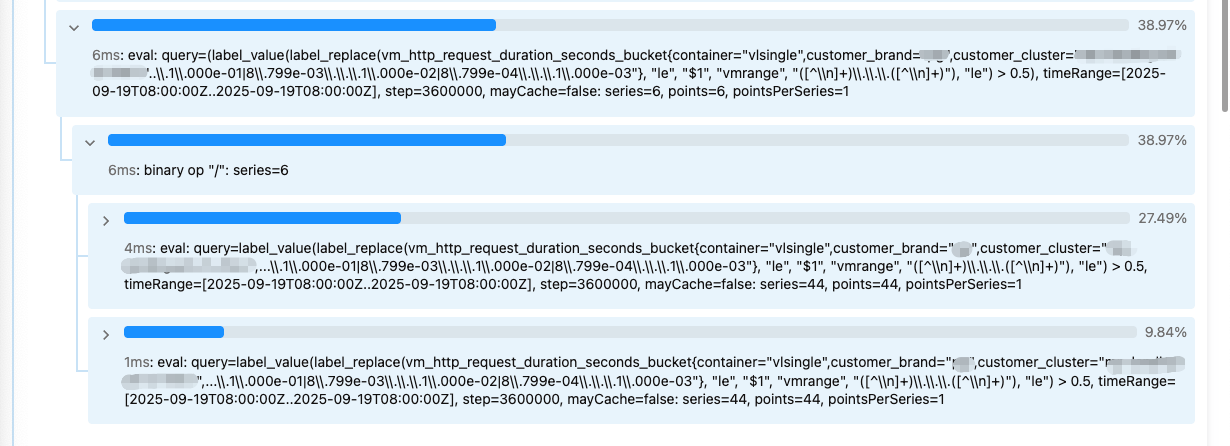
不管怎么样,记得上得到了期待的结果。
😃 have fun.

 浙公网安备 33010602011771号