
jmeter测试kingbase高可用集群业务恢复时间
一、环境准备
1、cluster_switch.jmx
2、apache-jmeter-3.2.zip
二、利用jmeter插入数据
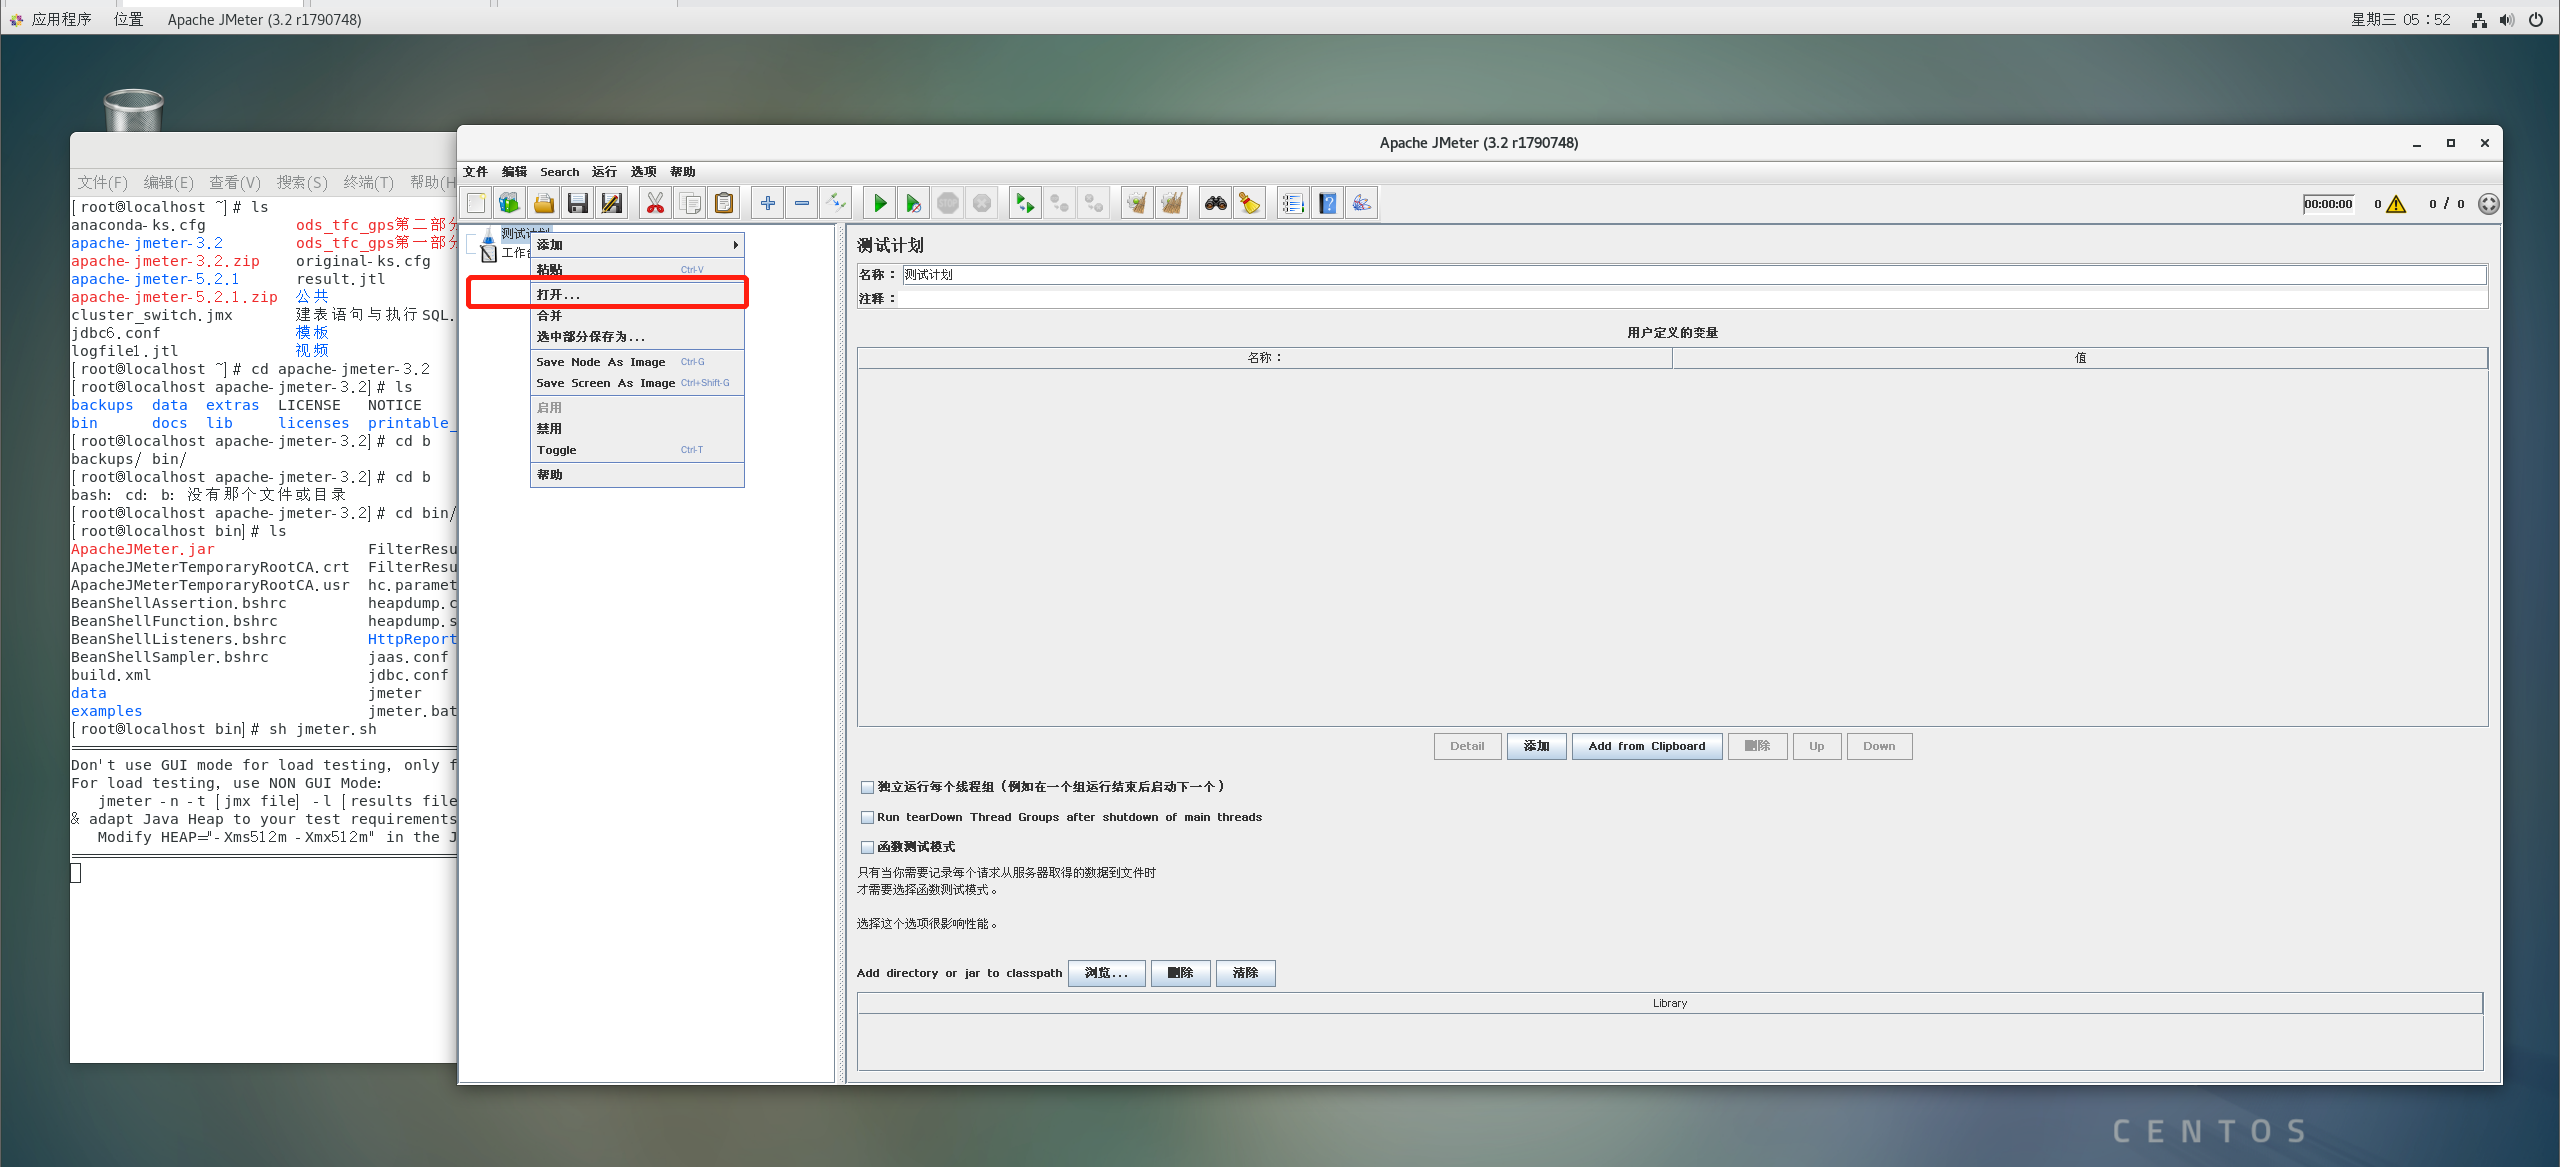
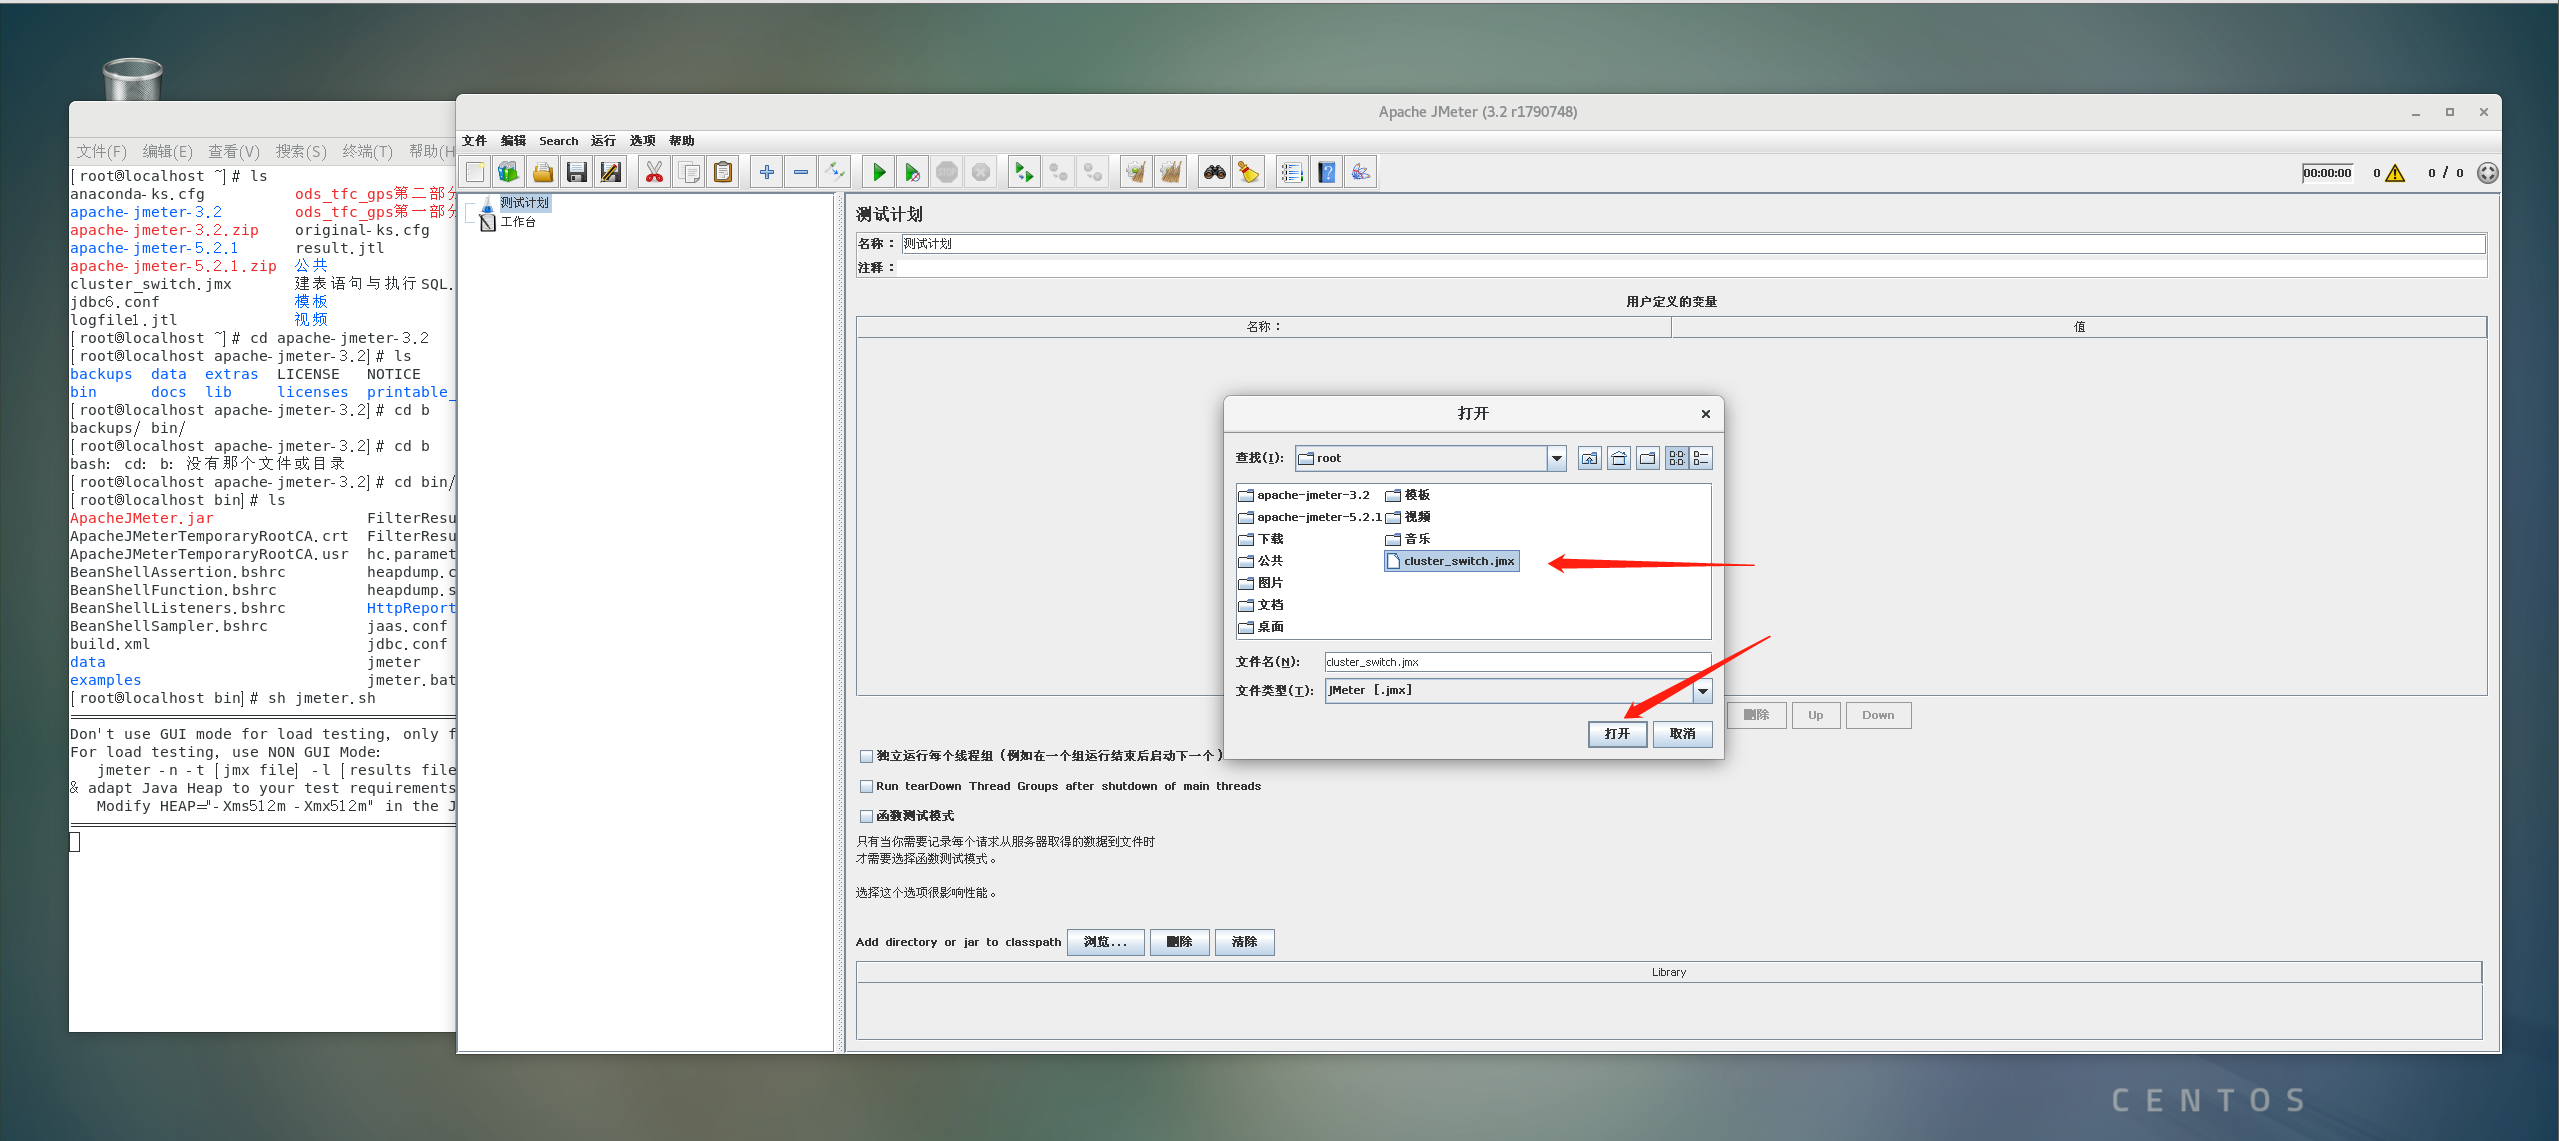
1、 打开jmeter添加到压缩包 jmeter.zip
2、 上传jmeter.zip到linux服务器:/root/apache-jmeter-3.2
3、 解压,进入路径/root/apache-jmeter-3.2/bin
4、 查看jmeter.sh是否能够执行,若不能未其添加执行权限,我直接 chmod 777 jmeter.sh,可用 sh jmeter.sh -v 来检测命令是否可用。
5、新建测试表
drop table if exists test_cluster;
create table test_cluster(id serial,col timestamp)
Root>cd /opt/Kingbase/ES/V8/KESRealPro/V008R006C007B0024/Interface/jdbc
cp kingbase8-8.6.0.jar /root/apache-jmeter-3.2/lib
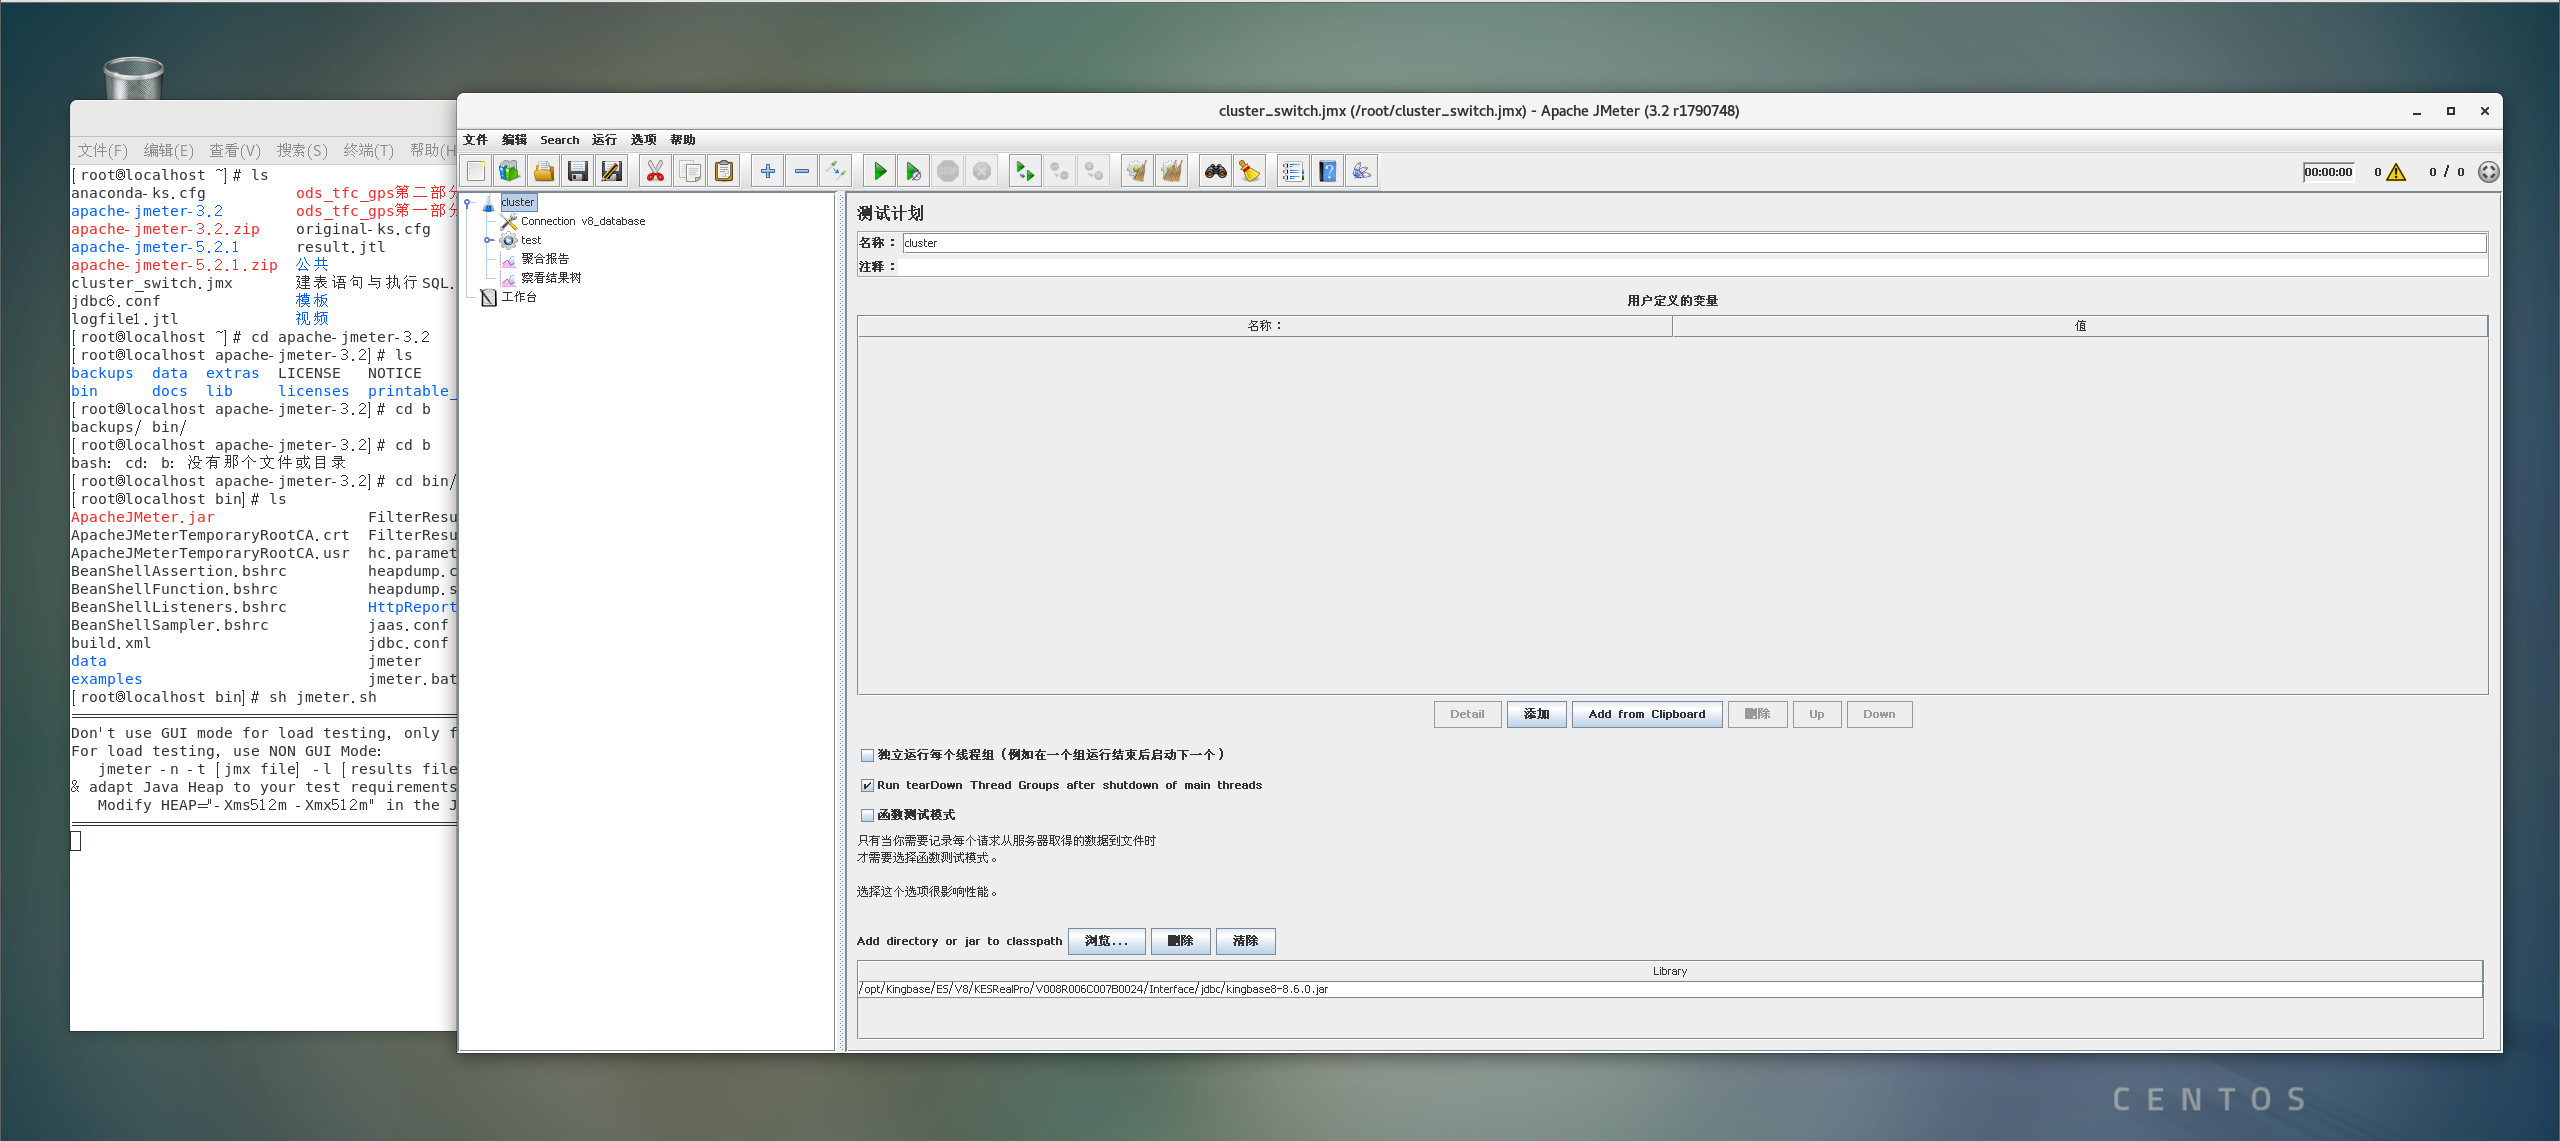
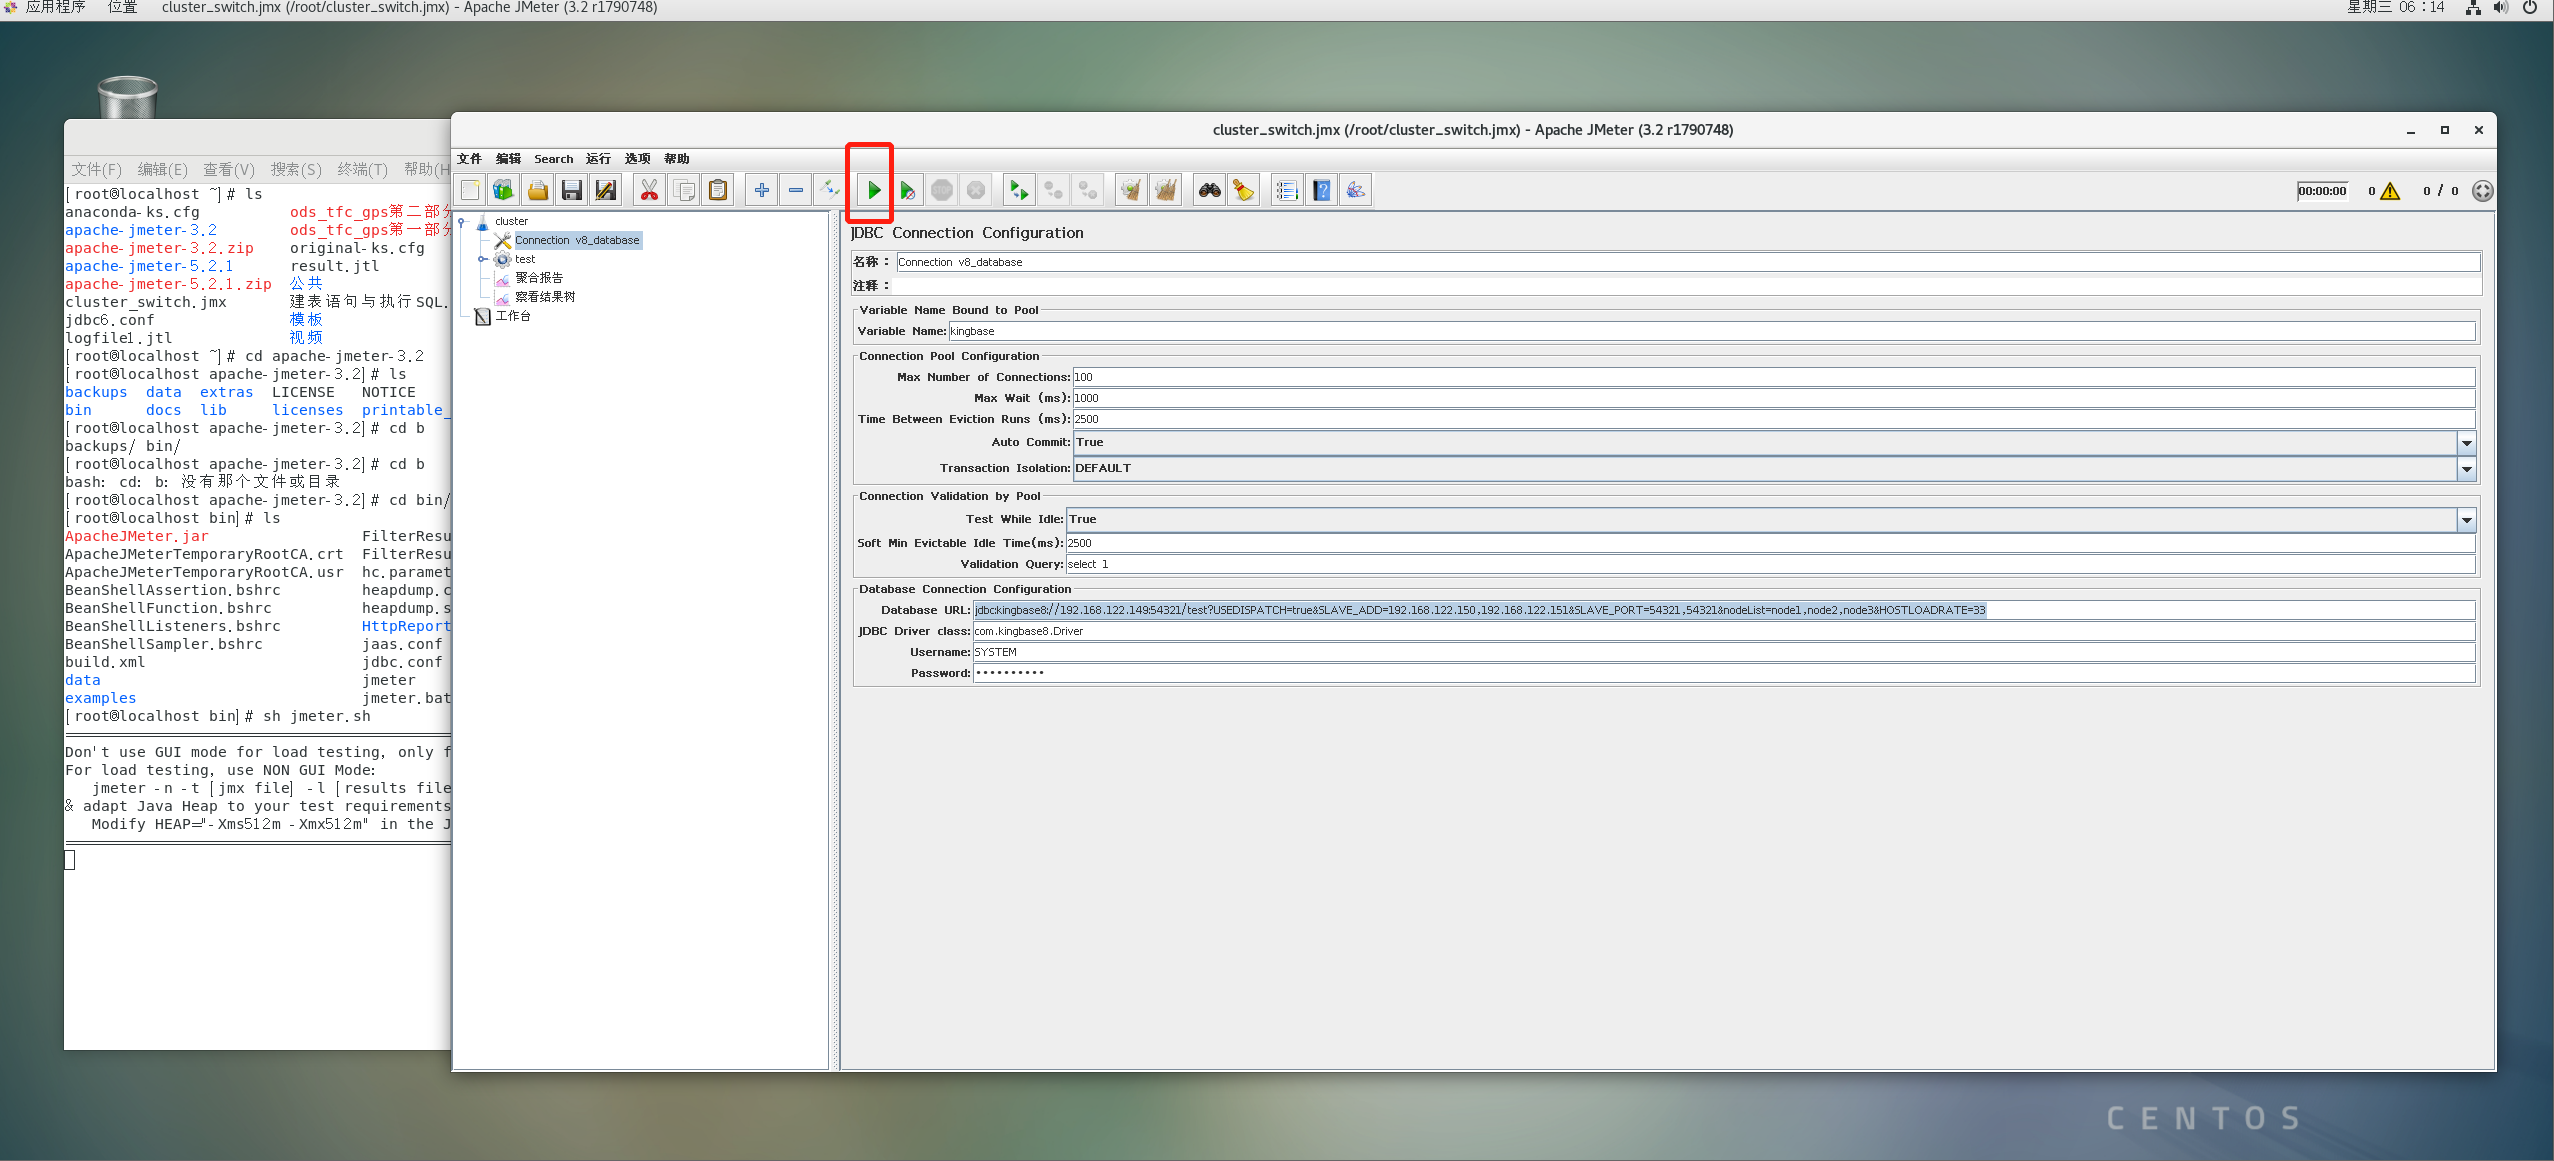
6、配置jmeter脚本
vi cluster_switch.jmx
<?xml version="1.0" encoding="UTF-8"?>
<jmeterTestPlan version="1.2" properties="3.2" jmeter="3.2 r1790748">
<hashTree>
<TestPlan guiclass="TestPlanGui" testclass="TestPlan" testname="cluster" enabled="true">
<stringProp name="TestPlan.comments"></stringProp>
<boolProp name="TestPlan.functional_mode">false</boolProp>
<boolProp name="TestPlan.serialize_threadgroups">false</boolProp>
<elementProp name="TestPlan.user_defined_variables" elementType="Arguments" guiclass="ArgumentsPanel" testclass="Arguments" testname="用户定义的变量" enabled="true">
<collectionProp name="Arguments.arguments"/>
</elementProp>
<stringProp name="TestPlan.user_define_classpath">/opt/Kingbase/ES/V8/KESRealPro/V008R006C007B0024/Interface/jdbc/kingbase8-8.6.0.jar</stringProp>
<boolProp name="TestPlan.tearDown_on_shutdown">true</boolProp>
</TestPlan>
<hashTree>
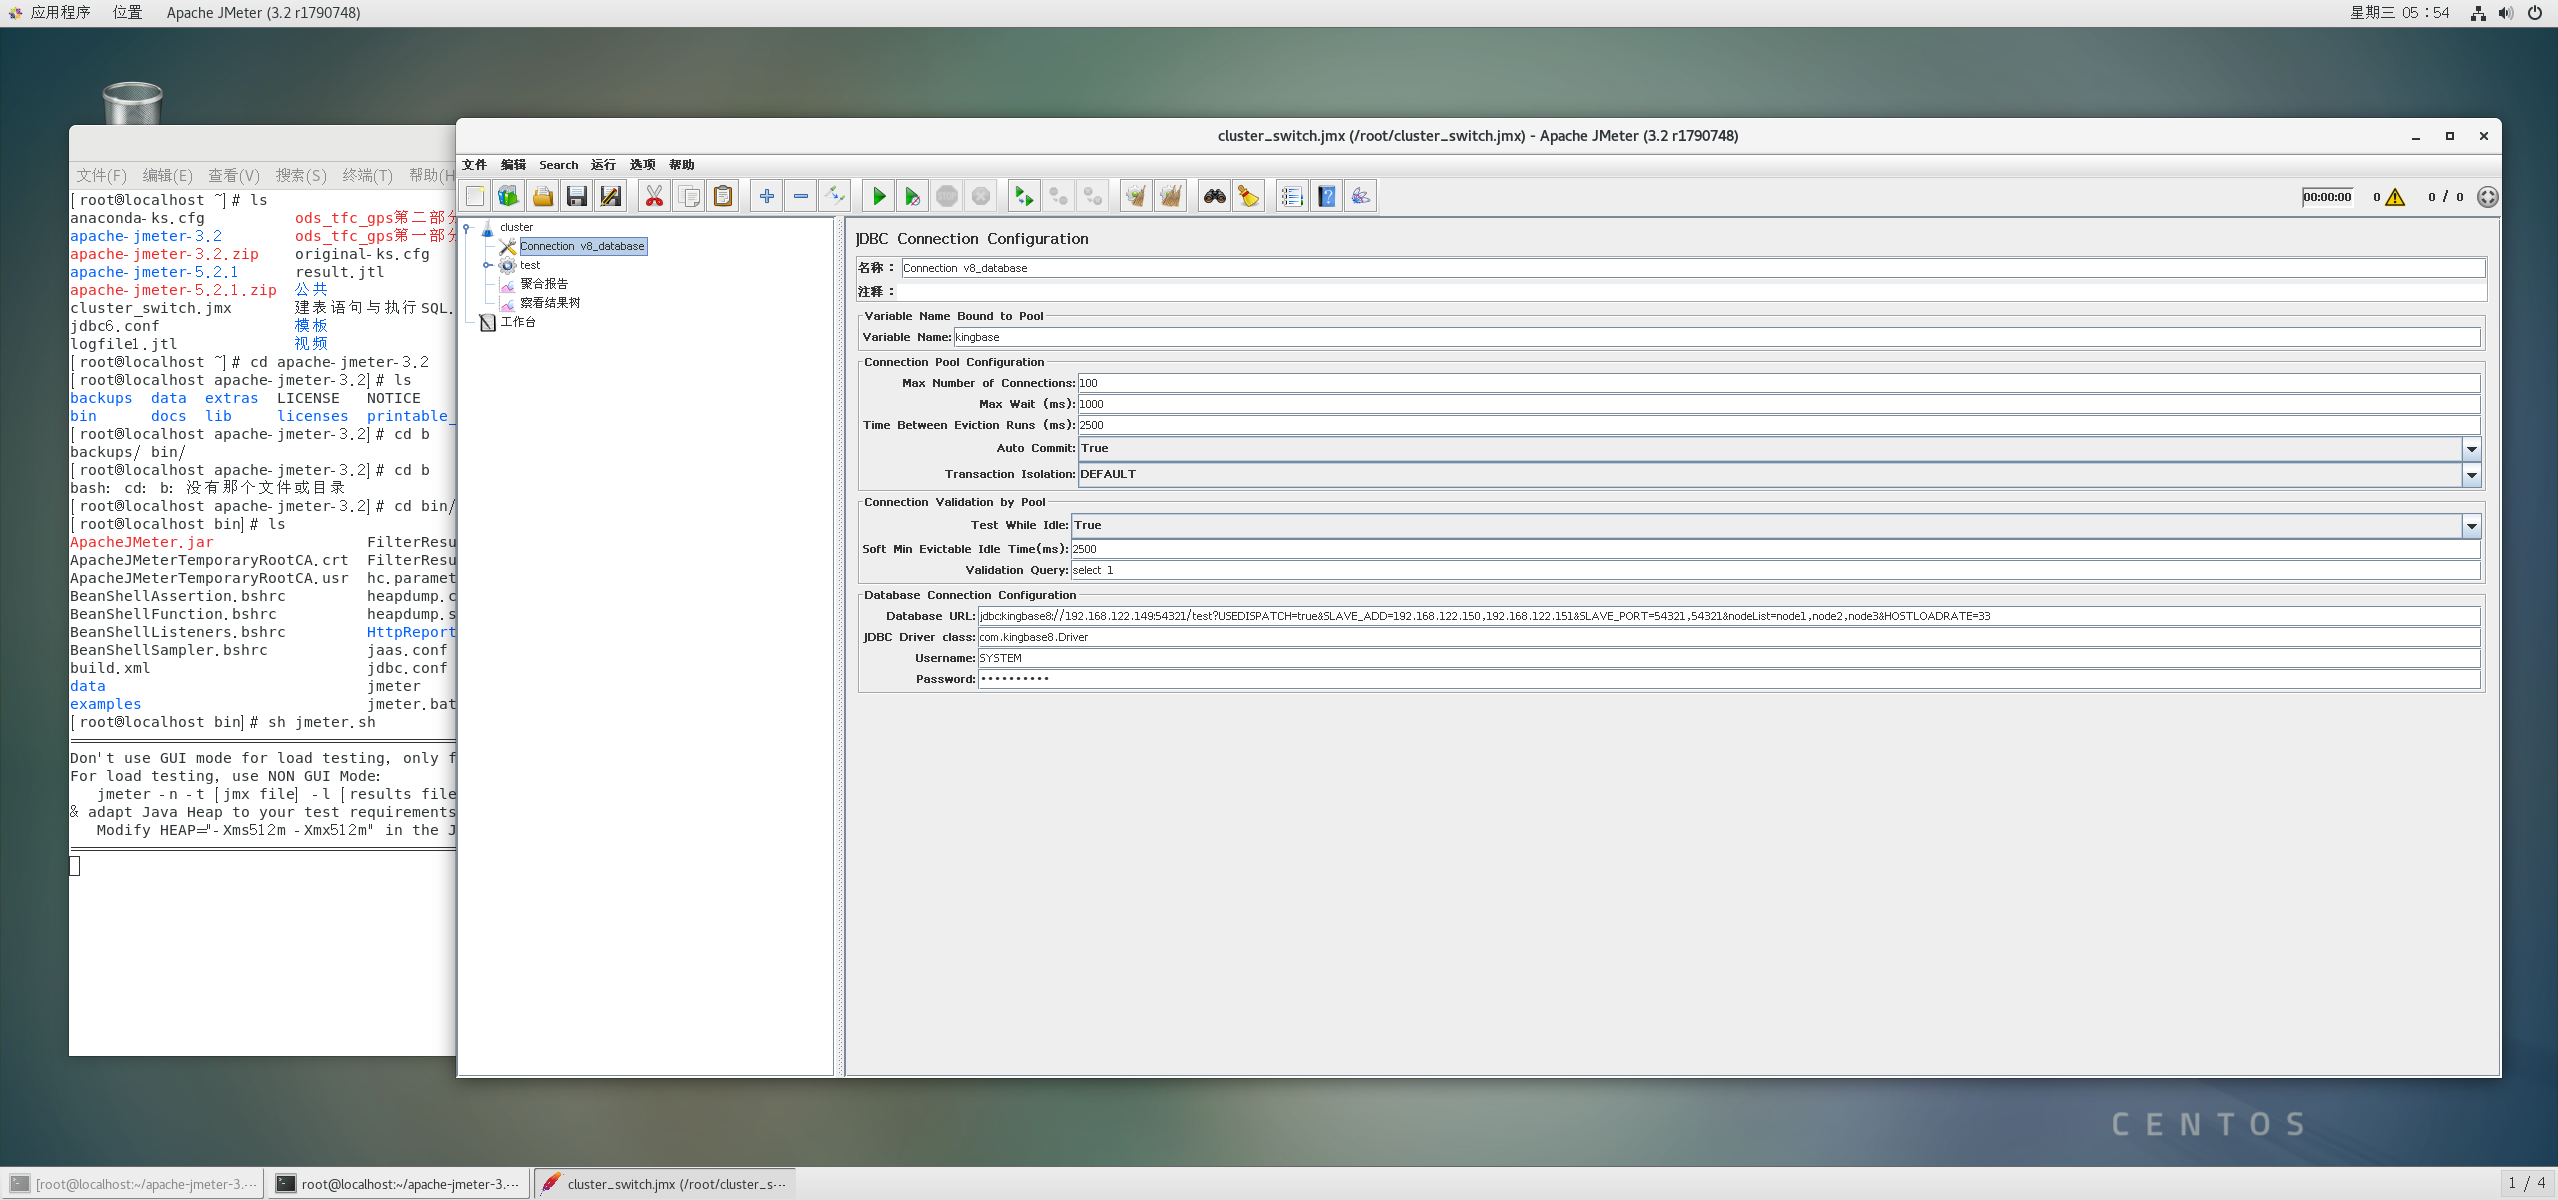
<JDBCDataSource guiclass="TestBeanGUI" testclass="JDBCDataSource" testname="Connection v8_database" enabled="true">
<boolProp name="autocommit">true</boolProp>
<stringProp name="checkQuery">select 1</stringProp>
<stringProp name="connectionAge">2500</stringProp>
<stringProp name="dataSource">kingbase</stringProp>
<stringProp name="dbUrl">jdbc:kingbase8://192.168.122.149:54321/test?USEDISPATCH=true&SLAVE_ADD=192.168.122.150,192.168.122.151&SLAVE_PORT=54321,54321&nodeList=node1,node2,node3&HOSTLOADRATE=33</stringProp>
<stringProp name="driver">com.kingbase8.Driver</stringProp>
<boolProp name="keepAlive">true</boolProp>
<stringProp name="password">12345678ab</stringProp>
<stringProp name="poolMax">100</stringProp>
<stringProp name="timeout">1000</stringProp>
<stringProp name="transactionIsolation">DEFAULT</stringProp>
<stringProp name="trimInterval">2500</stringProp>
<stringProp name="username">SYSTEM</stringProp>
<boolProp name="preinit">false</boolProp>
<stringProp name="initQuery"></stringProp>
<stringProp name="connectionProperties"></stringProp>
</JDBCDataSource>
<hashTree/>
<ThreadGroup guiclass="ThreadGroupGui" testclass="ThreadGroup" testname="test" enabled="true">
<stringProp name="ThreadGroup.on_sample_error">continue</stringProp>
<elementProp name="ThreadGroup.main_controller" elementType="LoopController" guiclass="LoopControlPanel" testclass="LoopController" testname="循环控制器" enabled="true">
<boolProp name="LoopController.continue_forever">false</boolProp>
<intProp name="LoopController.loops">-1</intProp>
</elementProp>
<stringProp name="ThreadGroup.num_threads">20</stringProp>
<stringProp name="ThreadGroup.ramp_time">1</stringProp>
<longProp name="ThreadGroup.start_time">1571642556000</longProp>
<longProp name="ThreadGroup.end_time">1571642556000</longProp>
<boolProp name="ThreadGroup.scheduler">false</boolProp>
<stringProp name="ThreadGroup.duration">600</stringProp>
<stringProp name="ThreadGroup.delay"></stringProp>
<boolProp name="ThreadGroup.same_user_on_next_iteration">true</boolProp>
</ThreadGroup>
<hashTree>
<JDBCSampler guiclass="TestBeanGUI" testclass="JDBCSampler" testname="table select" enabled="true">
<stringProp name="dataSource">kingbase</stringProp>
<stringProp name="queryType">Update Statement</stringProp>
<stringProp name="query">insert into test_cluster(col) values(now());</stringProp>
<stringProp name="queryArguments"></stringProp>
<stringProp name="queryArgumentsTypes"></stringProp>
<stringProp name="variableNames"></stringProp>
<stringProp name="resultVariable"></stringProp>
<stringProp name="queryTimeout"></stringProp>
<stringProp name="resultSetHandler">Store as String</stringProp>
<stringProp name="resultSetMaxRows"></stringProp>
</JDBCSampler>
<hashTree/>
<kg.apc.jmeter.vizualizers.CorrectedResultCollector guiclass="kg.apc.jmeter.vizualizers.TransactionsPerSecondGui" testclass="kg.apc.jmeter.vizualizers.CorrectedResultCollector" testname="jp@gc - Transactions per Second" enabled="true">
<boolProp name="ResultCollector.error_logging">false</boolProp>
<objProp>
<name>saveConfig</name>
<value class="SampleSaveConfiguration">
<time>true</time>
<latency>true</latency>
<timestamp>true</timestamp>
<success>true</success>
<label>true</label>
<code>true</code>
<message>true</message>
<threadName>true</threadName>
<dataType>true</dataType>
<encoding>false</encoding>
<assertions>true</assertions>
<subresults>true</subresults>
<responseData>false</responseData>
<samplerData>false</samplerData>
<xml>false</xml>
<fieldNames>true</fieldNames>
<responseHeaders>false</responseHeaders>
<requestHeaders>false</requestHeaders>
<responseDataOnError>false</responseDataOnError>
<saveAssertionResultsFailureMessage>true</saveAssertionResultsFailureMessage>
<assertionsResultsToSave>0</assertionsResultsToSave>
<bytes>true</bytes>
<sentBytes>true</sentBytes>
<url>true</url>
<threadCounts>true</threadCounts>
<idleTime>true</idleTime>
<connectTime>true</connectTime>
</value>
</objProp>
<stringProp name="filename"></stringProp>
<longProp name="interval_grouping">1000</longProp>
<boolProp name="graph_aggregated">false</boolProp>
<stringProp name="include_sample_labels"></stringProp>
<stringProp name="exclude_sample_labels"></stringProp>
<stringProp name="start_offset"></stringProp>
<stringProp name="end_offset"></stringProp>
<boolProp name="include_checkbox_state">false</boolProp>
<boolProp name="exclude_checkbox_state">false</boolProp>
</kg.apc.jmeter.vizualizers.CorrectedResultCollector>
<hashTree/>
</hashTree>
<ResultCollector guiclass="StatVisualizer" testclass="ResultCollector" testname="聚合报告" enabled="true">
<boolProp name="ResultCollector.error_logging">false</boolProp>
<objProp>
<name>saveConfig</name>
<value class="SampleSaveConfiguration">
<time>true</time>
<latency>true</latency>
<timestamp>true</timestamp>
<success>true</success>
<label>true</label>
<code>true</code>
<message>true</message>
<threadName>true</threadName>
<dataType>true</dataType>
<encoding>false</encoding>
<assertions>true</assertions>
<subresults>true</subresults>
<responseData>true</responseData>
<samplerData>true</samplerData>
<xml>false</xml>
<fieldNames>true</fieldNames>
<responseHeaders>true</responseHeaders>
<requestHeaders>true</requestHeaders>
<responseDataOnError>false</responseDataOnError>
<saveAssertionResultsFailureMessage>true</saveAssertionResultsFailureMessage>
<assertionsResultsToSave>0</assertionsResultsToSave>
<bytes>true</bytes>
<sentBytes>true</sentBytes>
<url>true</url>
<fileName>true</fileName>
<hostname>true</hostname>
<threadCounts>true</threadCounts>
<sampleCount>true</sampleCount>
<idleTime>true</idleTime>
<connectTime>true</connectTime>
</value>
</objProp>
<stringProp name="filename"></stringProp>
</ResultCollector>
<hashTree/>
<ResultCollector guiclass="ViewResultsFullVisualizer" testclass="ResultCollector" testname="察看结果树" enabled="true">
<boolProp name="ResultCollector.error_logging">false</boolProp>
<objProp>
<name>saveConfig</name>
<value class="SampleSaveConfiguration">
<time>true</time>
<latency>true</latency>
<timestamp>true</timestamp>
<success>true</success>
<label>true</label>
<code>true</code>
<message>true</message>
<threadName>true</threadName>
<dataType>true</dataType>
<encoding>false</encoding>
<assertions>true</assertions>
<subresults>true</subresults>
<responseData>true</responseData>
<samplerData>true</samplerData>
<xml>false</xml>
<fieldNames>true</fieldNames>
<responseHeaders>true</responseHeaders>
<requestHeaders>true</requestHeaders>
<responseDataOnError>false</responseDataOnError>
<saveAssertionResultsFailureMessage>true</saveAssertionResultsFailureMessage>
<assertionsResultsToSave>0</assertionsResultsToSave>
<bytes>true</bytes>
<sentBytes>true</sentBytes>
<url>true</url>
<fileName>true</fileName>
<hostname>true</hostname>
<threadCounts>true</threadCounts>
<sampleCount>true</sampleCount>
<idleTime>true</idleTime>
<connectTime>true</connectTime>
</value>
</objProp>
<stringProp name="filename"></stringProp>
</ResultCollector>
<hashTree/>
</hashTree>
<WorkBench guiclass="WorkBenchGui" testclass="WorkBench" testname="工作台" enabled="true">
<boolProp name="WorkBench.save">true</boolProp>
</WorkBench>
<hashTree/>
</hashTree>
</jmeterTestPlan>
方法一:可视化界面启动jmeter
sh jmeter.sh
jdbc:kingbase8://192.168.122.149:54321/test?USEDISPATCH=true&SLAVE_ADD=192.168.122.150,192.168.122.151&SLAVE_PORT=54321,54321&nodeList=node1,node2,node3&HOSTLOADRATE=33

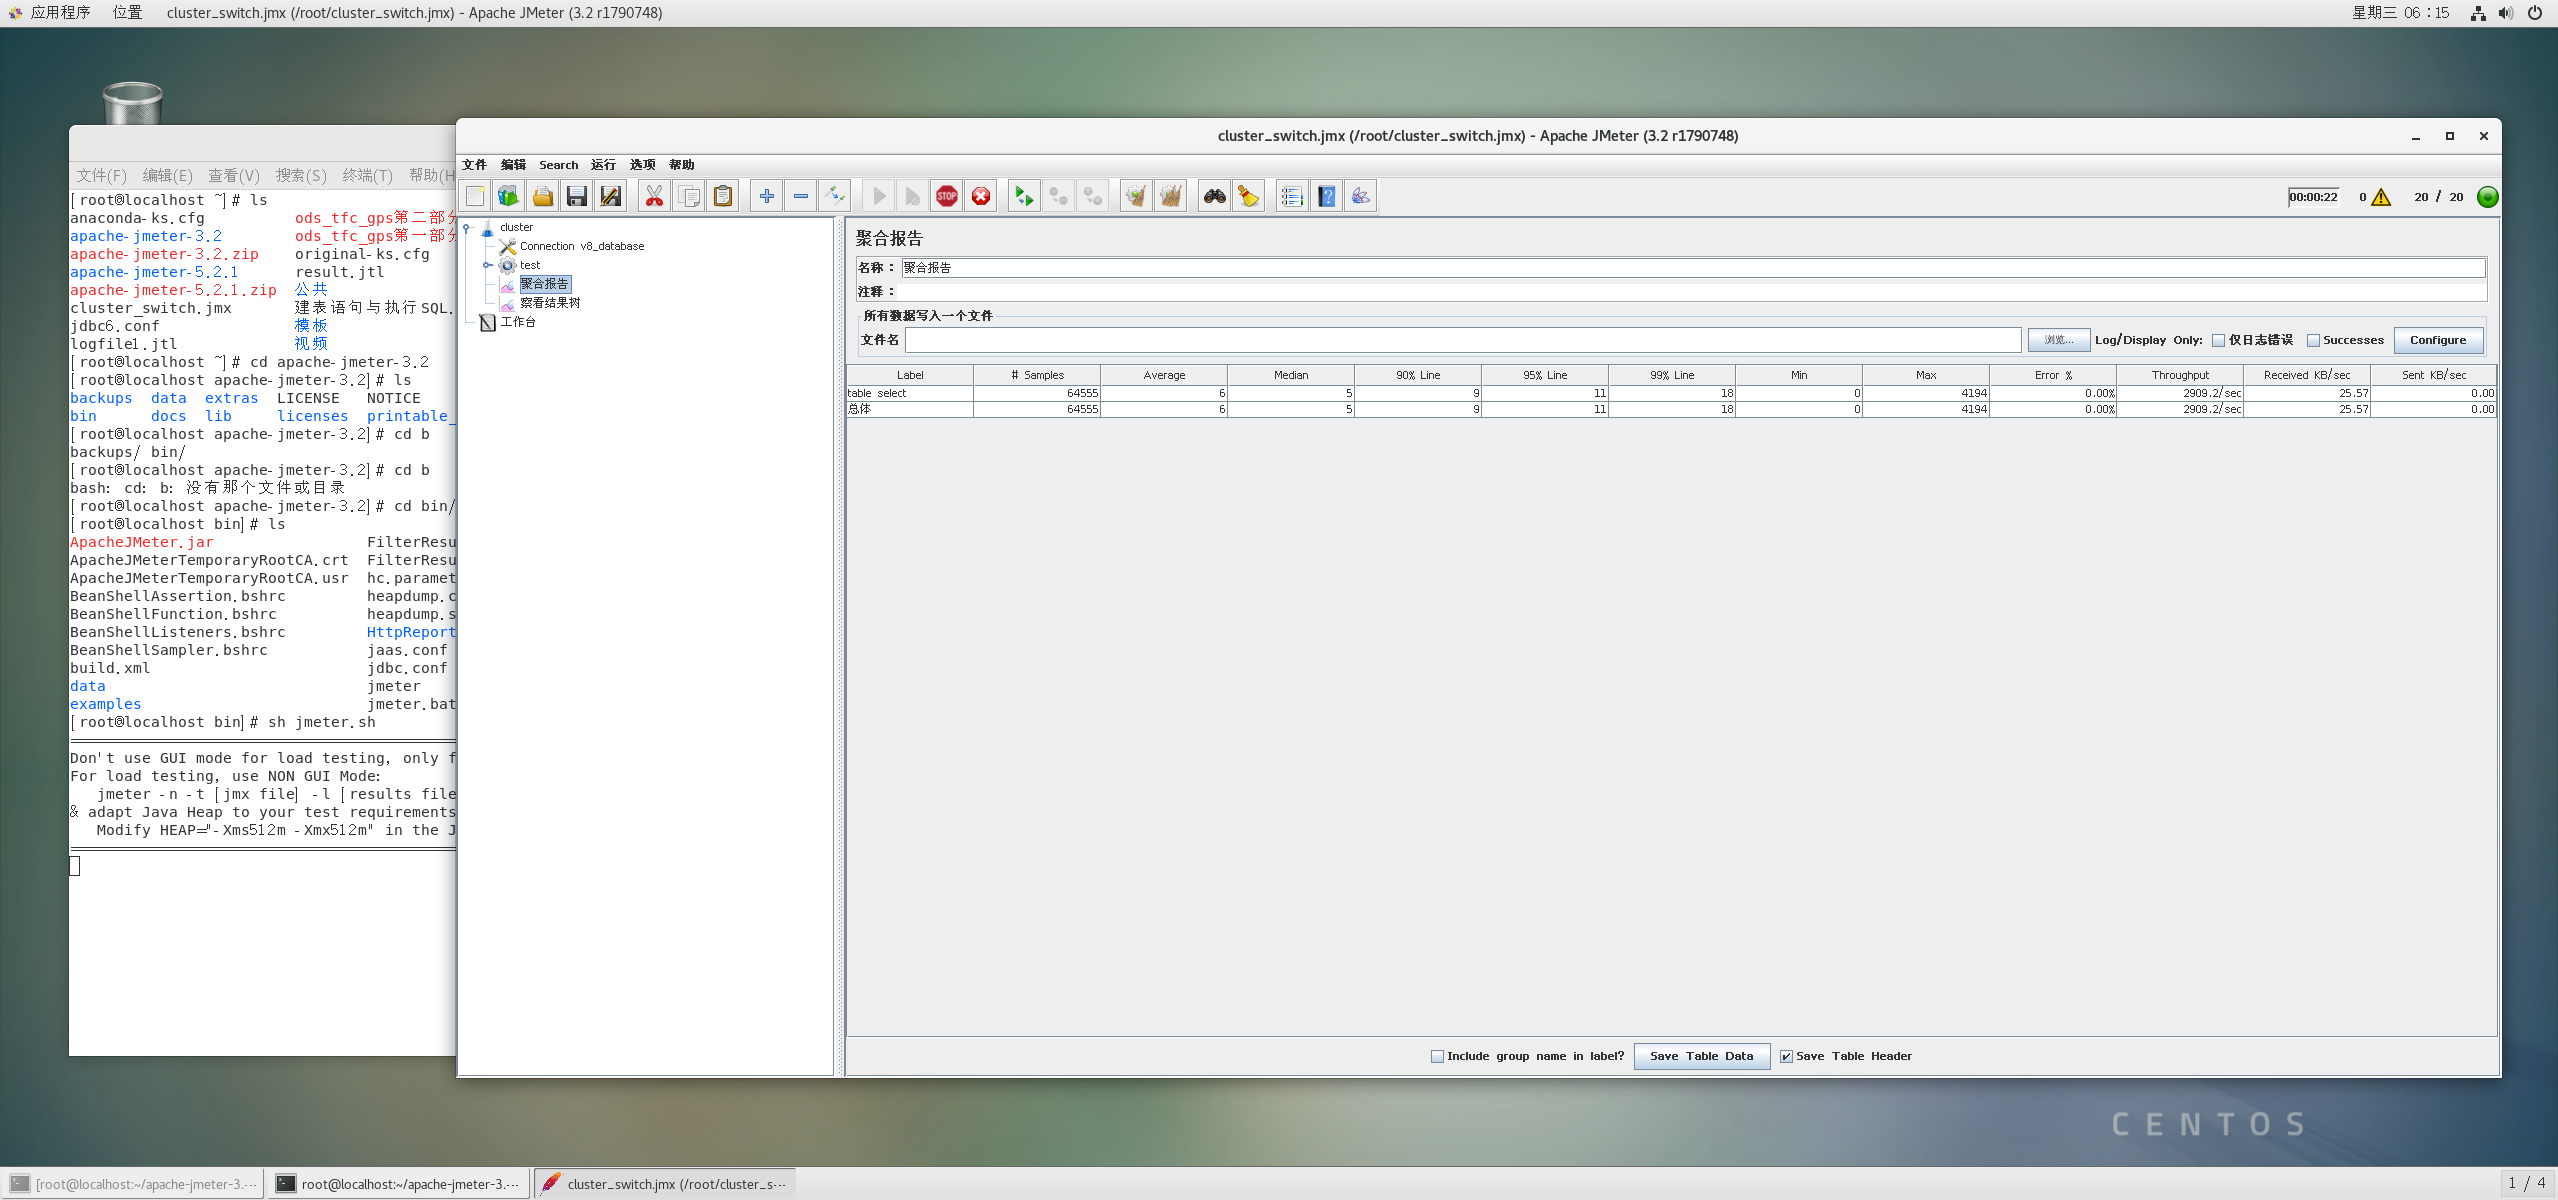
(1)点击开始按钮插入数据,查看聚合报告
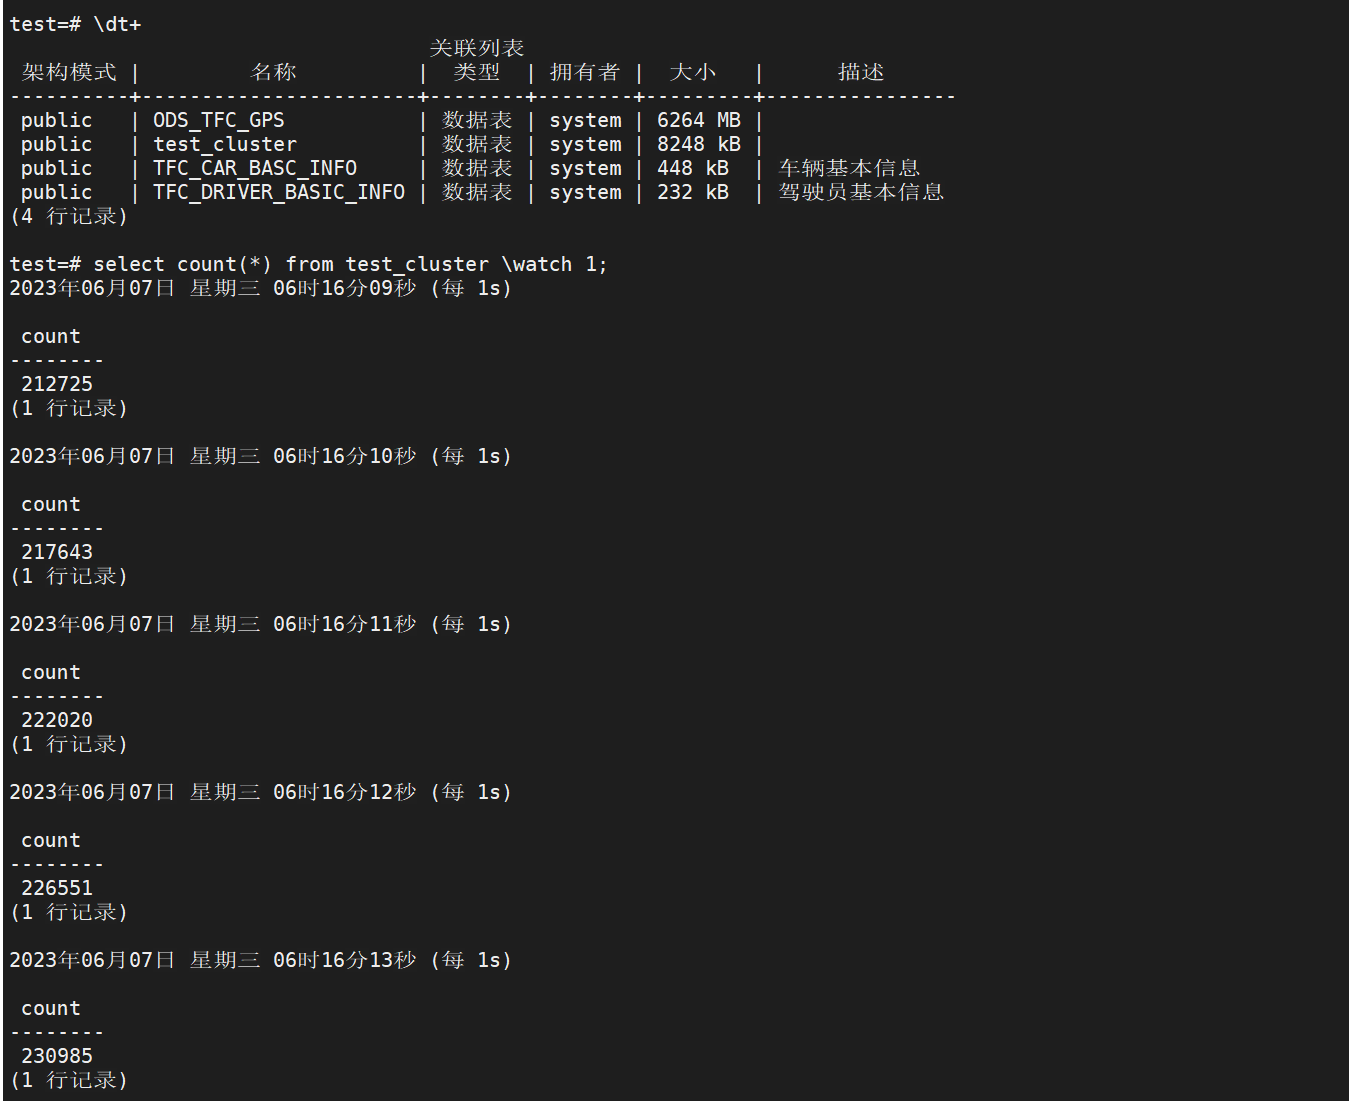
(2)查询数据是否插入,可以看到数据已经插入,如下图:
(3)执行停止按钮,停止插入数据;
方法二:利用命令行运行jmeter,利用jmeter插入数据
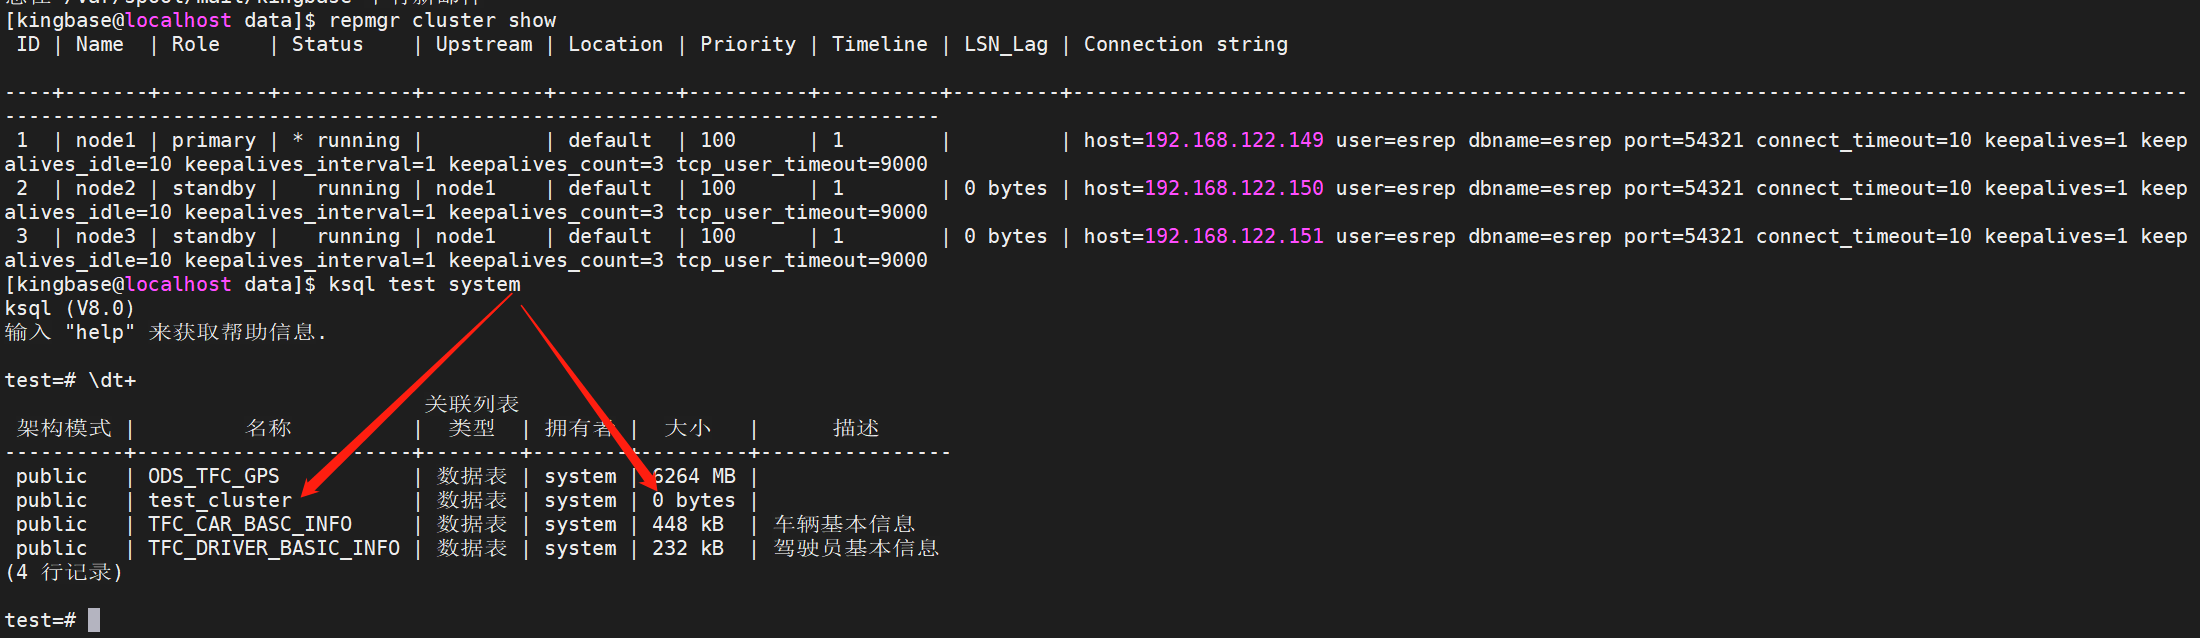
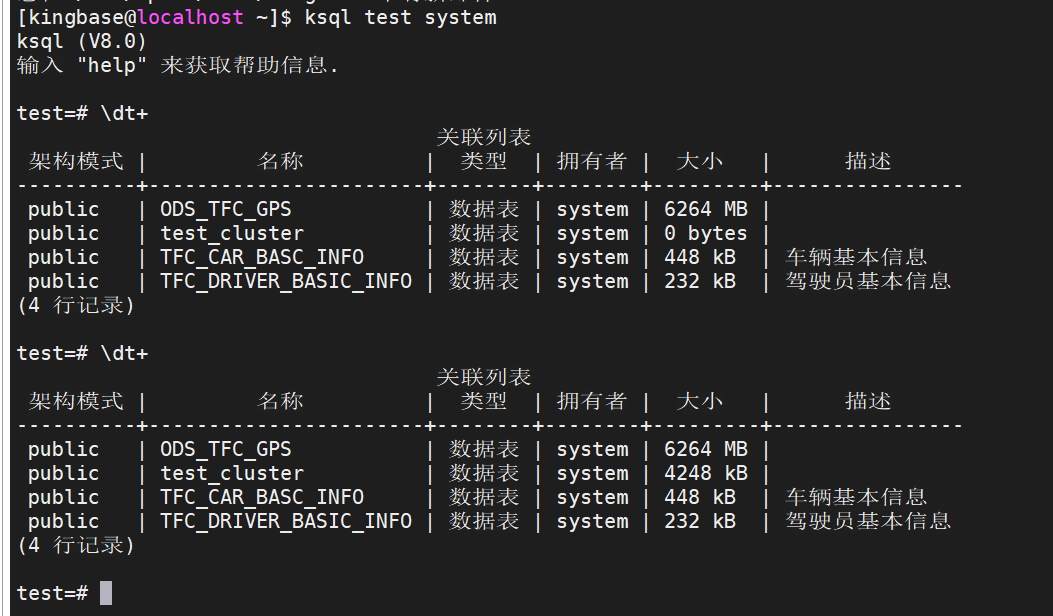
(1)查看表的大小,此时没有数据,如下图:
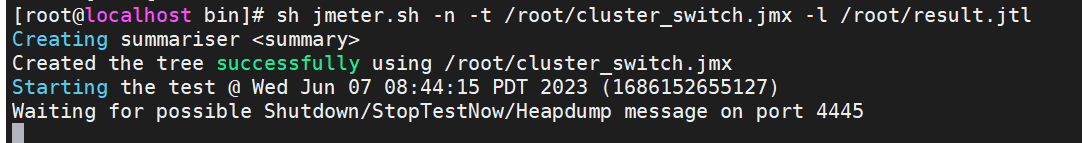
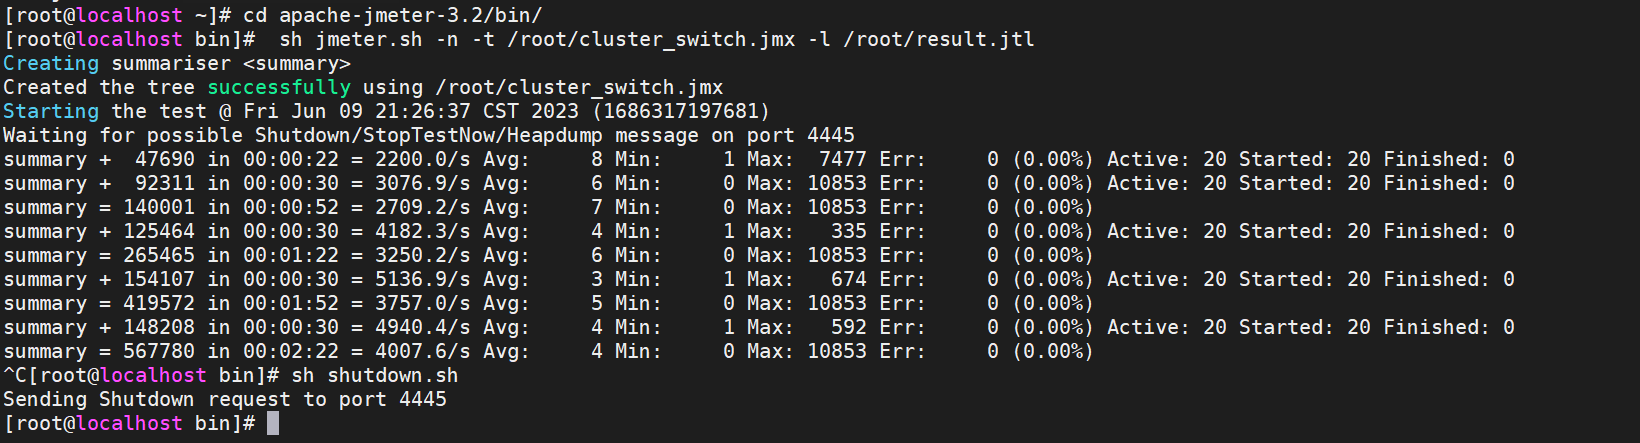
(2)运行jmeter,调用脚本插入数据

sh jmeter.sh -n -t /root/cluster_switch.jmx -l /root/result.jtl
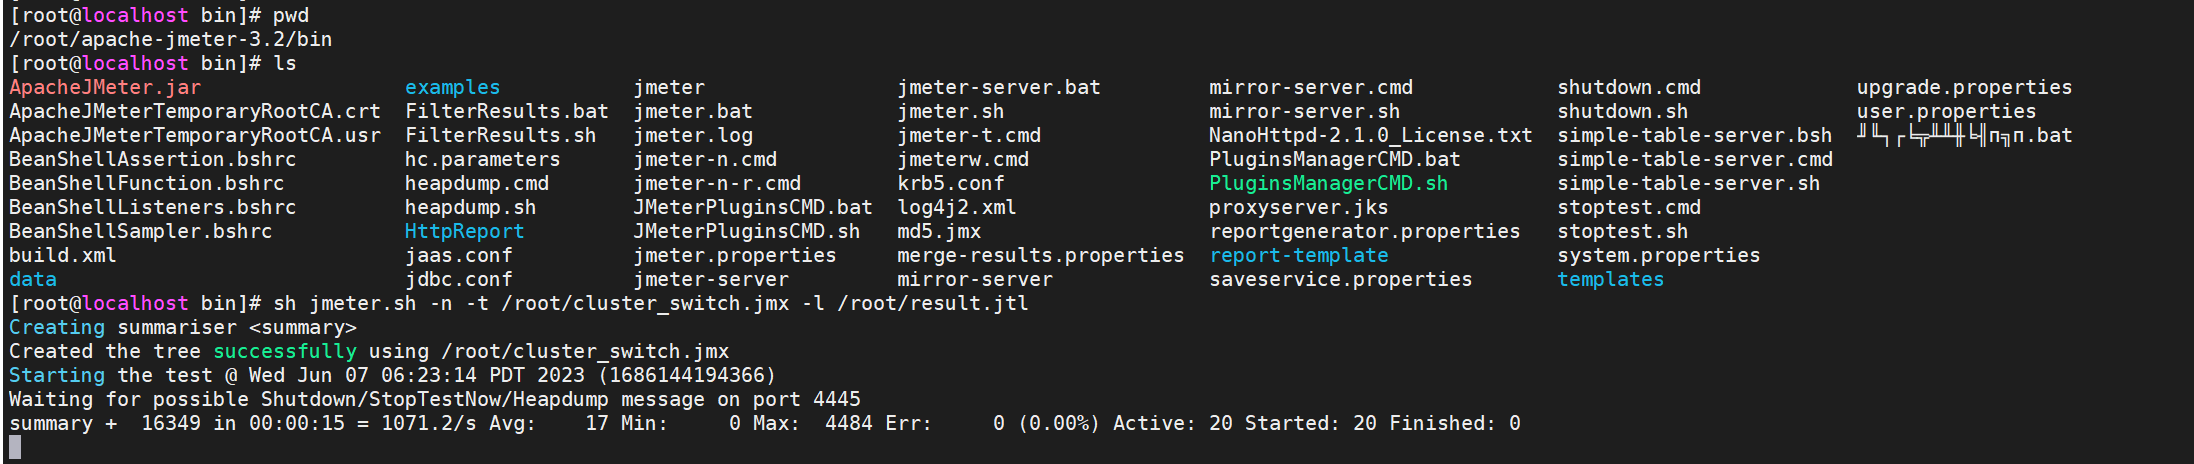
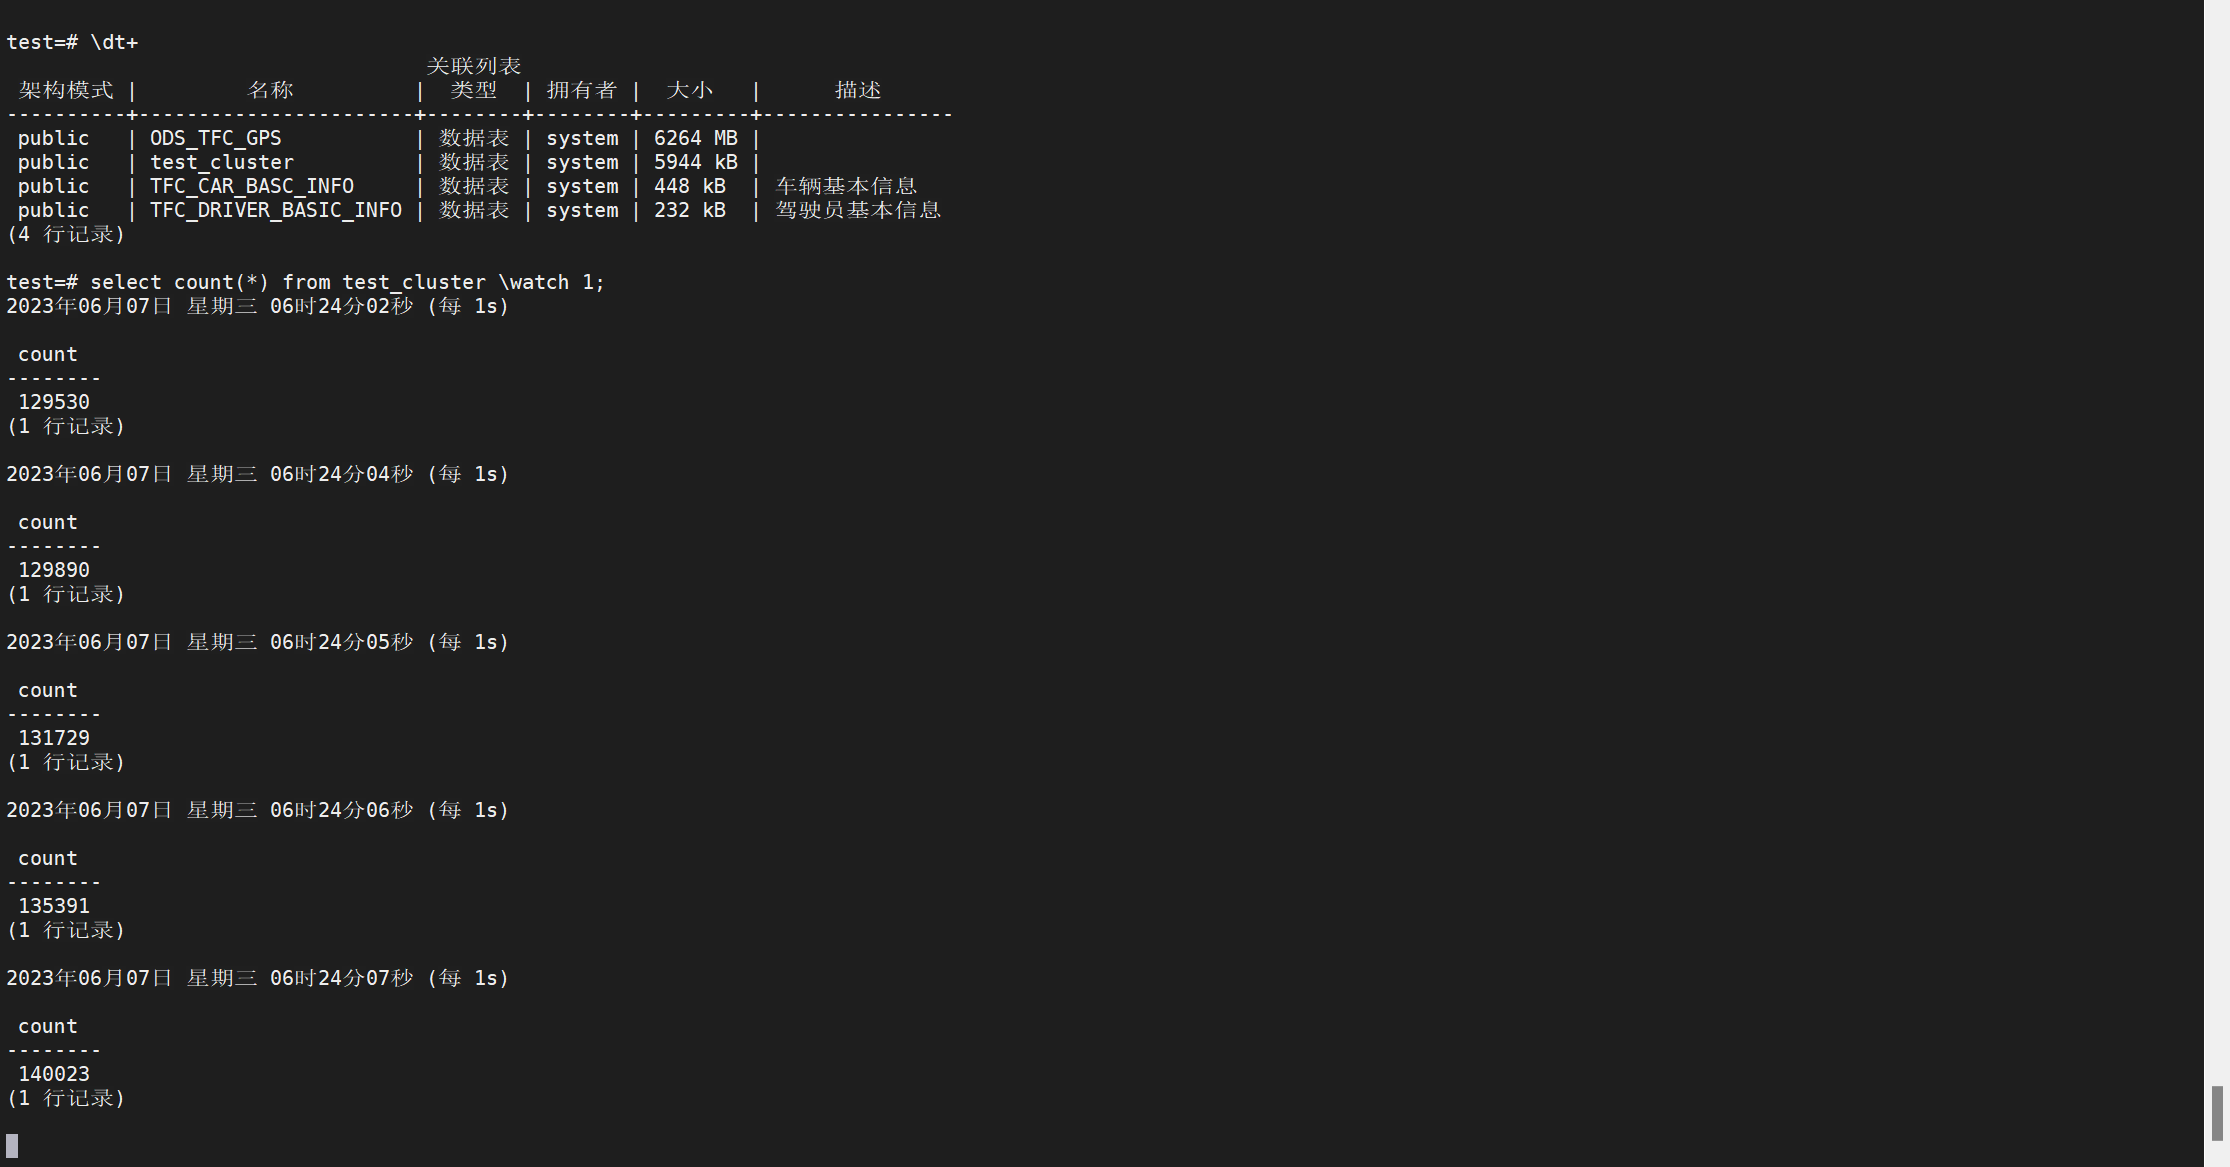
此时数据已经插入到test_cluster表中;已成功插入数据
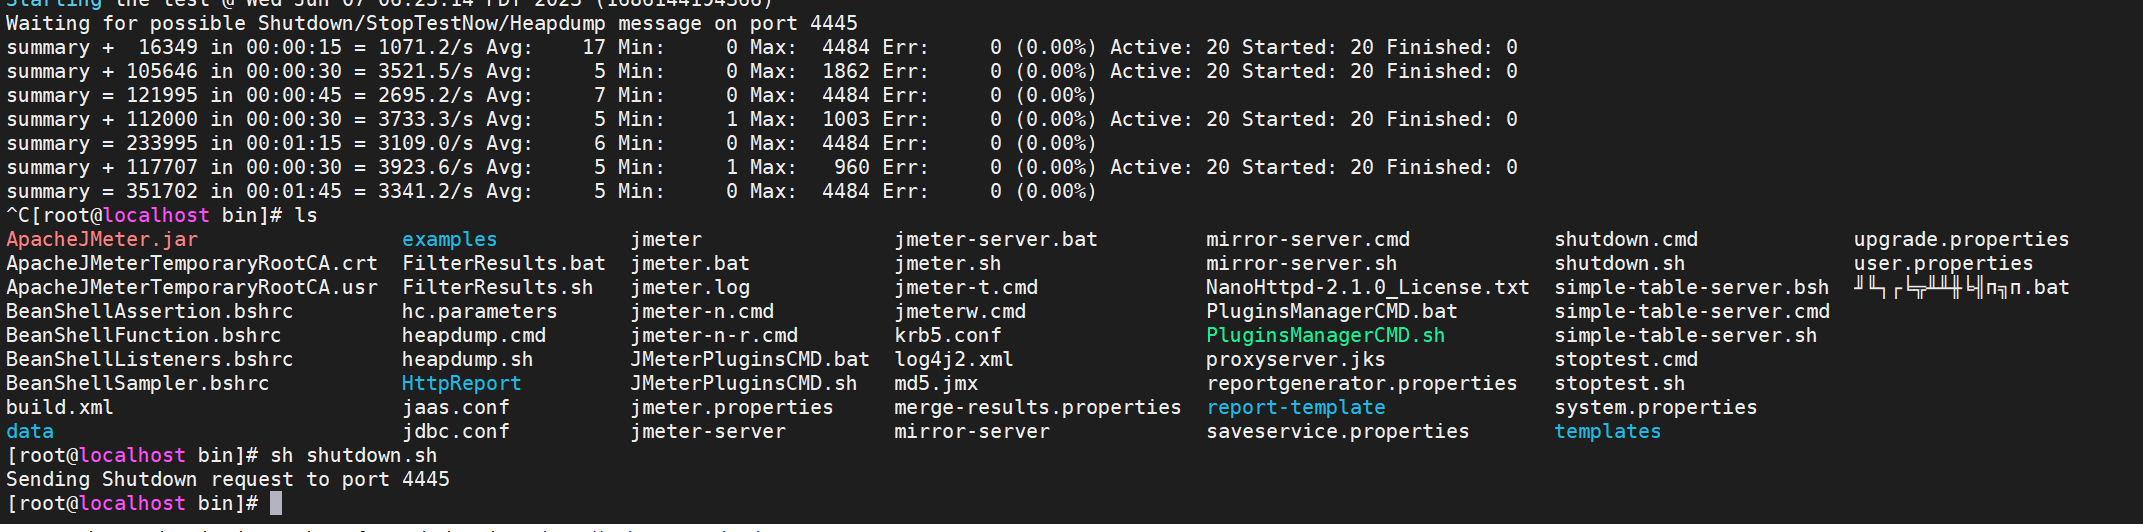
(3)关闭jmeter
sh shutdown.sh
三、测试高可用集群业务恢复时间
1、正常关闭主库实例,查看数据库切换时间,查询业务恢复时间
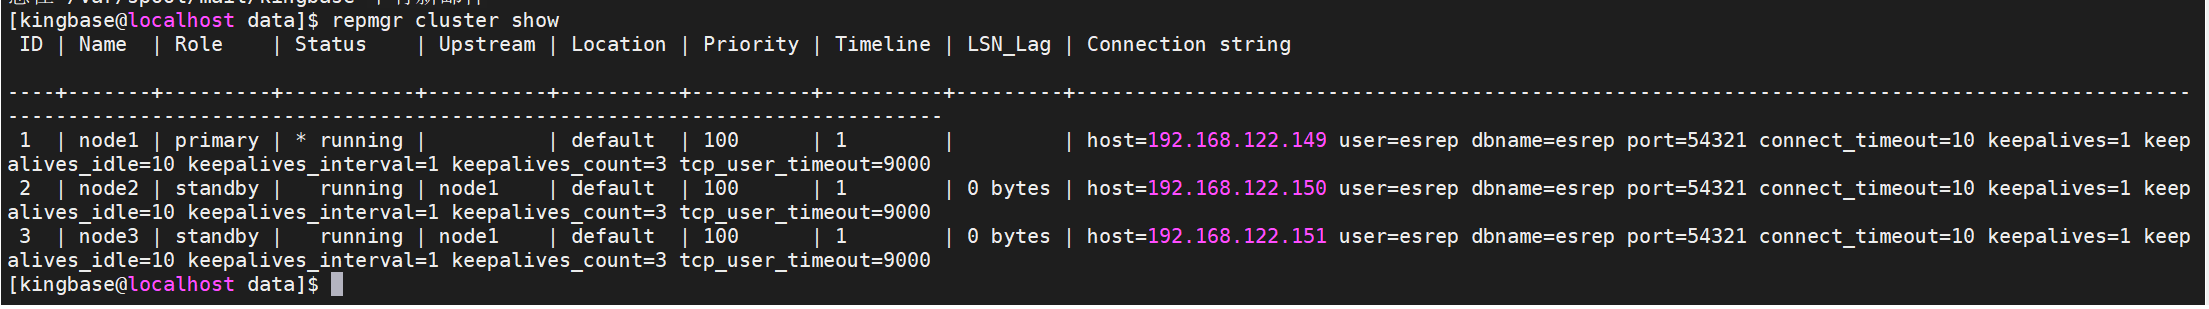
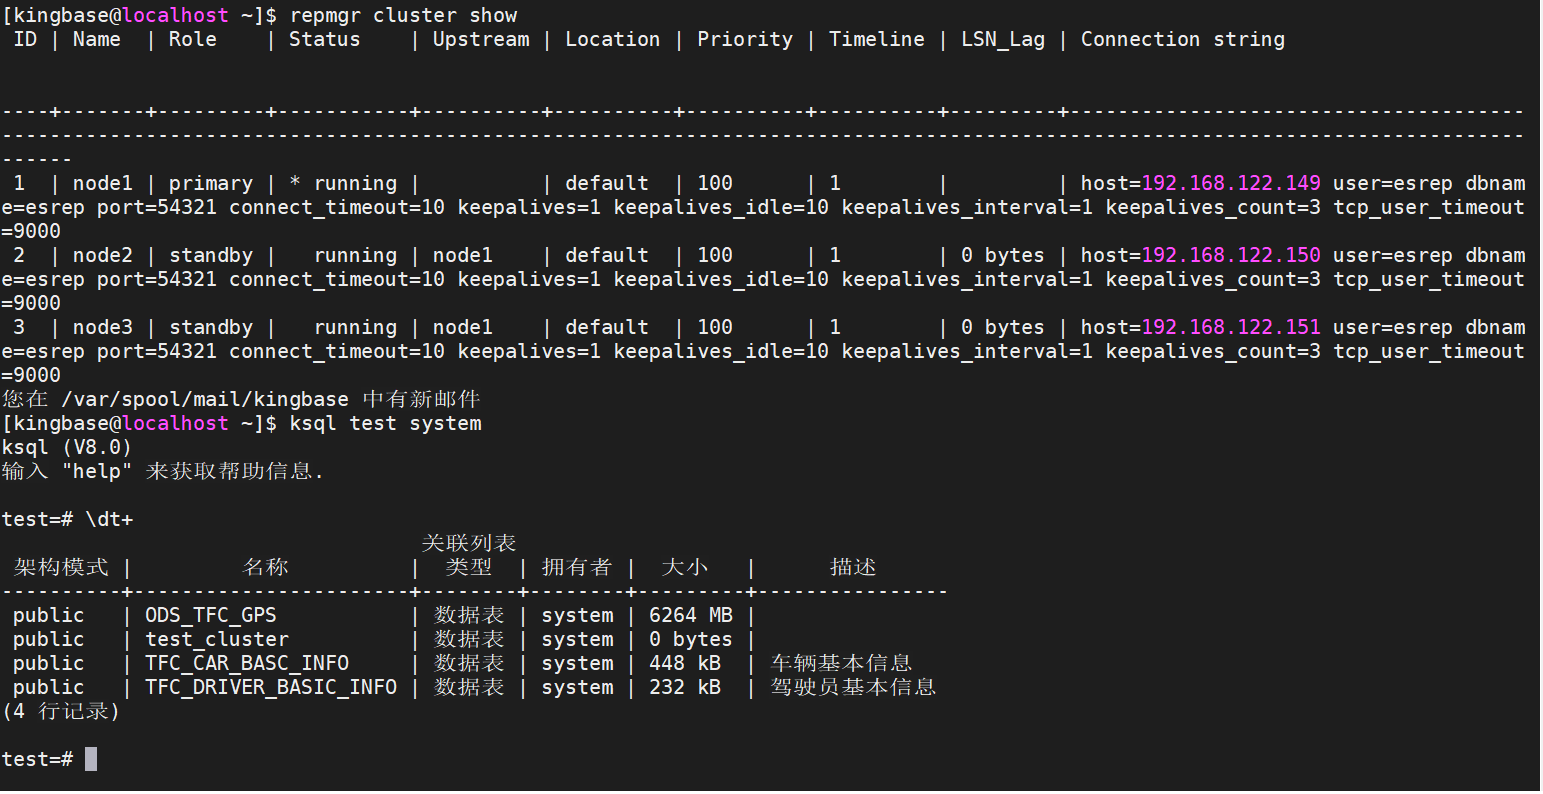
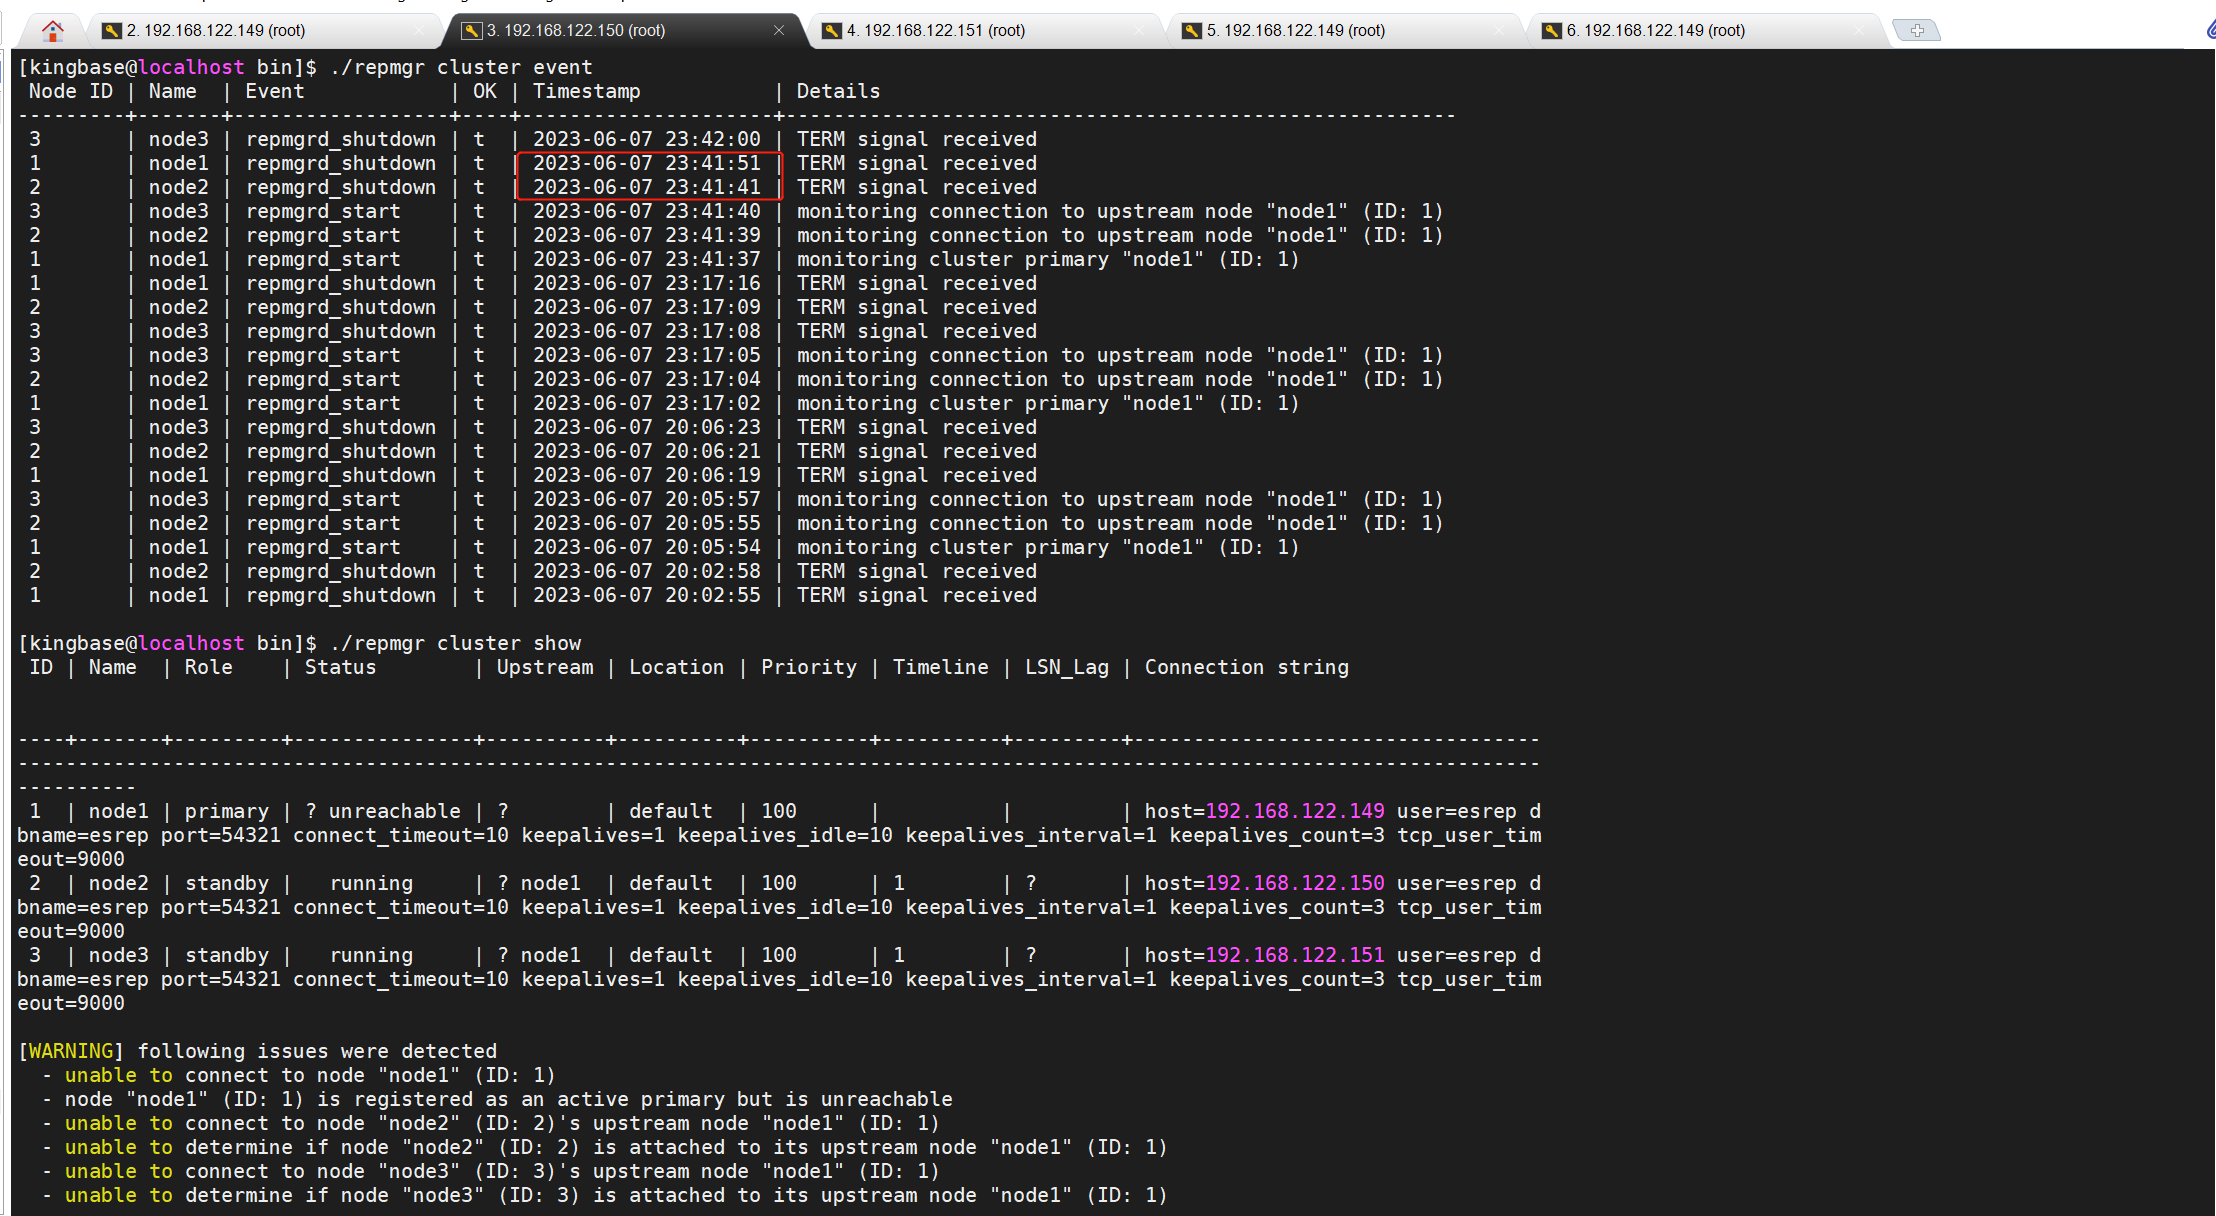
,查看集群状态
--查看集群状态node1为主,node2、node3为备节点
repmgr cluster show
打开jemeter
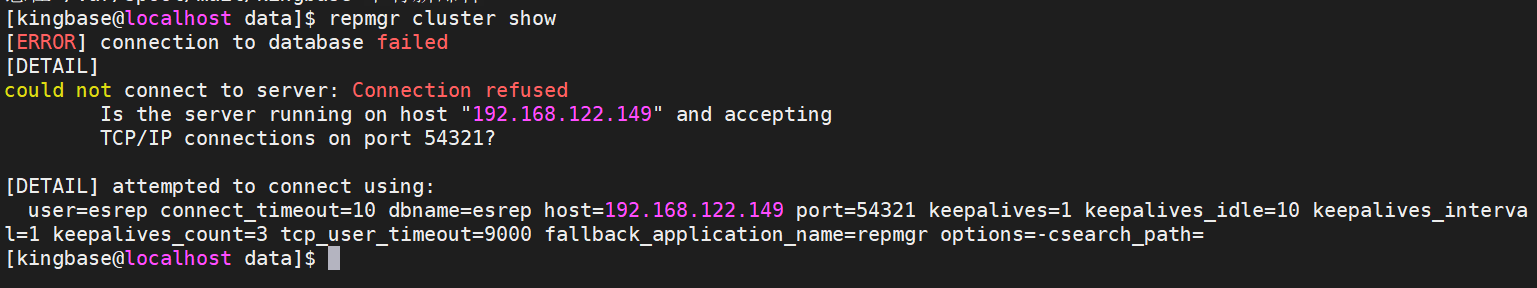
(1) 正常关闭主库实例:
sys_ctl stop -D /home/kingbase/cluster/zyf/R6_HA/kingbase/data
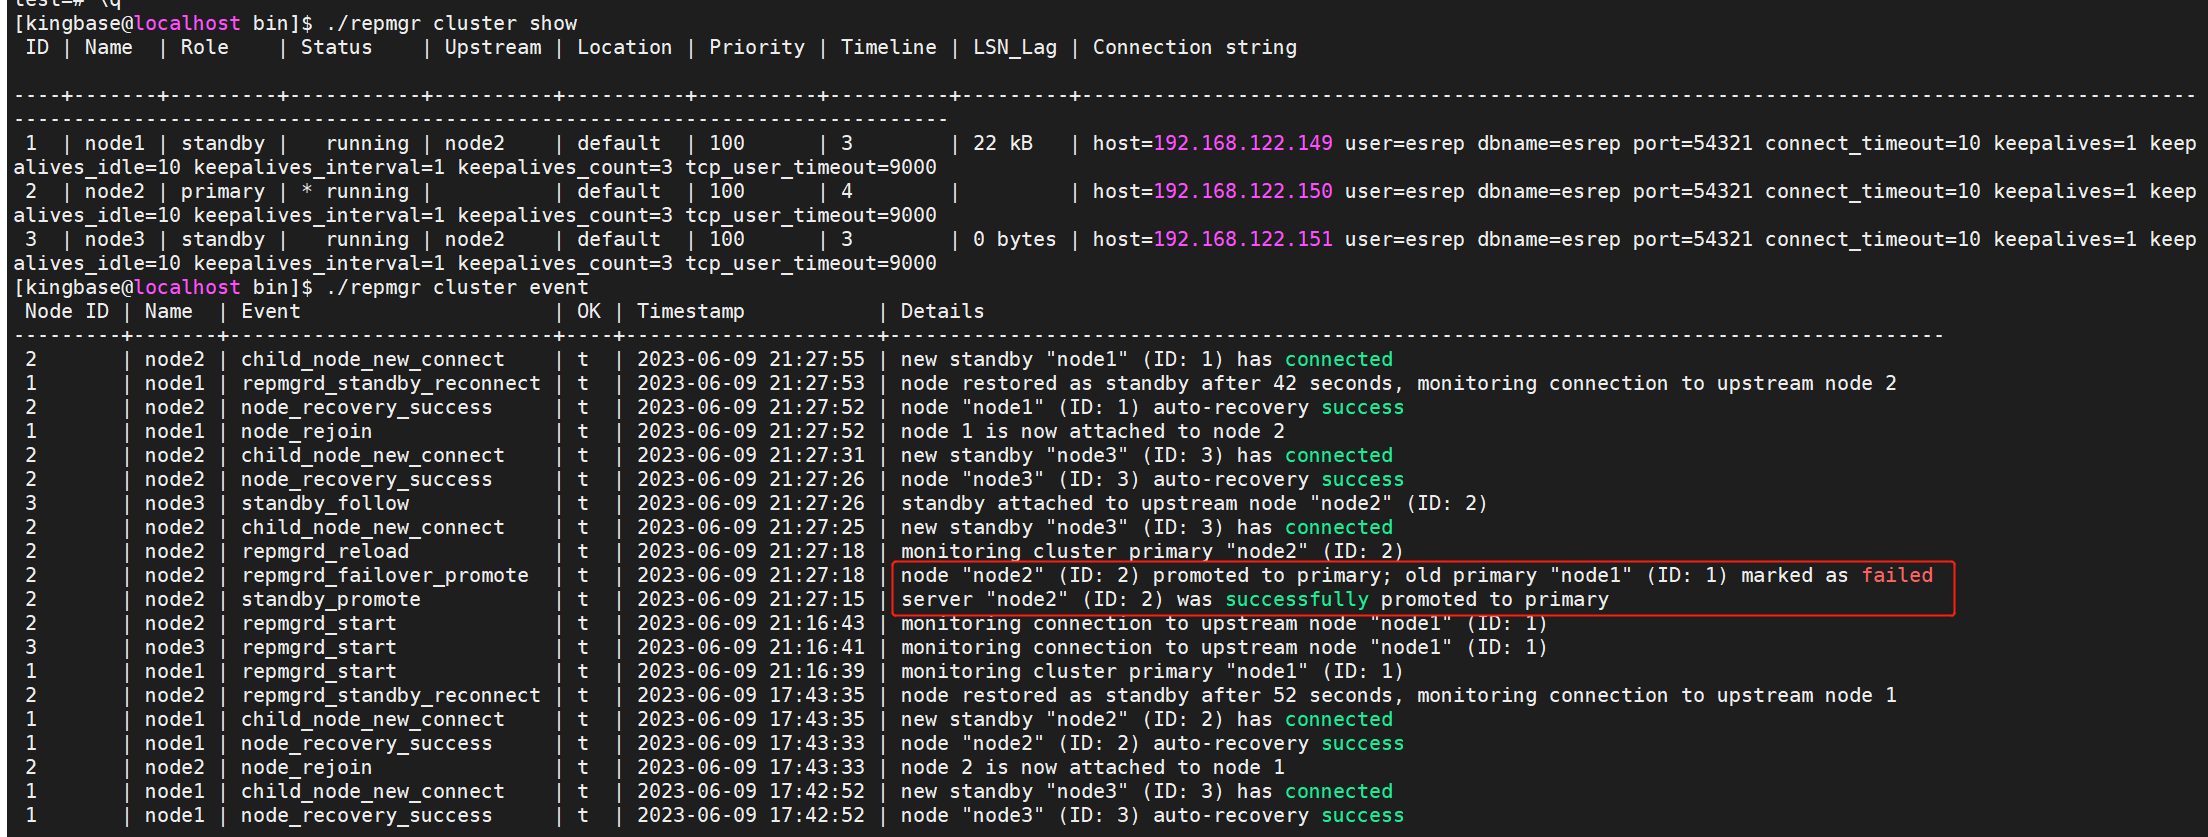
repmgr cluster show
(2)查看数据库切换时间:repmgr cluster event
(3)配置最快切机时间
Repmgr.conf配置文件:
reconnect_attempts=1
reconnect_interval=1 standby_disconnect_on_failover='false' primary_visibility_consensus='false'
connect_info里面配置了connect_timeout=1
配置完成后重启集群生效
(4)启动jemeter开始往库里插入数据
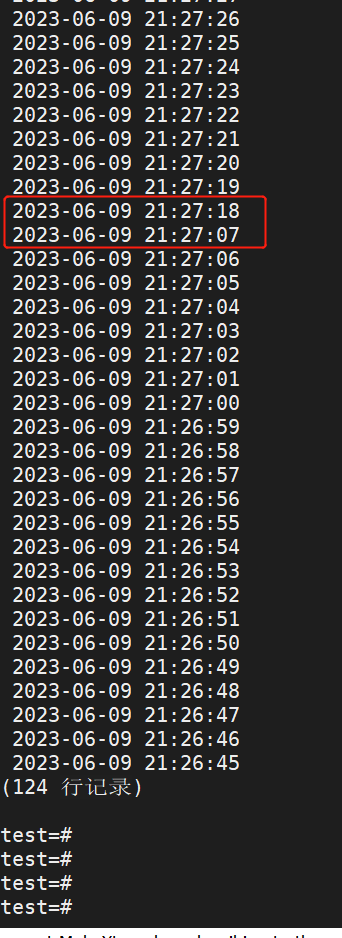
如上图,正常关闭主库,数据恢复插入集群的时间耗时11秒。

 浙公网安备 33010602011771号