

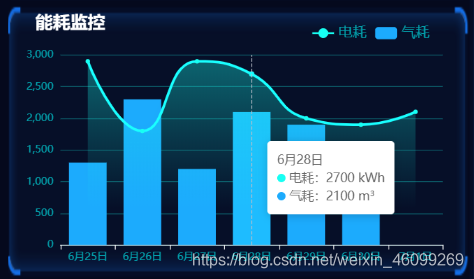
使用Echarts绘制折线与圆柱图
Echarts官网示例:https://echarts.apache.org/examples/zh/index.html
属性参考:https://www.cnblogs.com/1996zy/p/8963385.html
效果图
<template>
	<div id="line" class="pie" style="width: 100%; height: 100%"></div>
</template>

<script>
// 引入 echarts 核心模块,核心模块提供了 echarts 使用必须要的接口。
import * as echarts from "echarts/core"
// 引入柱状图图表,图表后缀都为 Chart
import { LineChart } from "echarts/charts"
// 引入提示框,标题,直角坐标系组件,组件后缀都为 Component
import { TitleComponent, TooltipComponent, GridComponent } from "echarts/components"
// 引入 Canvas 渲染器,注意引入 CanvasRenderer 或者 SVGRenderer 是必须的一步
import { CanvasRenderer } from "echarts/renderers"
import { listAllDayEnergyRecord } from "@/api/energydayRecord.js"

// 注册必须的组件
echarts.use([TitleComponent, TooltipComponent, GridComponent, LineChart, CanvasRenderer])

export default {
    props: {},
    components: {},
    data() {
        return {
            option: {},
            // 电耗数据
            energyData: [],
            // 气耗数据
            gasData: [],
            // 一周日期
            dateData: [],
        }
    },
    computed: {},
    created() { this.getDateData() },
    mounted() {
        this.getEnergyLineData();
        //     window.onresize = function () {
        //     myChart.resize()
        // }
    },
    watch: {},
    methods: {
        setPieEvent() {
            let option = {
            	// 图表标题
                title: {
                    text: "能耗监控",
                    // 标题样式
                    textStyle: {
                        align: "center",
                        color: "#fff",
                        fontSize: 20,
                    },
                    top: "4%",
                    left: "5%",
                },
                tooltip: {
                    trigger: "axis",
                    formatter: function (params) {
                        let name = params[0].name + '<br>';
                        let barName = params[0].marker + params[0].seriesName + ':' + params[0].value + ' kWh' + '<br>';
                        let lineName = params[1].marker + params[1].seriesName + ':' + params[1].value + ' m³';
                        return name + barName + lineName
                    }
                },
                legend: {
                    data: ["电耗", "气耗"],
                    top: "8%",
                    right: "6%",
                    textStyle: {
                        fontSize: 16,
                        color: "rgb(0,253,255,0.6)",
                    },
                },
                grid: {
                    top: "20%",
                    bottom: "5%",
                    left: "4%",
                    right: "4%",
                    containLabel: true,
                },
                xAxis: {
                    type: "category",
                    boundaryGap: true,
                    data: this.dateData,
                    axisLine: {
                        lineStyle: {
                            color: "#fff",
                        },
                    },
                    axisLabel: {
                        color: "rgb(0,253,255,0.6)",
                        formatter: function (params) {
                            return params.split(" ")[0]
                        },
                    },
                },
                yAxis: {
                    name: "",
                    type: "value",
                    axisLabel: {
                        formatter: "{value}",
                        color: "rgb(0,253,255,0.6)",
                    },
                    splitLine: {
                        lineStyle: {
                            color: "rgb(23,255,243,0.3)",
                        },
                    },
                    axisLine: {
                        lineStyle: {
                            color: "#fff",
                        },
                    },
                },

                series: [{
                        name: "电耗",
                        type: "line",
                        color: "rgba(23, 255, 243)",
                        smooth: true,
                        areaStyle: {
                            color: new echarts.graphic.LinearGradient(
                                0,
                                0,
                                0,
                                1,
                                [{
                                        offset: 0,
                                        color: "rgba(23, 255, 243,.5)",
                                    },
                                    {
                                        offset: 0.8,
                                        color: "rgba(23, 255, 243,0)",
                                    },
                                ],
                                false
                            ),
                            shadowColor: "rgba(0, 0, 0, 0.1)",
                            shadowBlur: 10,
                        },
                        symbol: "circle",
                        symbolSize: 5,
                        data: this.energyData,
                    },
                    {
                        name: "气耗",
                        type: "bar",
                        color: "#1cabfd",
                        smooth: true,
                        areaStyle: {
                            color: new echarts.graphic.LinearGradient(
                                0,
                                0,
                                0,
                                1,
                                [{
                                        offset: 0,
                                        color: "#49b9fa",
                                    },
                                    {
                                        offset: 0.8,
                                        color: "rgba(0, 0, 0, 0.1)",
                                    },
                                ],
                                false
                            ),
                            shadowColor: "rgba(0, 0, 0, 0.1)",
                            shadowBlur: 10,
                        },
                        symbol: "circle",
                        symbolSize: 5,
                        data: this.gasData,
                    },
                ],
            }
            const myChart = echarts.init(document.getElementById("line"))
            myChart.setOption(option)
        },
        //获取电能,气能一周数据
        getEnergyLineData() {
            listAllDayEnergyRecord("BENHT-1EN001").then((res) => {
                this.energyData = res.data;
                listAllDayEnergyRecord("BENHT-1EN110").then((res) => {
                    this.gasData = res.data;
                    this.setPieEvent();
                });
            });
        },
        //获取近一周时间
        getDateData() {
            for (let i = -6; i < 1; i++) {
                let date = new Date();
                date.setDate(date.getDate() + i)
                this.dateData.push(date.getMonth() + 1 + "月" + date.getDate() + "日");
            }
        },

    },
}
</script>

<style lang="less" scoped>
.echart-box {
    display: grid;
    grid-template-columns: 1fr 1fr 1fr;
    grid-template-rows: 1fr 1fr;
    z-index: 10000 !important;
    height: 100%;
    width: 100%;

    /*  可通过媒体查询设置响应式
  @media screen and (min-width: 500px) {
    grid-template-columns: 1fr 1fr 1fr;
  }

  @media screen and (min-width: 800px) {
    grid-template-columns: 1fr 1fr 1fr 1fr;
  } */
}

.pie {
    width: 100%;
    height: 100%;
}
</style>

 浙公网安备 33010602011771号