仿Neo4j里的知识图谱,利用d3+vue开发的一个网络拓扑图
项目需要画一个类似知识图谱的节点关系图。
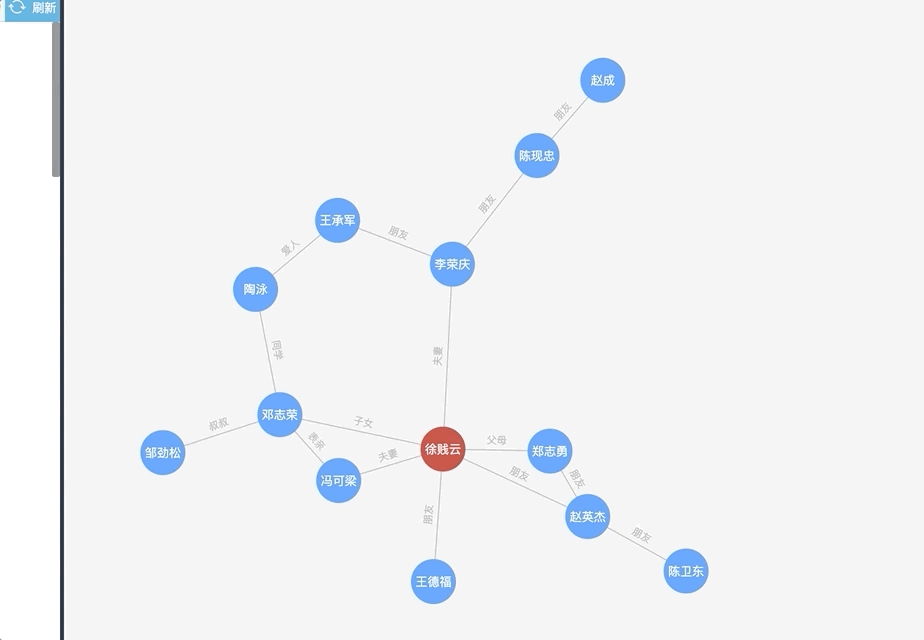
一开始用的是echart画的。
根据https://gallery.echartsjs.com/editor.html?c=xH1Rkt3hkb,成功画出简单的节点关系。
如图:
总结——
【优点】:关系一目了然,可以鼠标悬浮查看相邻节点,其他节点淡化。
【缺点】:拖动结果不理想,尤其是数据过多时,一旦拖动一个,整个页面所有的节点都在动,很久都无法停止(可能是我配置方法不对,但是后续没找到解决方法)
于是转而使用d3力导图。
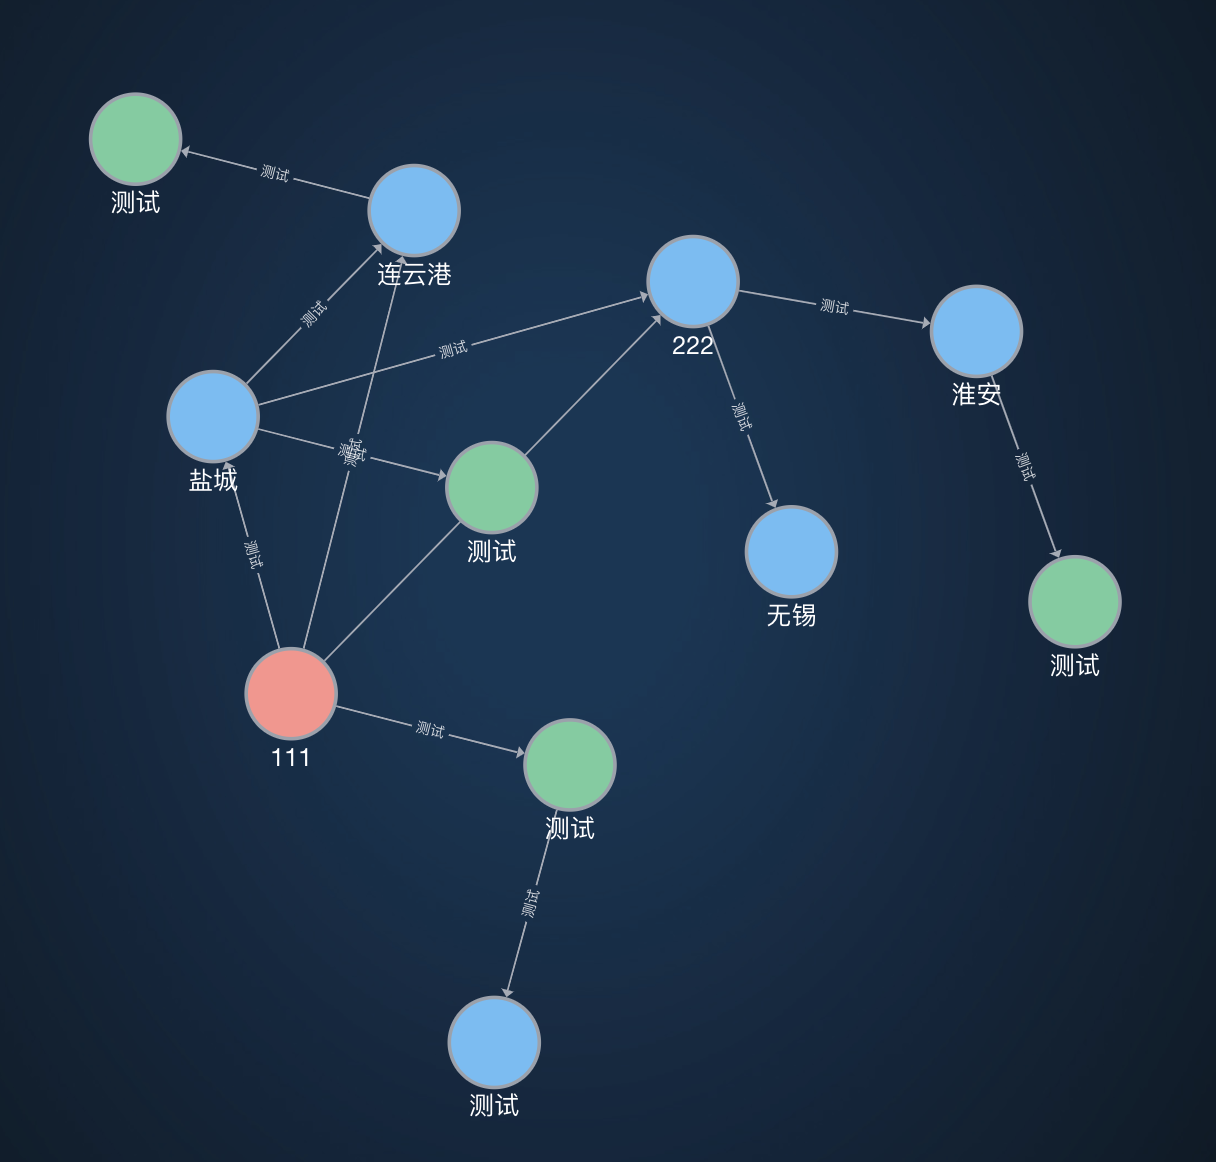
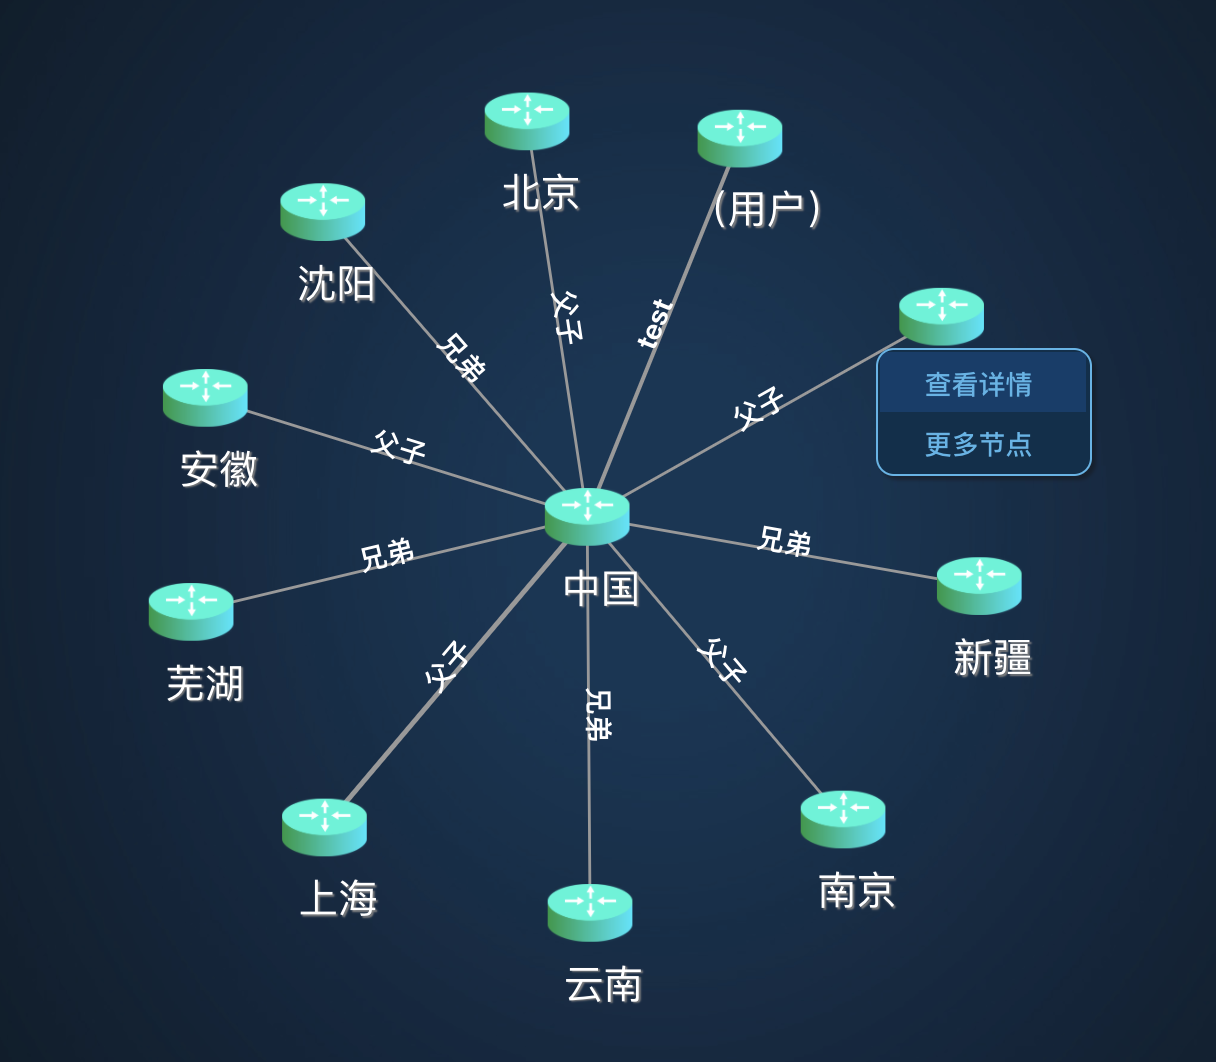
除了基本的节点展示和拖动之外,还可以双击新增节点,以及右击展示节点详情。
核心操作有以下:
1、绘制graph力
var simulation = d3
        .forceSimulation(nodes)
        .force(
          'collide',
          d3
            .forceCollide()
            .radius(() => 30)
            .iterations(2)
        )
        .force(
          'charge',
          d3
            .forceManyBody()
            // .distanceMax(300)
            .strength(-400)
        )
        .force(
          'link',
          d3
            .forceLink(links)
            .id(d => d.id)
            .distance(100)
        )
        .force('center', d3.forceCenter(this.width / 2, this.height / 2))
      // .force('x', d3.forceX(this.width / 2))
      // .force('y', d3.forceY(this.height / 2))
2、绘制存放节点和关系的svg
var svgArea = d3
        .select('.containers')
        .append('svg')
        .attr('viewBox', [0, 0, this.width, this.height])
        .attr('class', 'd3Test')
        .call(
          d3.zoom().on('zoom', function() {
            g.attr('transform', d3.event.transform)
          })
        )
        .on('dblclick.zoom', () => {}) // 禁止双击放大
const g = this.svgArea.append('g').attr('class', 'content')
3、绘制节点关系
var links = g
        .append('g')
        .attr('class', 'links')
        .selectAll('path')
        .data(links, function(d) {
          if (typeof d.source === 'object') {
            return d.source.name + '_' + d.relationship + '_' + d.target.name
          } else {
            return d.source + '_' + d.relationship + '_' + d.target
          }
        })
        .join('path')
        .attr('stroke-width', d => Math.sqrt(d.value))
        .attr('class', 'link')
        .attr('id', function(d) {
          if (typeof d.source === 'object') {
            return d.source.name + '_' + d.relationship + '_' + d.target.name
          } else {
            return d.source + '_' + d.relationship + '_' + d.target
          }
        })
4、绘制节点
var nodes = g
        .append('g')
        .attr('class', 'nodes')
        .selectAll('circle')
        .data(nodes, d => d.name)
        .join('circle')
        .attr('r', d => (d.number ? d.number : 20))
        .attr('class', 'node')
        .attr('stroke', '#fff')
        .attr('stroke-width', 1.5)
        .attr('fill', this.color)
        .on('dblclick', this.dbclickNode)//双击节点事件
        .on('click', this.clickNode)//单击节点触发事件
        // .on('mouseover', this.mouseoverNode)
        // .on('mouseout', this.mouseoutNode)
        .call(this.drag(this.simulation))
nodes.append('title').text(d => d.name)
5、然后还有个让节点缓慢停止下来的tick
 this.simulation.on('tick', () => {
        this.links.attr('d', function(d) {
          if (d.source.x < d.target.x) {
            return (
              'M ' +
                            d.source.x +
                            ' ' +
                            d.source.y +
                            ' L ' +
                            d.target.x +
                            ' ' +
                            d.target.y
            )
          } else {
            return (
              'M ' +
                            d.target.x +
                            ' ' +
                            d.target.y +
                            ' L ' +
                            d.source.x +
                            ' ' +
                            d.source.y
            )
          }
        })

        this.nodes
          .attr('cx', function(d) {
            if (d.fixed) {
              d.fx = nodes[d.index].x
            }
            return d.x
          })
          .attr('cy', function(d) {
            if (d.fixed) {
              d.fy = nodes[d.index].y
            }
            return d.y
          })

        this.nodesName.attr('x', d => d.x).attr('y', d => d.y)
      })
附上官网案例:https://observablehq.com/@d3/force-directed-graph
这个案例的版本好像比较老,个人建议用新版,不过新版的API有改动。
参考案例:https://eisman.github.io/neo4jd3/
知识点汇总:
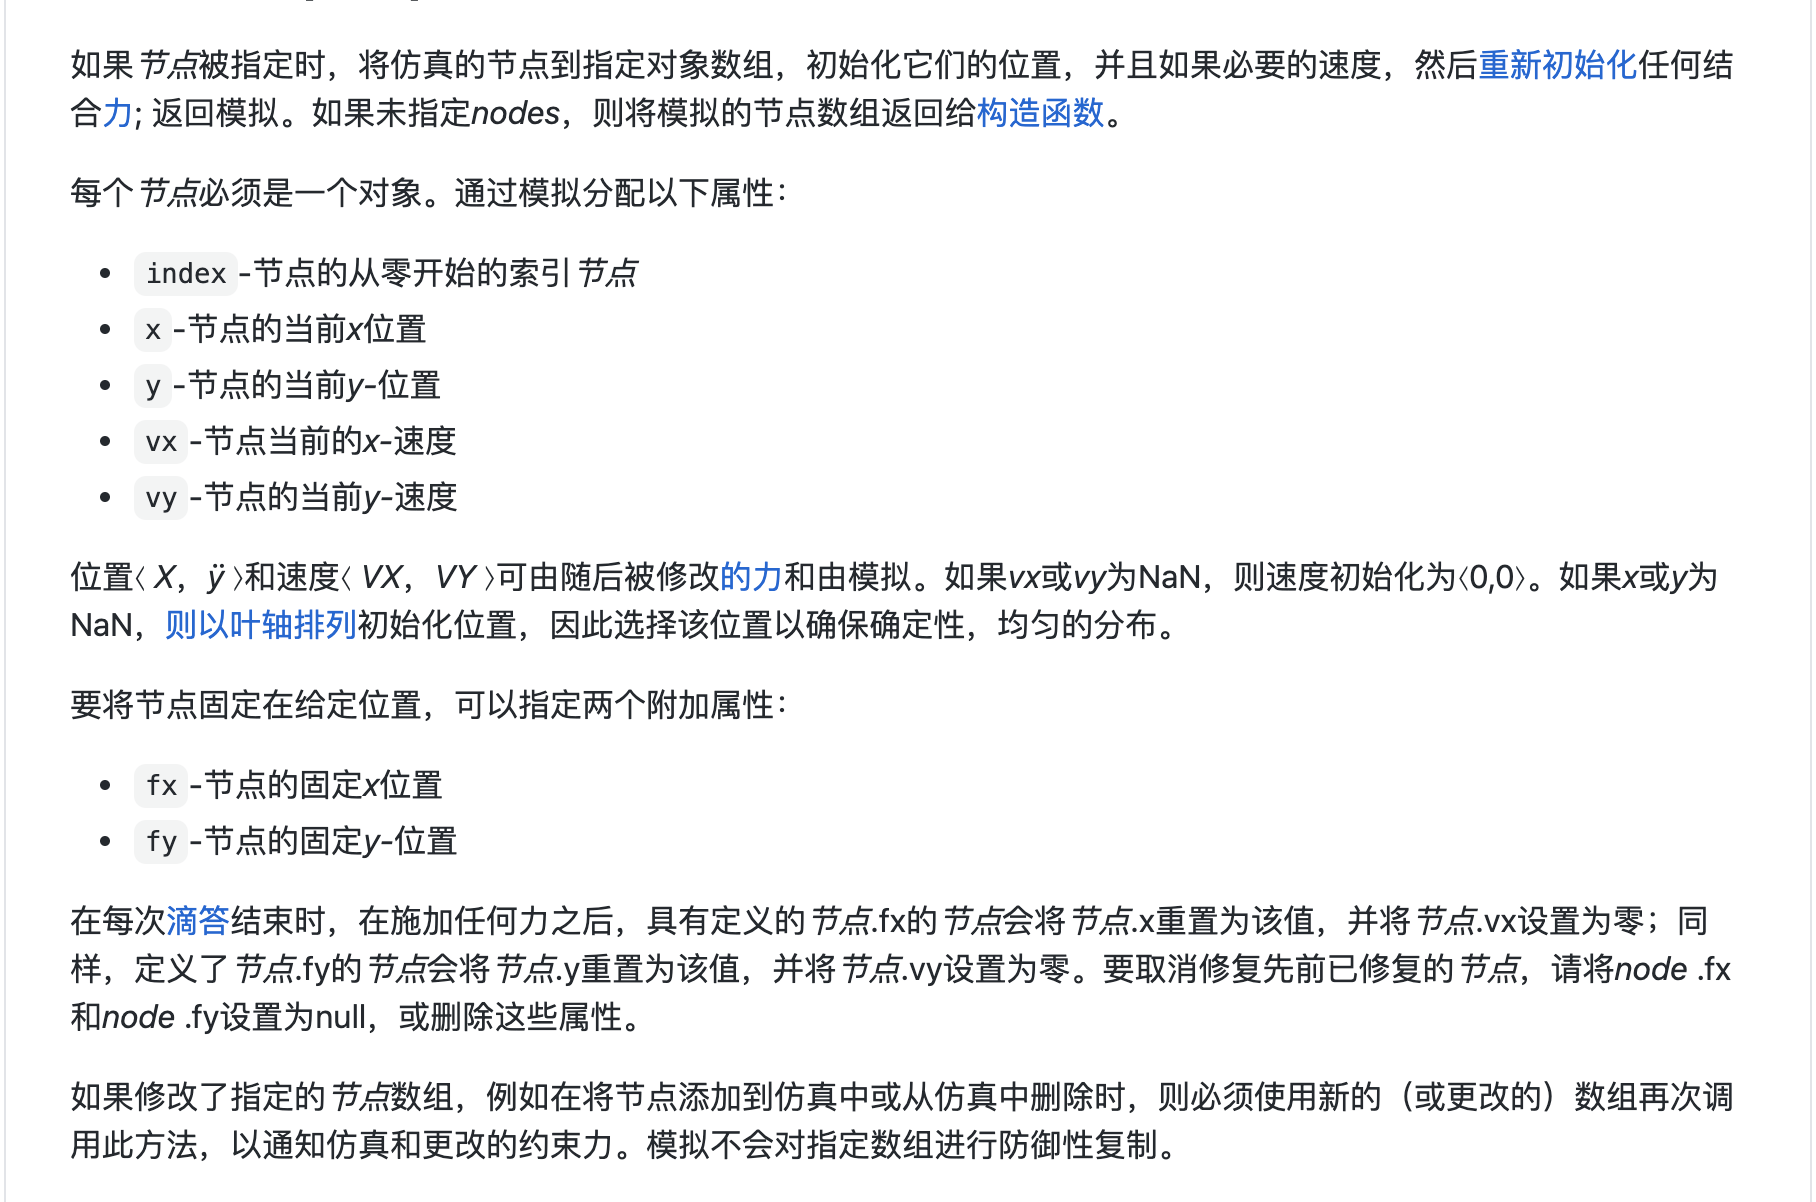
关于x,y,vx,vy,fx,fy
浅喜似苍狗,深爱如长风

 浙公网安备 33010602011771号