爬取奥运奖牌榜前20名
一、选题背景
我对于奥运会的奖牌数比较关注,可能是比较热爱运动带来的一种习惯,爬虫在python应用广泛,人人皆知,很适应于了解一些内容。2022年的奥运会也即将开始了,在社会上能够让人们快速地知道奖牌数的排行,经济上符合了当下的情景,网上的数据直观通俗易懂,也是人们常关注的平台。我的预期目标是爬取2008奥运奖牌榜的前十名次。
二、主题式网络爬虫设计方案
1.主题式网络爬虫名称
爬取2008奥运奖牌榜前二十名
2.主题式网络爬虫爬取的内容与数据特征分析
爬取内容:爬取网页排名,国家/地区,总数。
3.主题式网络爬虫设计方案概述
方案概述:访问网页得到状态码200,分析网页源代码,找出所需要的的标签,逐个提取标签保存到相同路径csv文件中,读取改文件,进行数据清洗,数据模型分析,数据可视化处理,绘制分布图,用最小二乘法分析两个变量间的二次拟合方程和绘制拟合曲线。
技术难点:做数据分析,即求回归系数,因为国家/地区是文字,无法与数字作比较,需要把国家/地区这一列删除才可。由于不明原因,输出结果经常会显示超出列表范围。
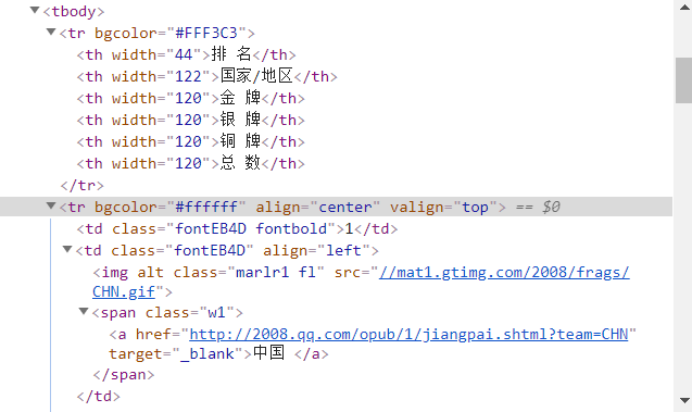
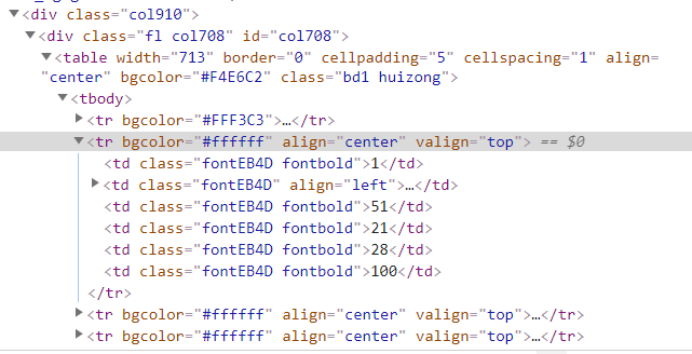
三、主题页面的结构特征分析
1.主题页面的结构特征:https://cq.qq.com/c/ayjpb/index.htm
通过开发人员选项查看,它的第一行标题是独立出来的。第一行标签:’th.width’,剩余的行标签:’td.class’;但国家/地区这一列的标签有变化,它含有图片和中文:中文标签:’span.class’。
2. 页面解析
3.
F12 (右击检查)
使用鼠标进行滑动选择想找的
控制键+上档键+c
注:类似在电脑中打开某盘某文件夹查找某文件。
四、
1.
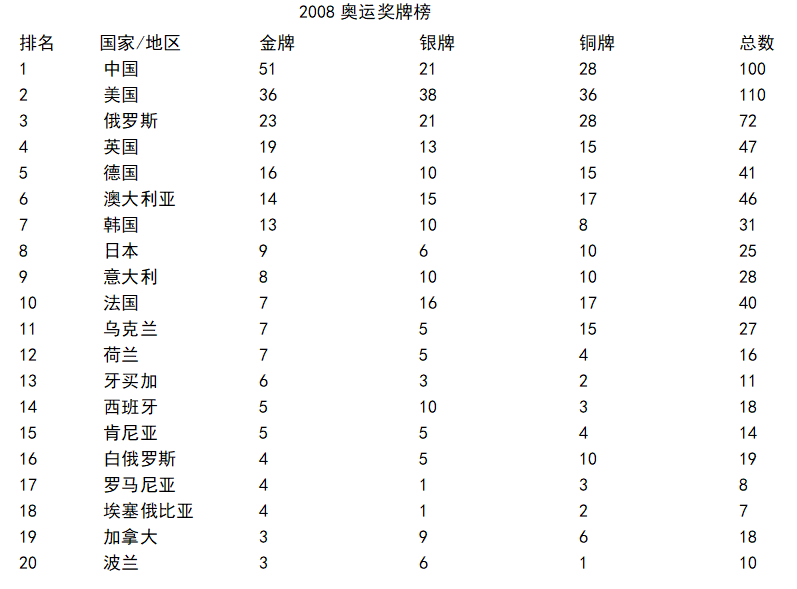
 1 #获取html网页
 2 url = 'https://www.sogou.com/link?url=6YUuC6e6hWa2n28n1HKKbDfznB86Obg4_EP5ocOcjDS8H3hzb6JqFQ..'
 3 header={
 4     'User-Agent': 'Mozilla/5.0 (Windows NT 10.0; WOW64) AppleWebKit/537.36 (KHTML, like Gecko) Chrome/78.0.3904.108 Safari/537.36',
 5     'Referer': 'https://cq.qq.com/c/ayjpb/index.htm'}
 6 #请求超时时间为30秒
 7 r = requests.get(url,timeout = 30,headers=header)
 8 #如果状态码不是200,则引发日常
 9 r.raise_for_status()
10 #配置编码
11 r.encoding = r.apparent_encoding
12 #获取源代码
13 r.text
14 html=r.text
15 soup=BeautifulSoup(html,'html.parser')
16 title = soup.find_all('a', class_='list-title')
17 point = soup.find_all('span', class_='icon-rise')
18 print('{:^55}'.format('2008奥运奖牌榜'))
19 print('{:^44}\t{:^122}\t{:^120}'.format('排名', '国家/地区',’总数’))
20 num = 20
21 lst = []
22 for i in range(num):
23     print('{:^44}\t{:^122}\t{:^120}\t{:^120}\t{:^120}\t{:^120}\t{:^120}'.format(i+1, title[i].string, point[i].string))
24     lst.append([i+1,title[i].string,point[i].string])
25 df = pd.DataFrame(lst,columns=['排名','国家/地区',’总数’])
26 rank = r'rank.xlsx'
27 df.to_excel(rank)
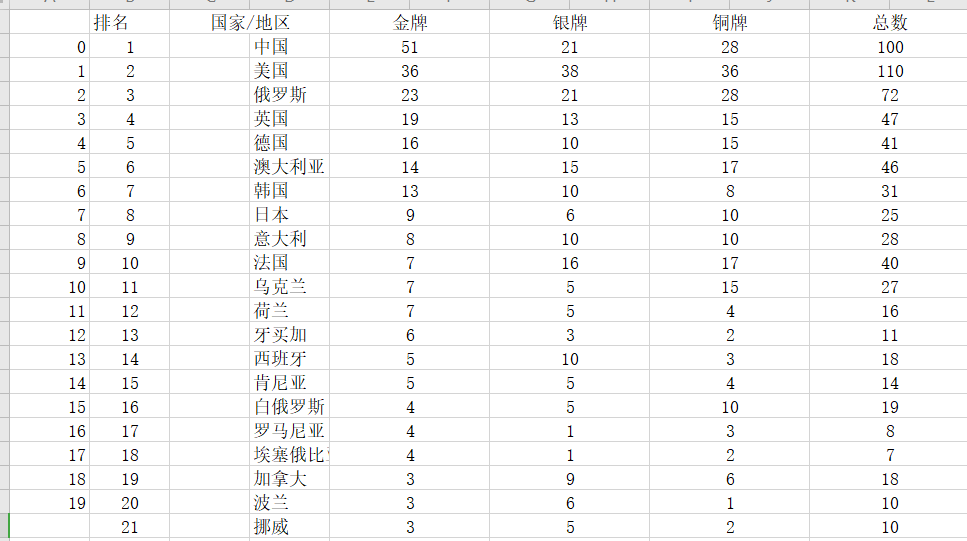

2.
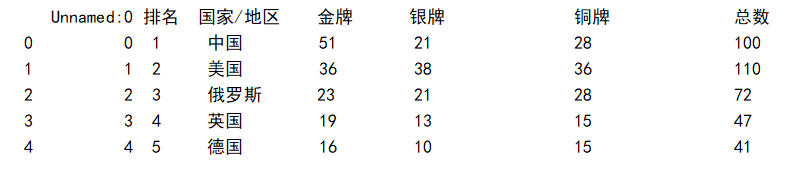
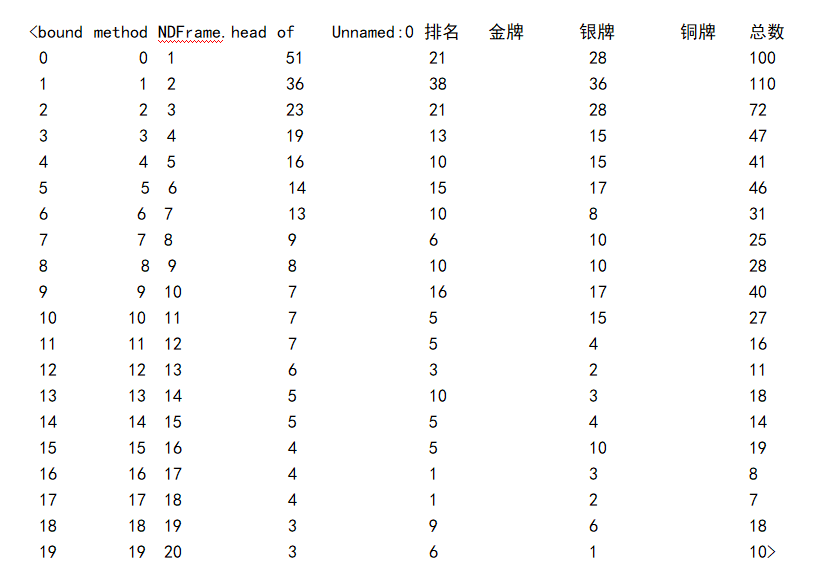
1 #读取csv文件
2 rank=pd.DataFrame(pd.read_excel('rank.xlsx'))
3 print(rank.head())
3.
1 #删除无效列
2 #rank.drop('国家/地区',axis=1,inplace=True)
3 #print(rank.head)
4.
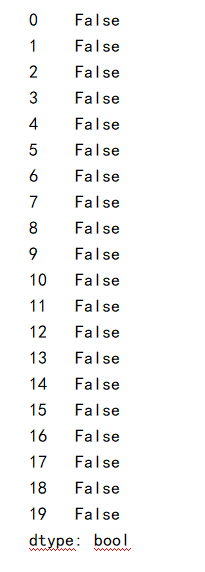
1 #检查是否有重复值
2 print(rank.duplicated())
5.
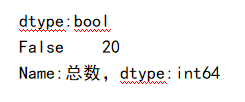
1 #检查是否有空值
2 print(rank['总数'].isnull().value_counts())
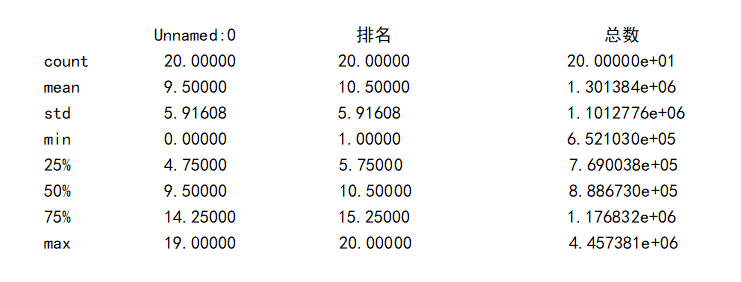
6.
1 #异常值处理
2 print(rank.describe())
3 #发现“热度”字段的最大值为4457381而平均值为1301384,假设异常值为4457381
4 print(top.replace([4457381,top['热度'].mean()]))
7.
1 #数据分析
2 from sklearn.linear_model import LinearRegression
3 X = df.drop("国家/地区",axis=1)
4 predict_model = LinearRegression()
5 predict_model.fit(X,df['总数'])
6 print("回归系数为:",predict_model.coef_)

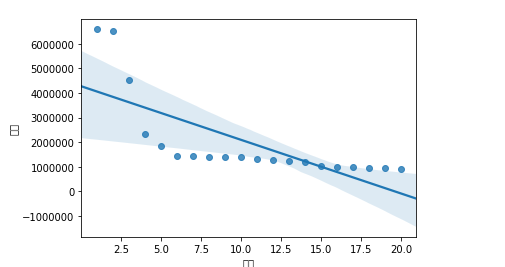
8.
1 #绘制排名与热度的回归图
2 import seaborn as sns
3 sns.regplot(rank_df.排名,rank_df.总数)
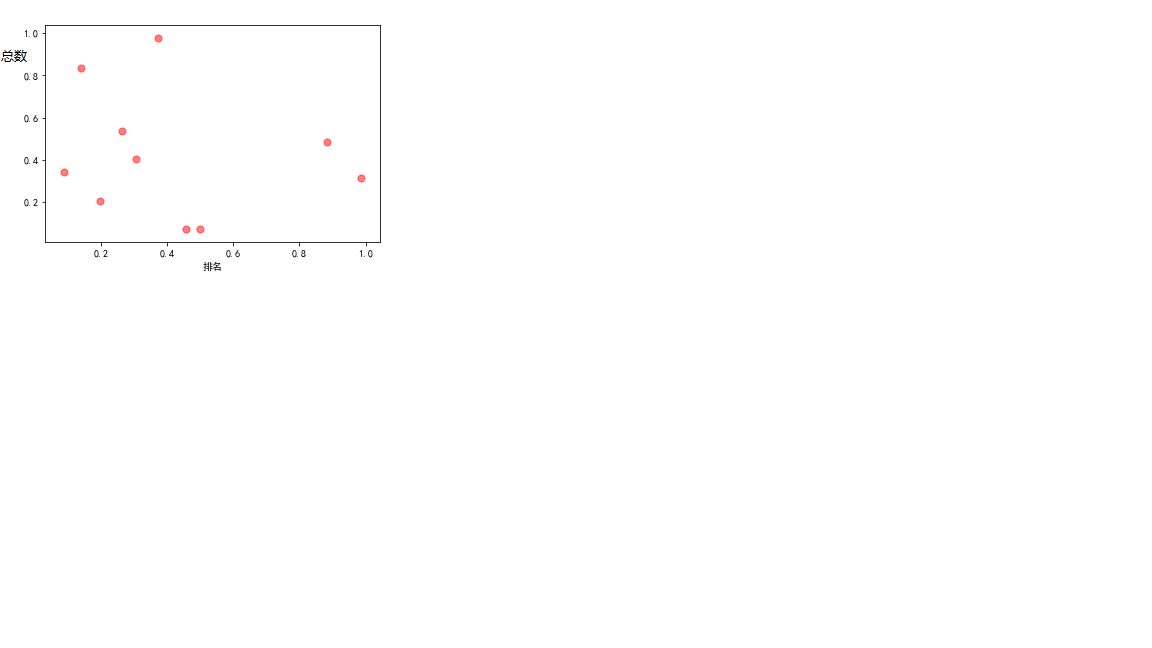
9.
 1 #画出散点图
 2 plt.rcParams['font.sans-serif'] = ['SimHei']  # 用来正常显示中文标签
 3 plt.rcParams['axes.unicode_minus'] = False  # 用来正常显示负号
 4 N=10
 5 x=np.random.rand(N)
 6 y=np.random.rand(N)
 7 size=50
 8 plt.xlabel("排名")
 9 plt.ylabel("总数")
10 plt.scatter(x,y,size,color='r',alpha=0.5,marker="o")
11 #散点图  kind='reg'
12 sns.jointplot(x="排名",y="总数",data=rank,kind='reg')
13 #  kind='hex'
14 sns.jointplot(x="排名",y="总数",data=rank,kind='hex')
15 # kind='kde'
16 sns.jointplot(x="排名",y="总数",data=rank,kind="kde",space=0,color='g')


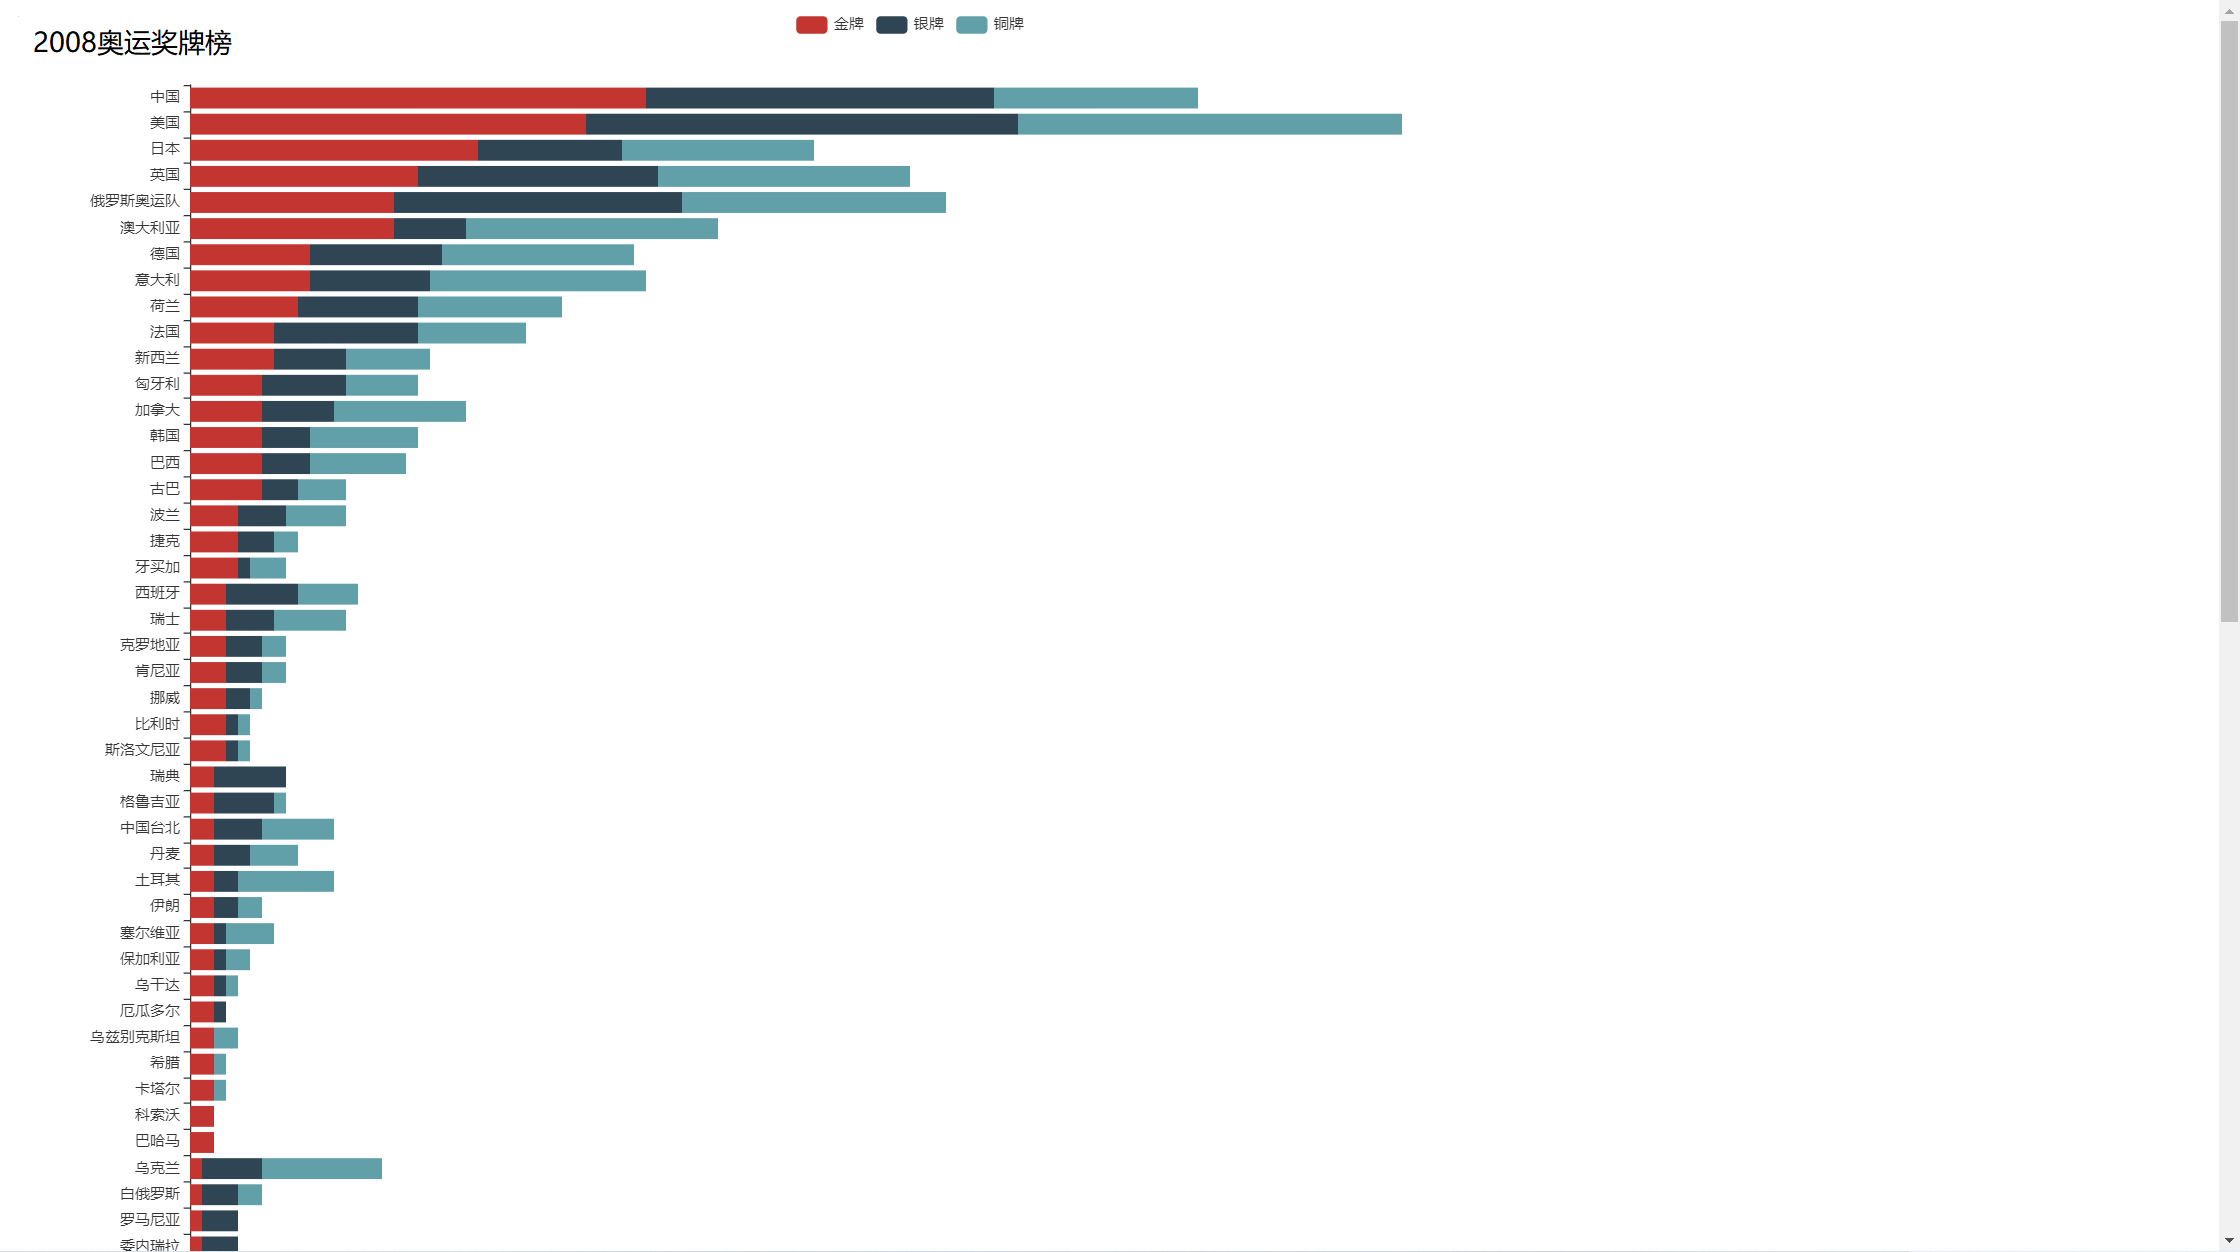
数据处理
 1 #声明x轴y轴的数据
 2
 3     tGold = []
 4     tSilver = []
 5     tBronze = []
 6     tCountryName = []
 7
 8     for i in Medallist:
 9         tGold.append(i['gold'])
10         tSilver.append(i['silver'])
11         tBronze.append(i['bronze'])
12         tCountryName.append(i['countryname'])
13
14 #调用Pyecharts 生成条形图
15
16 c = (
17         Bar(init_opts=opts.InitOpts(width='1440px',height='2000px'))
18             .add_yaxis("金牌", tGold, stack="stack1")
19             .add_yaxis("银牌", tSilver, stack="stack1")
20             .add_yaxis("铜牌", tBronze, stack="stack1")
21             .add_xaxis(tCountryName)
22             .reversal_axis()
23             .set_series_opts(label_opts=opts.LabelOpts(is_show=False))
24             .set_global_opts(title_opts=opts.TitleOpts(title="2008奥运奖牌榜"),
25                              yaxis_opts=opts.AxisOpts(is_inverse=True)
26                              )
27     )
28     c.render("MedalList.html")
10.
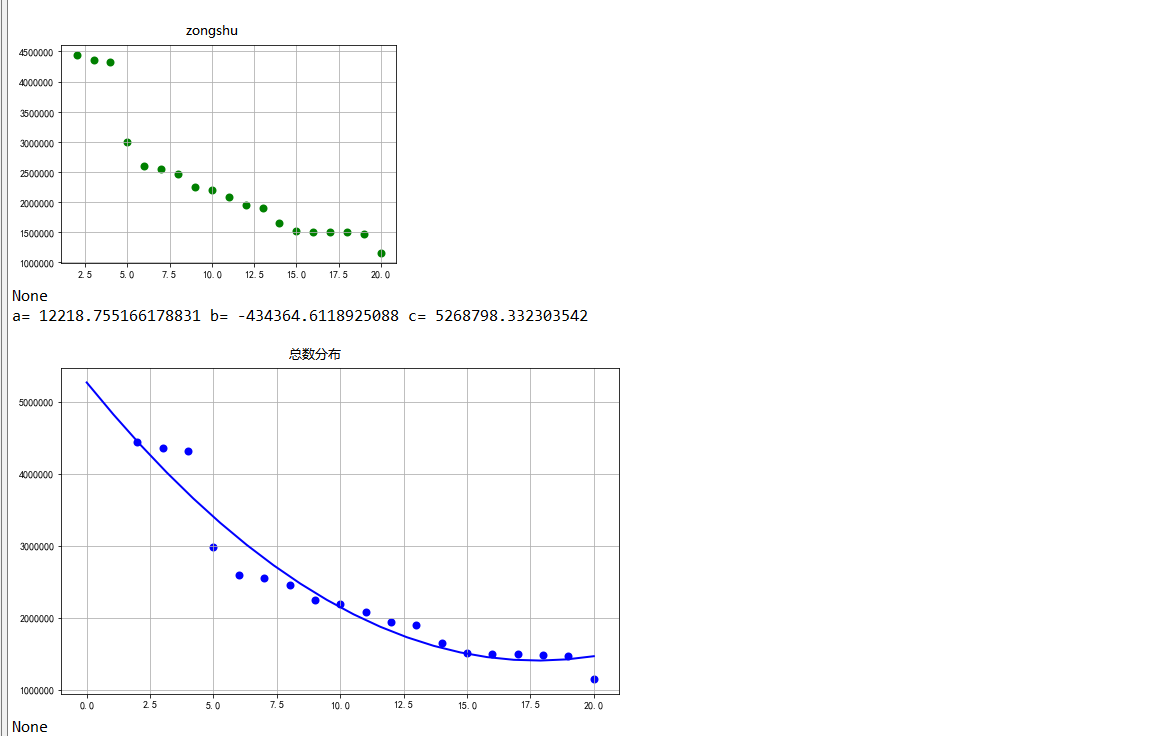
 1 #选择排名和总数两个特征变量,绘制分布图,用最小二乘法分析两个变量间的二次拟合方程和拟合曲线
 2 colnames=[" ","排名","国家/地区","总数"]
 3 df = pd.read_excel('rank.xlsx',skiprows=1,names=colnames)
 4 X = df.排名
 5 Y = df.总数
 6 Z = df.国家/地区
 7 def A():
 8     plt.scatter(X,Y,color="blue",linewidth=2)
 9     plt.title("RM scatter",color="blue")
10     plt.grid()
11     plt.show()
12 def B():
13     plt.scatter(X,Y,color="green",linewidth=2)
14     plt.title("redu",color="blue")
15     plt.grid()
16     plt.show()
17 def func(p,x):
18     a,b,c=p
19     return a*x*x+b*x+c
20 def error(p,x,y):
21     return func(p,x)-y
22 def main():
23     plt.figure(figsize=(10,6))
24     p0=[0,0,0]
25     Para = leastsq(error,p0,args=(X,Y))
26     a,b,c=Para[0]
27     print("a=",a,"b=",b,"c=",c)
28     plt.scatter(X,Y,color="blue",linewidth=2)
29     x=np.linspace(0,20,20)
30     y=a*x*x+b*x+c
31     plt.plot(x,y,color="blue",linewidth=2,)
32     plt.title("总数分布")
33     plt.grid()
34     plt.show()
35 print(A())
36 print(B())
完整代码
  1 #获取html网页
  2 url = 'https://www.sogou.com/linkurl=6YUuC6e6hWa2n28n1HKKbDfznB86Obg4_EP5ocOcjDS8H3hzb6JqFQ..'
  3
  4 header={
  5
  6     'User-Agent': 'Mozilla/5.0 (Windows NT 10.0; WOW64) AppleWebKit/537.36 (KHTML, like Gecko) Chrome/78.0.3904.108 Safari/537.36',
  7     'Referer': 'https://cq.qq.com/c/ayjpb/index.htm'}
  8
  9
 10 #请求超时时间为30秒
 11
 12
 13 r = requests.get(url,timeout = 30,headers=header)
 14
 15
 16 #如果状态码不是200,则引发日常
 17
 18
 19 r.raise_for_status()
 20
 21
 22 #配置编码
 23
 24
 25 r.encoding = r.apparent_encoding
 26
 27
 28 #获取源代码
 29
 30
 31 r.text
 32
 33 html=r.text
 34
 35 soup=BeautifulSoup(html,'html.parser')
 36
 37 title = soup.find_all('a', class_='list-title')
 38
 39 point = soup.find_all('span', class_='icon-rise')
 40
 41
 42 print('{:^55}'.format('2008奥运奖牌榜'))
 43
 44 print('{:^44}\t{:^122}\t{:^120}'.format('排名', '国家/地区',’总数’))
 45
 46
 47 num = 20
 48
 49 lst = []
 50
 51
 52 for i in range(num):
 53
 54
 55
 56 print('{:^44}\t{:^122}\t{:^120}\t{:^120}\t{:^120}\t{:^120}\t{:^120}'.format(i+1, title[i].string, point[i].string))
 57
 58     lst.append([i+1,title[i].string,point[i].string])
 59
 60 df = pd.DataFrame(lst,columns=['排名','国家/地区',’总数’])
 61
 62 rank = r'rank.xlsx'
 63
 64 df.to_excel(rank)
 65
 66
 67 #读取csv文件
 68
 69
 70 rank=pd.DataFrame(pd.read_excel('rank.xlsx'))
 71
 72 print(rank.head())
 73
 74
 75 #删除无效列
 76
 77
 78 rank.drop('国家/地区',axis=1,inplace=True)
 79
 80
 81 #print(rank.head)
 82
 83
 84
 85 #检查是否有重复值
 86
 87
 88 print(rank.duplicated())
 89
 90 #检查是否有空值
 91
 92
 93 print(rank['总数'].isnull().value_counts())
 94
 95
 96  #异常值处理
 97
 98
 99 print(rank.describe())
100
101
102 #发现“热度”字段的最大值为4457381而平均值为1301384,假设异常值为4457381
103
104
105 print(top.replace([4457381,top['热度'].mean()]))
106
107
108
109 #数据分析
110
111
112
113 from sklearn.linear_model import LinearRegression
114
115
116 X = df.drop("国家/地区",axis=1)
117
118
119 predict_model = LinearRegression()
120
121
122 predict_model.fit(X,df['总数'])
123
124
125
126 print("回归系数为:",predict_model.coef_)
127
128
129 #绘制排名与热度的回归图
130
131
132 import seaborn as sns
133
134
135 sns.regplot(rank_df.排名,rank_df.总数)
136
137
138 #画出散点图
139
140
141 # 用来正常显示中文标签
142
143
144 plt.rcParams['font.sans-serif'] = ['SimHei']
145
146
147 # 用来正常显示负号
148
149
150 plt.rcParams['axes.unicode_minus'] = False
151
152
153 N=10
154
155
156 x=np.random.rand(N)
157
158
159 y=np.random.rand(N)
160
161
162 size=50
163
164
165 plt.xlabel("排名")
166
167
168 plt.ylabel("总数")
169
170
171 plt.scatter(x,y,size,color='r',alpha=0.5,marker="o")
172
173
174
175 #散点图  kind='reg'
176
177
178 sns.jointplot(x="排名",y="总数",data=rank,kind='reg')
179
180
181 #  kind='hex'
182
183
184 sns.jointplot(x="排名",y="总数",data=rank,kind='hex')
185
186
187 # kind='kde'
188
189
190 sns.jointplot(x="排名",y="总数",data=rank,kind="kde",space=0,color='g')
191
192
193
194 #声明x轴y轴的数据
195
196     tGold = []
197
198     tSilver = []
199
200     tBronze = []
201
202     tCountryName = []
203
204
205     for i in Medallist:
206
207         tGold.append(i['gold'])
208
209         tSilver.append(i['silver'])
210
211         tBronze.append(i['bronze'])
212
213         tCountryName.append(i['countryname'])
214
215 #调用Pyecharts 生成条形图
216
217 c = (
218
219         Bar(init_opts=opts.InitOpts(width='1440px',height='2000px'))
220
221             .add_yaxis("金牌", tGold, stack="stack1")
222
223             .add_yaxis("银牌", tSilver, stack="stack1")
224
225             .add_yaxis("铜牌", tBronze, stack="stack1")
226
227             .add_xaxis(tCountryName)
228
229             .reversal_axis()
230
231             .set_series_opts(label_opts=opts.LabelOpts(is_show=False))
232
233             .set_global_opts(title_opts=opts.TitleOpts(title="2008奥运奖牌榜"),
234
235                              yaxis_opts=opts.AxisOpts(is_inverse=True)
236
237                              )
238     )
239
240     c.render("MedalList.html")
241
242
243 #选择排名和总数两个特征变量,绘制分布图,用最小二乘法分析两个变量间的二次拟合方程和拟合曲线
244
245
246 colnames=[" ","排名","国家/地区","总数"]
247
248
249 df = pd.read_excel('rank.xlsx',skiprows=1,names=colnames)
250
251
252 X = df.排名
253
254
255 Y = df.总数
256
257
258 Z = df.国家/地区
259
260
261 def A():
262
263
264     plt.scatter(X,Y,color="blue",linewidth=2)
265
266
267     plt.title("RM scatter",color="blue")
268
269
270     plt.grid()
271
272
273     plt.show()
274
275
276
277 def B():
278
279
280     plt.scatter(X,Y,color="green",linewidth=2)
281
282
283     plt.title("redu",color="blue")
284
285
286     plt.grid()
287
288
289     plt.show()
290
291
292
293 def func(p,x):
294
295
296     a,b,c=p
297
298
299     return a*x*x+b*x+c
300
301
302 def error(p,x,y):
303
304
305     return func(p,x)-y
306
307
308 def main():
309
310
311     plt.figure(figsize=(10,6))
312
313
314     p0=[0,0,0]
315
316
317     Para = leastsq(error,p0,args=(X,Y))
318
319
320     a,b,c=Para[0]
321
322
323     print("a=",a,"b=",b,"c=",c)
324
325
326
327     plt.scatter(X,Y,color="blue",linewidth=2)
328
329
330     x=np.linspace(0,20,20)
331
332
333     y=a*x*x+b*x+c
334
335
336     plt.plot(x,y,color="blue",linewidth=2,)
337
338
339     plt.title("总数分布")
340
341
342     plt.grid()
343
344
345     plt.show()
346
347
348
349 print(A())
350
351
352 print(B())
五、总结
1.暂时没有达到预期的目标;对于数据可视化的方面可能研究并没有这么透彻,可能时间有限,但以后有的是时间。
2.爬虫这方面我得多下点功夫,虽然这一次我没有学会爬虫,我会在以后的一段时间里多加练习,多参考网上的学习资源,在那些优秀博文上多多学习和模仿,做出属于我自己的爬虫python爬虫课程设计的一份完整作品。当然,向老师询问相关的知识也得频率多一些,这样才会有所进步,对于我自己的预想的目标才会有所进展。”失败是成功之母“,错了不可怕,能改回来才是对的。我相信我日后我可以持之以恒地投入到这方面中,让我自己能够优秀起来。

 浙公网安备 33010602011771号