百度地图、高德地图、Google地图等坐标提取与转换
1、地理坐标系与投影坐标系
地理坐标系也就是球面坐标系,是将本不是椭球体的地球进行椭球体化,从而形成球面坐标体系,国际标准的地理坐标系就是WGS-84坐标系;
只不过各个国家为了反映该国家所在区域地球的真实形状,采用不同的数学模型对地球进行椭球体化,所以就有个Beijing54、Xian80坐标系。
投影坐标系是为平面坐标,是将地理坐标根据一定的投影规则投影到平面,形成的平面直角坐标系,比如高斯-克吕格投影,墨卡托投影等。
2、WGS-84坐标系
WGS-84坐标是地理坐标系,也就是GPS坐标,一般用国际标准的GPS记录仪记录下来的坐标,都是GPS的坐标。但是在中国为了保密,任何一个地图产品都不允许使用GPS坐标。GPS坐标以度分秒形式表示经纬度,比如google earth上采集到的是39°31'20.51,那么应该这样换算,31分就是31/60度,20.51秒就是20.51/3600度,结果就是39+ 31/60 + 20.51/3600 度。
3、GCJ-02坐标系 与 百度 bd-09坐标系
GCJ-02坐标系又名“火星坐标系”,是我国国测局独创的坐标体系,由WGS-84加密而成,在国内,必须至少使用GCJ-02坐标系,或者使用在GCJ-02加密后再进行加密的坐标系,如百度坐标系。高德和Google在国内都是使用GCJ-02坐标系,可以说,GCJ-02是国内最广泛使用的坐标系。
百度坐标系是在GCJ-02坐标系的基础上再次加密偏移后形成的坐标系,只适用于百度地图。(当然,百度地图api接口提供了google坐标转百度坐标、原始坐标转百度坐标的接口,网上也有一些转换算法,个人建议还是用百度地图api比较准确)

4、WGS84 Web Mercator 坐标系
我们在做开发的时候,尤其是web地图开发,两种坐标系至关重要 WGS84(WKID:4326) 和 WGS84 Web Mercator (WKID:102113) 。WGS84 Web Mercator 是目前在线地图(平面)采用的通用坐标系,属于投影坐标系。
5、测试
测试方法:
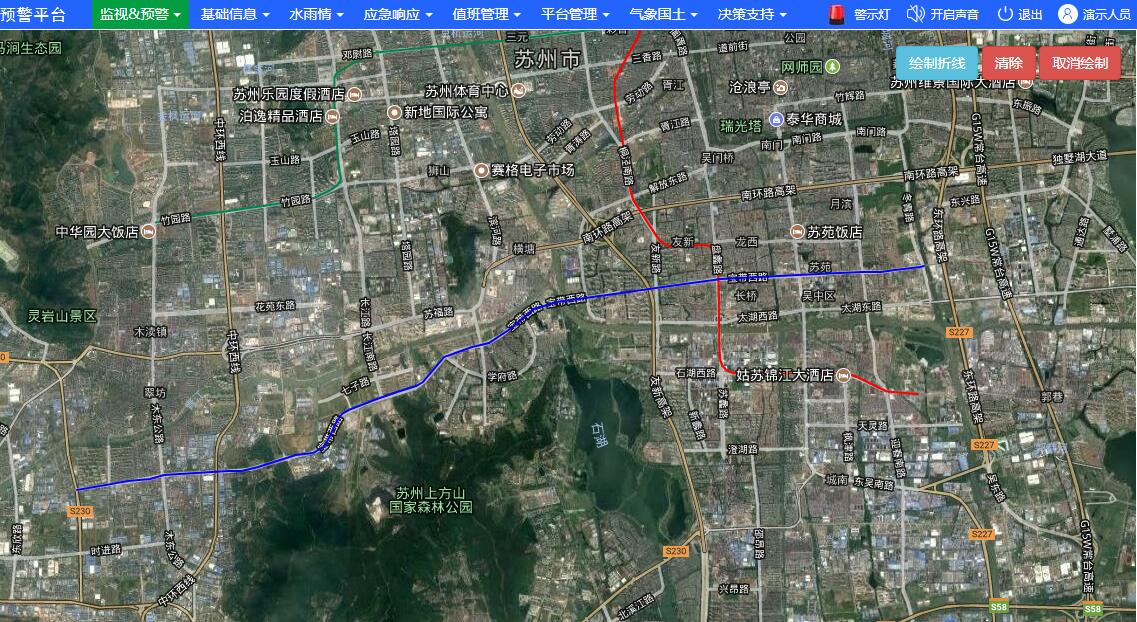
①使用arcgis api for javascript 调用 Google卫星地图服务;
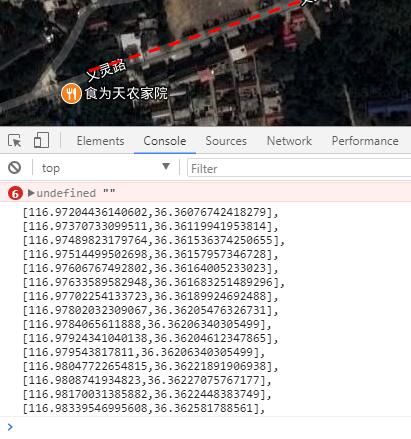
②在①的基础上调用arcgis api for javascript 绘制折现的工具,在卫星影像图中辨识并绘制一条道路,将其坐标点经纬度(这里输出的应该是GCJ-02火星坐标系吧?我不确定,有知道的望留言!)输出到控制台;
③使用高德地图API将②获取到的坐标点集绘制成折线,比较从Google地图中获取到的点集坐标在高德地图中是否有偏差?
④使用百度地图API将②获取到的坐标点集绘制成折线,比较从Google地图中获取到的点集坐标在百度地图中是否有偏差?
Google地图相关代码:
@using Drision.Framework.Mvc; @{ ViewBag.Title = "Google地图"; <link rel="stylesheet" type="text/css" href="http://localhost/arcgis_js_v39_sdk/arcgis_js_api/library/3.9/3.9/js/dojo/dijit/themes/tundra/tundra.css" /> <link rel="stylesheet" type="text/css" href="http://localhost/arcgis_js_v39_sdk/arcgis_js_api/library/3.9/3.9/js/esri/css/esri.css" /> <script type="text/javascript" src="http://localhost/arcgis_js_v39_sdk/arcgis_js_api/library/3.9/3.9/init.js"></script> } <style> /*地图样式调整*/ .esriPopup .titlePane { padding-left: 0px; } .esriPopup .actionsPane .zoomTo { display: none; } .esriPopup .titleButton.maximize { display: none; } .esriPopup .titleButton.close { display: none; } </style> <style> @@media(min-width: 768px) { .container { max-width: 100%; } } @@media(min-width: 992px) { .container { max-width: 100%; } } @@media(min-width: 1200px) { .container { max-width: 100%; } } @@media(min-width: 1600px) { .container { max-width: 100%; } } </style> <style> /* ===========悬浮菜单栏===========*/ #controls { /*background: #fff;*/ /*border: 1px solid #9e9fa1;*/ /*box-shadow: 0 5px 4px rgba(0,0,0,.15);*/ color: #7c8196; font-family: sans-serif; height: 40px; top: 3.8em; position: absolute; width: auto; z-index: 40; border-radius: 4px; padding: 0.1em 0.3em 0 0.3em; right: 1em !important; } </style> <div style="padding: 1px;"> <div id="mapDiv" style="min-width: 1260px; min-height: 860px;"></div> <div id="controls"> <button class="btn btn-info" id="polyline">绘制折线</button> <button class="btn btn-danger" id="remove">清除</button> <button class="btn btn-danger" id="quxiao">取消绘制</button> </div> </div> <script> dojo.require("esri/map", "dojo/dom", "dojo/on", "dojo/colors", "esri/layers/ArcGISTiledMapServiceLayer", "esri/layers/GraphicsLayer", "esri/geometry/Point", "esri/geometry/Polygon", "esri/SpatialReference", "esri/toolbars/draw", "esri/graphic", "esri/symbols/SimpleMarkerSymbol", "esri/symbols/SimpleLineSymbol", "esri/symbols/SimpleFillSymbol", "esri/symbols/PictureMarkerSymbol", "dojo/parser", "dijit/registry", "dijit/layout/BorderContainer", "dijit/layout/ContentPane", "dijit/form/Button", "dijit/WidgetSet", "dojo/domReady!"); function init(Map, dom, on, Color, ArcGISTiledMapServiceLayer, GraphicsLayer, Point, Polygon, SpatialReference, SimpleMarkerSymbol, SimpleLineSymbol, SimpleFillSymbol, PictureMarkerSymbol, Draw, Graphic, parser, registry ) { loadGoogLyr(); var map = new esri.Map("mapDiv", { logo: false, //basemap: "streets", center: [120.6168, 31.42], slider: false, zoom: 9, showLabels: true, }); map.addLayer(new GoogleMapLayer()); map.addLayer(new GoogleMapAnooLayer()); //*************************** 以下为自定义图层 ********************************* //======== 地图中添加绘制层 ======= var gl = new esri.layers.GraphicsLayer({ id: "bound" }); map.addLayer(gl); //======== 添加道路线 ======= var line = new esri.geometry.Polyline({ "paths": [[ [120.50459959285944, 31.235715080384875], [120.51335432308402, 31.23696268129648], [120.517130873377, 31.2373296196055], [120.51961996334282, 31.237843330843624], [120.5306062914678, 31.238430425980763], [120.53300955074512, 31.23850381261634], [120.5356703020879, 31.23909090364859], [120.54219343441213, 31.24077877004094], [120.54511167782032, 31.24107230894344], [120.54725744503222, 31.242099687918223], [120.54923155086718, 31.24584218824886], [120.5501756884404, 31.24679613520138], [120.55172064083301, 31.24760331355749], [120.55618383663376, 31.248997514466723], [120.55953123348435, 31.250024807227433], [120.56287863033494, 31.25090533498366], [120.56399442928513, 31.25149234892578], [120.56759931820115, 31.255234477009502], [120.5724916674443, 31.25662856523398], [120.57540991085249, 31.2572155435902], [120.57892896908001, 31.259269939092558], [120.58304884212689, 31.26227808040296], [120.58708288448528, 31.263231861286453], [120.60639478939247, 31.26557958854718], [120.61523535030554, 31.26668006559397], [120.62845327633093, 31.267193617156938], [120.63540556209752, 31.267487073938], [120.63961126583287, 31.26763380198627], [120.64261533992953, 31.26763380198627], [120.64510442989535, 31.267927257398295], [120.64931013363069, 31.26844080217318], [120.65008260982698, 31.268587528738323], [120.65008260982698, 31.268587528738323] ]], "spatialReference": { "wkid": 4326 } //这里我将绘制道路提取出来的坐标点集又放入Google地图,但是用的是 wkid 4326(WGS-84坐标系) }); //有点混乱,照理讲这个坐标应该是 GCJ-02火星坐标系的,为什么用4326才能正常显示?如果我用GPS设备提取的坐标值呢? var lineSymbol = new esri.symbol.CartographicLineSymbol( esri.symbol.CartographicLineSymbol.STYLE_SOLID, new dojo.Color("#0000FF"), 2, esri.symbol.CartographicLineSymbol.CAP_ROUND, esri.symbol.CartographicLineSymbol.JOIN_MITER, 5 ); var polyline = new esri.Graphic(line, lineSymbol); gl.add(polyline); ////============== 以下为绘制线操作 ====================== var draw = new esri.toolbars.Draw(map); //定义图形样式 draw.markerSymbol = new esri.symbol.SimpleMarkerSymbol(); draw.lineSymbol = new esri.symbol.SimpleLineSymbol( esri.symbol.SimpleLineSymbol.STYLE_DASH, new dojo.Color([255, 0, 0]), 3 ); draw.fillSymbol = new esri.symbol.SimpleFillSymbol(); $("#controls button").click(function () { var tool = null; switch (this.id) { case "point": tool = "POINT"; break; case "polyline": tool = "POLYLINE"; break; case "polygon": tool = "POLYGON"; break; case "circle": tool = "CIRCLE"; break; case "rectangle": tool = "RECTANGLE"; break; case "quxiao": draw.deactivate(); break; case "remove": map.graphics.clear(); break; } if (tool !== null) { draw.activate(esri.toolbars.Draw[tool]); //激活对应的绘制工具 } }); draw.on("draw-complete", drawEndEvent); function drawEndEvent(evt) { //添加图形到地图 var symbol; if (evt.geometry.type === "point" || evt.geometry.type === "multipoint") { symbol = draw.markerSymbol; } else if (evt.geometry.type === "line" || evt.geometry.type === "polyline") { symbol = draw.lineSymbol; } else { symbol = draw.fillSymbol; } map.graphics.add(new esri.Graphic(evt.geometry, symbol)) //将经纬度坐标点集输出到控制台(这里输出的是火星坐标系的经纬度?) var output = ""; for (var i = 0; i < evt.geographicGeometry.paths[0].length; i++) { output += "[" + evt.geographicGeometry.paths[0][i][0] + "," + evt.geographicGeometry.paths[0][i][1] + "],\r\n"; } console.log(output); } } function loadGoogLyr() { //遥感影像图 dojo.declare("GoogleMapLayer", esri.layers.TiledMapServiceLayer, { // create WMTSLayer by extending esri.layers.TiledMapServiceLayer constructor: function () { this.spatialReference = new esri.SpatialReference({ wkid: 102113 }); this.initialExtent = new esri.geometry.Extent(-20037508.342787, -20037508.342787, 20037508.342787, 20037508.342787, this.spatialReference); this.fullExtent = new esri.geometry.Extent(-20037508.342787, -20037508.342787, 20037508.342787, 20037508.342787, this.spatialReference); // this.tileInfo = new esri.layers.TileInfo({ "dpi": "90.71428571427429", "format": "image/png", "compressionQuality": 0, "spatialReference": { "wkid": "3857" }, "rows": 256, "cols": 256, "origin": { "x": -20037508.342787, "y": 20037508.342787 }, // Scales in DPI 96 "lods": [{ "level": 0, "scale": 591657527.591555, "resolution": 156543.033928 }, { "level": 1, "scale": 295828763.795777, "resolution": 78271.5169639999 }, { "level": 2, "scale": 147914381.897889, "resolution": 39135.7584820001 }, { "level": 3, "scale": 73957190.948944, "resolution": 19567.8792409999 }, { "level": 4, "scale": 36978595.474472, "resolution": 9783.93962049996 }, { "level": 5, "scale": 18489297.737236, "resolution": 4891.96981024998 }, { "level": 6, "scale": 9244648.868618, "resolution": 2445.98490512499 }, { "level": 7, "scale": 4622324.434309, "resolution": 1222.99245256249 }, { "level": 8, "scale": 2311162.217155, "resolution": 611.49622628138 }, { "level": 9, "scale": 1155581.108577, "resolution": 305.748113140558 }, { "level": 10, "scale": 577790.554289, "resolution": 152.874056570411 }, { "level": 11, "scale": 288895.277144, "resolution": 76.4370282850732 }, { "level": 12, "scale": 144447.638572, "resolution": 38.2185141425366 }, { "level": 13, "scale": 72223.819286, "resolution": 19.1092570712683 }, { "level": 14, "scale": 36111.909643, "resolution": 9.55462853563415 }, { "level": 15, "scale": 18055.954822, "resolution": 4.77731426794937 }, { "level": 16, "scale": 9027.977411, "resolution": 2.38865713397468 }, { "level": 17, "scale": 4513.988705, "resolution": 1.19432856685505 }, { "level": 18, "scale": 2256.994353, "resolution": 0.597164283559817 }, { "level": 19, "scale": 1128.497176, "resolution": 0.298582141647617 }] }); this.loaded = true; this.onLoad(this); }, getTileUrl: function (level, row, col) { return "http://mt" + (col % 4) + ".google.cn/vt/lyrs=s@112&hl=zh-CN&gl=cn&" + "x=" + col + "&" + "y=" + row + "&" + "z=" + level + "&s="; } }); //标注矢量图 dojo.declare("GoogleMapAnooLayer", esri.layers.TiledMapServiceLayer, { // create WMTSLayer by extending esri.layers.TiledMapServiceLayer constructor: function () { this.spatialReference = new esri.SpatialReference({ wkid: 102113 }); this.initialExtent = new esri.geometry.Extent(-20037508.342787, -20037508.342787, 20037508.342787, 20037508.342787, this.spatialReference); this.fullExtent = new esri.geometry.Extent(-20037508.342787, -20037508.342787, 20037508.342787, 20037508.342787, this.spatialReference); // this.tileInfo = new esri.layers.TileInfo({ "dpi": "90.71428571427429", "format": "image/png", "compressionQuality": 0, "spatialReference": { "wkid": "3857" }, "rows": 256, "cols": 256, "origin": { "x": -20037508.342787, "y": 20037508.342787 }, // Scales in DPI 96 "lods": [{ "level": 0, "scale": 591657527.591555, "resolution": 156543.033928 }, { "level": 1, "scale": 295828763.795777, "resolution": 78271.5169639999 }, { "level": 2, "scale": 147914381.897889, "resolution": 39135.7584820001 }, { "level": 3, "scale": 73957190.948944, "resolution": 19567.8792409999 }, { "level": 4, "scale": 36978595.474472, "resolution": 9783.93962049996 }, { "level": 5, "scale": 18489297.737236, "resolution": 4891.96981024998 }, { "level": 6, "scale": 9244648.868618, "resolution": 2445.98490512499 }, { "level": 7, "scale": 4622324.434309, "resolution": 1222.99245256249 }, { "level": 8, "scale": 2311162.217155, "resolution": 611.49622628138 }, { "level": 9, "scale": 1155581.108577, "resolution": 305.748113140558 }, { "level": 10, "scale": 577790.554289, "resolution": 152.874056570411 }, { "level": 11, "scale": 288895.277144, "resolution": 76.4370282850732 }, { "level": 12, "scale": 144447.638572, "resolution": 38.2185141425366 }, { "level": 13, "scale": 72223.819286, "resolution": 19.1092570712683 }, { "level": 14, "scale": 36111.909643, "resolution": 9.55462853563415 }, { "level": 15, "scale": 18055.954822, "resolution": 4.77731426794937 }, { "level": 16, "scale": 9027.977411, "resolution": 2.38865713397468 }, { "level": 17, "scale": 4513.988705, "resolution": 1.19432856685505 }, { "level": 18, "scale": 2256.994353, "resolution": 0.597164283559817 }, { "level": 19, "scale": 1128.497176, "resolution": 0.298582141647617 }] }); this.loaded = true; this.onLoad(this); }, getTileUrl: function (level, row, col) { return "http://mt" + (col % 4) + ".google.cn/vt/lyrs=h@177000000&hl=zh-CN&gl=cn&" + "x=" + col + "&" + "y=" + row + "&" + "z=" + level + "&s="; } }); } dojo.ready(init); </script>
实现效果:
高德地图相关代码:
@{
    ViewBag.Title = "高德地图";

    <script type="text/javascript" src="http://webapi.amap.com/maps?v=1.4.1&key= xxx(这里是key) &plugin=AMap.Geocoder,AMap.ToolBar"></script>
}
<style>
    /* ===========悬浮菜单栏===========*/
    #controls {
        /*background: #fff;*/
        /*border: 1px solid #9e9fa1;*/
        /*box-shadow: 0 5px 4px rgba(0,0,0,.15);*/
        color: #7c8196;
        font-family: sans-serif;
        height: 40px;
        top: 3.8em;
        position: absolute;
        width: auto;
        z-index: 40;
        border-radius: 4px;
        padding: 0.1em 0.3em 0 0.3em;
        right: 1em !important;
    }
</style>

<div style="padding: 1px; width: 100%; height: 100%;">
    <div id="container" style="width:100%; height:100%;"></div>

    <div id="controls">
        <button class="btn btn-info" id="RemotePhoto">卫星显示</button>
        <button class="btn btn-info" id="RoadGrid">路网显示</button>
    </div>
</div>


<script>
    var map = new AMap.Map('container', {
        resizeEnable: true,
        center: [120.6168, 31.42],
        //layers: [new AMap.TileLayer.Satellite()],  //卫星图
        zoom: 9
    });


    var roadNetLayer = new AMap.TileLayer.RoadNet({ zIndex: 12 }); //实例化路网图层
    roadNetLayer.setMap(map); //在map中添加路网图层
    var satellLayer = new AMap.TileLayer.Satellite({ zIndex: 11 }); //实例化卫星图
    satellLayer.setMap(map); //在map中添加卫星图

    var showRemote = true;
    var showRoad = true;
    $("#RemotePhoto").click(function () {
        if (showRemote == true) {
            $(this).removeClass("btn-info").addClass("btn-danger");
            showRemote = false;

            satellLayer.hide();
        }
        else {
            $(this).removeClass("btn-danger").addClass("btn-info");
            showRemote = true;

            satellLayer.show();
        }
    });

    $("#RoadGrid").click(function () {
        if (showRoad == true) {
            $(this).removeClass("btn-info").addClass("btn-danger");
            showRoad = false;

            roadNetLayer.hide();
        }
        else {
            $(this).removeClass("btn-danger").addClass("btn-info");
            showRoad = true;

            roadNetLayer.show();
        }
    });


    var lineArr = [
[120.50459959285944, 31.235715080384875],
[120.51335432308402, 31.23696268129648],
[120.517130873377, 31.2373296196055],
[120.51961996334282, 31.237843330843624],
[120.5306062914678, 31.238430425980763],
[120.53300955074512, 31.23850381261634],
[120.5356703020879, 31.23909090364859],
[120.54219343441213, 31.24077877004094],
[120.54511167782032, 31.24107230894344],
[120.54725744503222, 31.242099687918223],
[120.54923155086718, 31.24584218824886],
[120.5501756884404, 31.24679613520138],
[120.55172064083301, 31.24760331355749],
[120.55618383663376, 31.248997514466723],
[120.55953123348435, 31.250024807227433],
[120.56287863033494, 31.25090533498366],
[120.56399442928513, 31.25149234892578],
[120.56759931820115, 31.255234477009502],
[120.5724916674443, 31.25662856523398],
[120.57540991085249, 31.2572155435902],
[120.57892896908001, 31.259269939092558],
[120.58304884212689, 31.26227808040296],
[120.58708288448528, 31.263231861286453],
[120.60639478939247, 31.26557958854718],
[120.61523535030554, 31.26668006559397],
[120.62845327633093, 31.267193617156938],
[120.63540556209752, 31.267487073938],
[120.63961126583287, 31.26763380198627],
[120.64261533992953, 31.26763380198627],
[120.64510442989535, 31.267927257398295],
[120.64931013363069, 31.26844080217318],
[120.65008260982698, 31.268587528738323],
[120.65008260982698, 31.268587528738323]
    ];
    var polyline = new AMap.Polyline({
        path: lineArr,          //设置线覆盖物路径
        strokeColor: "#ff0000", //线颜色
        strokeOpacity: 1,       //线透明度
        strokeWeight: 3,        //线宽
        strokeStyle: "dash",   //线样式 实线:solid
        strokeDasharray: [10, 5] //补充线样式
    });
    polyline.setMap(map);

</script>
实现效果(无偏差):

使用百度地图api 的效果(有偏差),我只输入了部分坐标点集:


 浙公网安备 33010602011771号