
python爬取房价信息及分析
一、选题背景
随着社会的发展,炒房投资者越来越多,房价竞争愈演愈烈,让越来越多的人买不起房子。国家通过宏观调控,实施政策改革,及时制止炒房行为。在近段时间里,大部分地区的房价都有所下降,二手房在售数量上升。现在房产市场逐渐偏向未购房人群,炒房投资者能从中获得的收益越来越少,不少炒房投资者都纷纷抛售手上的空房。本次爬虫主要是为了帮助购房人群了解房产市场的情况,获取房价信息。
二、主题式网络爬虫设计方案
1.主题式网络爬虫名称
爬取房价信息及分析
2.主题式网络爬虫爬取的内容与数据特征分析
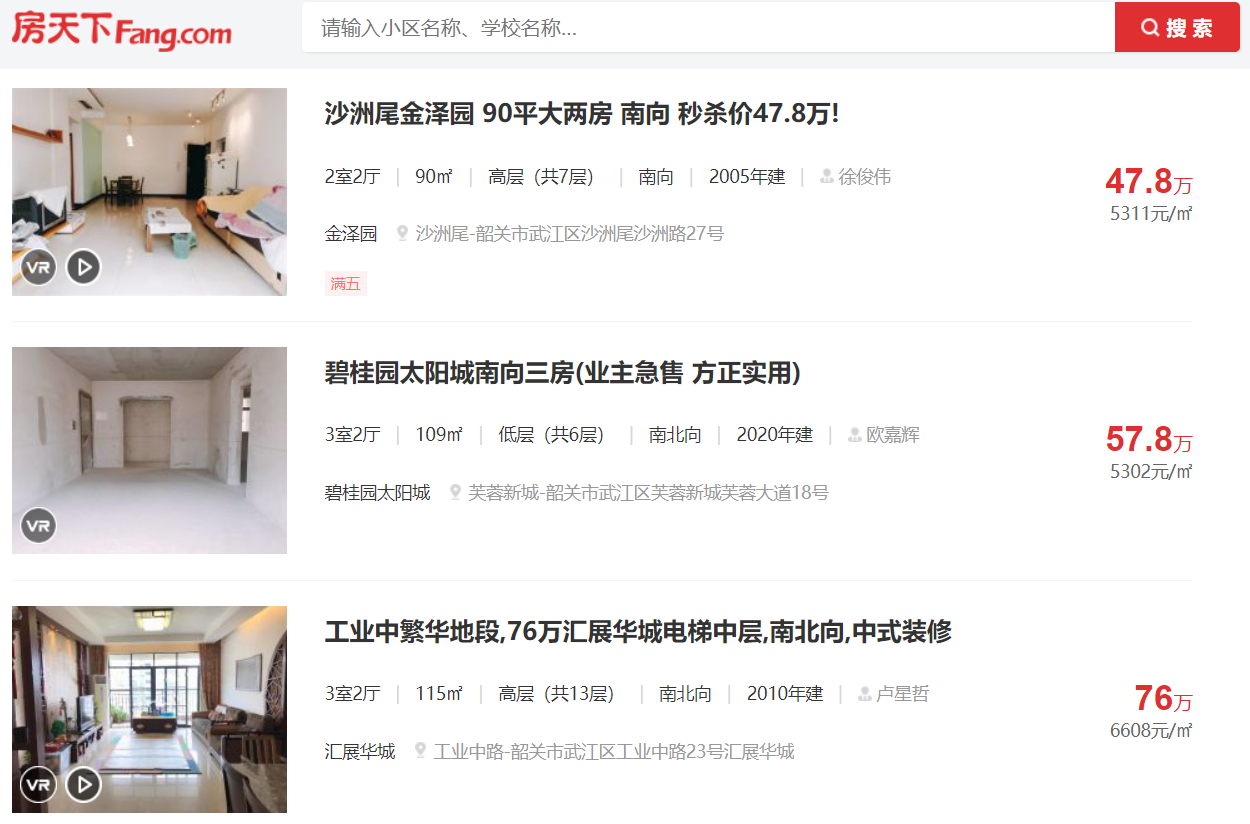
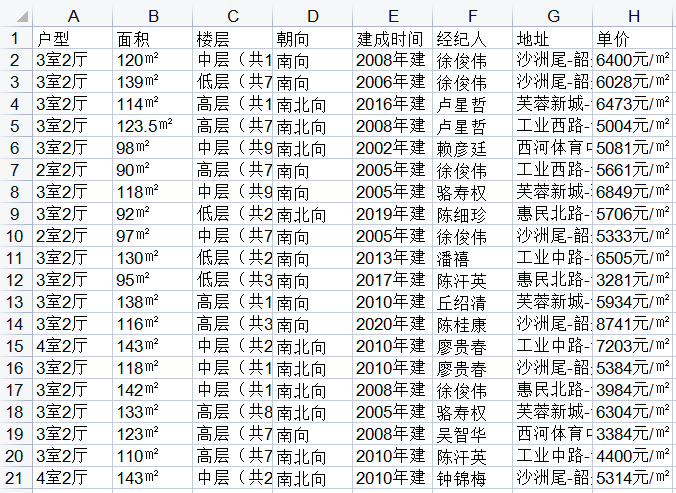
爬取的内容:爬取“房天下”网页在售房的户型、面积、楼层、朝向、建成时间、经纪人、地址、房价,分析相对落后地区的房价信息。
数据特征分析:相对发达地区的房价均处于一万每平方米以上,相对落后地区的房价主要集中在六千每平方米左右,价格越往上房源越少,基本没有超过一万每平方米的房子。
3.主题式网络爬虫设计方案概述
本次爬虫的操作难度对于处于入门级的我来说,有很大的挑战性。首先选题材阶段就困扰我很久,大多数常用的网站都具有反爬虫机制,好不容易爬取到的数据,一段时间后就变成了乱码,我只能寻找一些没有反爬机制或反爬机制较弱的网站进行爬虫。其次是数据处理,在绘图过程中,数据需要频繁的转换和使用,非常的麻烦,通过多次翻书和查询才得以解决。
三、主题页面的结构特征分析
1.主题页面的结构与特征分析
URL:
https://shaoguan.esf.fang.com/house-a016997/
网址首页:
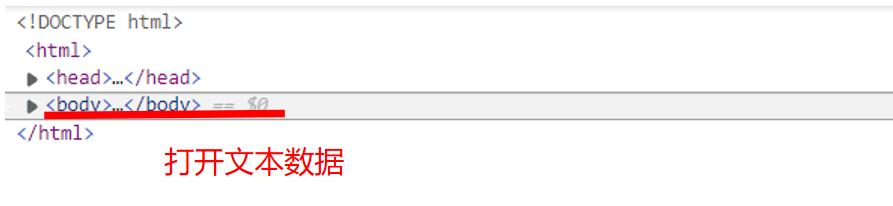
页面分析:
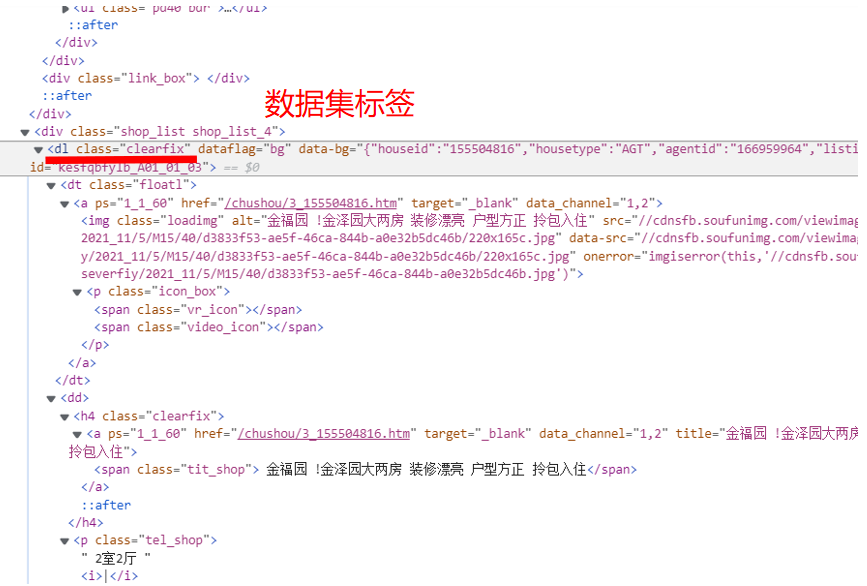
2.Htmls 页面解析

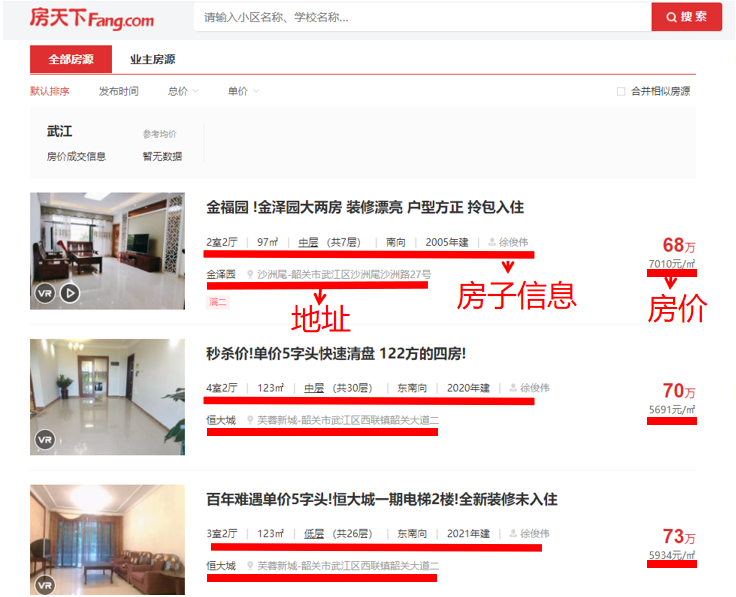
3.节点查找方法与遍历方法
节点查找的方法:
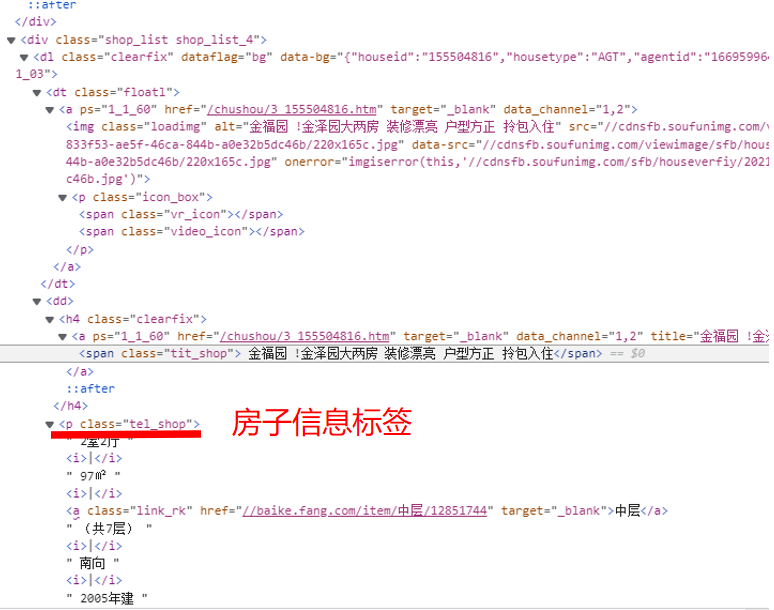
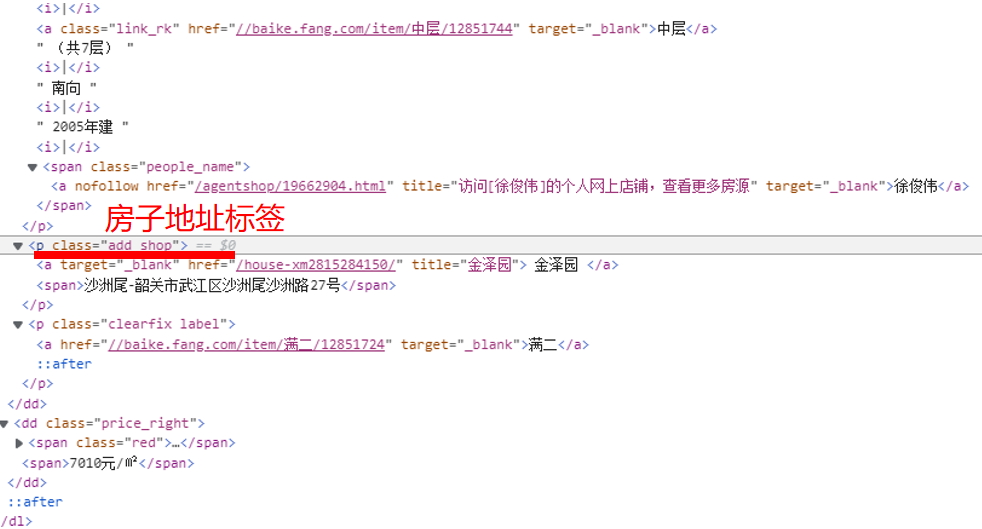
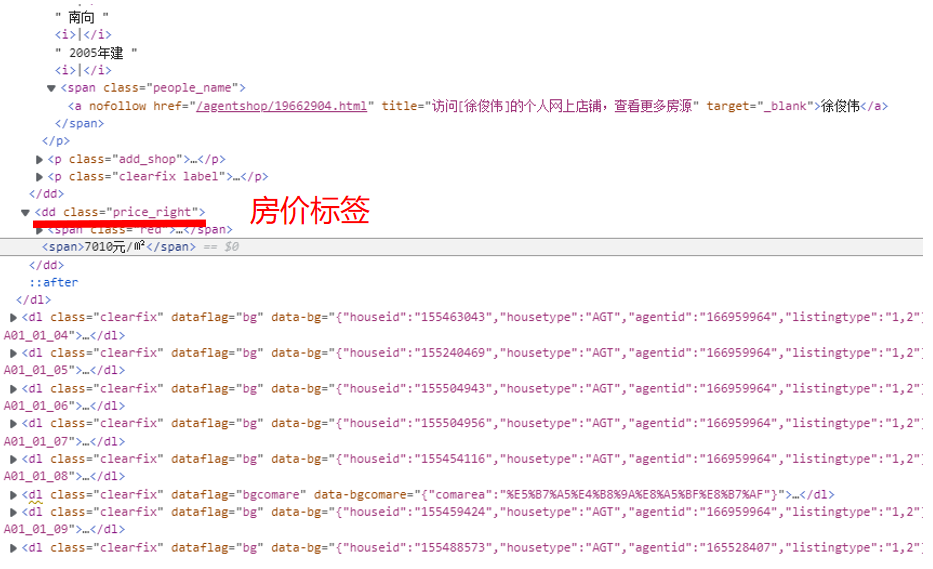
遍历的方法:
先找出数据集标签,在数据集中找到房子信息标签、房子地址标签、房价标签,利用遍历将这些标签获取到需要的信息整合到表格中。
四、网络爬虫程序设计
1.数据爬取与采集
(1)相对发达地区
 1 #相对发达地区
 2 import numpy as np
 3 import matplotlib.pyplot as plt
 4 import os
 5 import pandas as pd
 6 from bs4 import BeautifulSoup
 7 import requests
 8 import time
 9 #一个可以生成进度条的库
10 from tqdm import tqdm
11 #爬取的网页
12 headers = {
13     'User-Agent':
14     'Mozilla/5.0 (Windows NT 10.0; Win64; x64) AppleWebKit/537.36 (KHTML, like Gecko) Chrome/96.0.4664.110 Safari/537.36'
15 }
16 #“房天下”网页
17 url = "https://qz.esf.fang.com/house-a016886/"
18 #爬取过程
19 attrs = ["户型", "面积", "楼层", "朝向", "建成时间", "经纪人", "地址", "单价"]
20 df_xsq = pd.DataFrame(columns=attrs)
21 n = 100
22 res = requests.get(url,headers=headers)
23 soup = BeautifulSoup(res.text, "html.parser")
24 #跳转页面的解码
25 tag = soup.find_all("script")[3]
26 a = str(tag).find("rfss")
27 var_t4 = url
28 var_t3 = str(tag)[a:a + 28]
29 #随机爬取的页数
30 newUrl = var_t4 + "1" + "?" + var_t3
31 print("当前访问为 {0}:".format(newUrl))
32 newPage = requests.get(newUrl, headers=headers)
33 newSoup = BeautifulSoup(newPage.text, "html.parser")
34 #tqdm创建进度条
35 for i in tqdm(range(n)):
36     try:
37         #首页信息
38         p = newSoup.find_all("dl", {"class": "clearfix"})[i].dd.p
39         #地址信息
40         span = newSoup.find_all("p", {"class": "add_shop"})[i]
41         #信息汇总
42         info = p.text.replace("\t", "").replace("\n",
43                                                 "").split("|")
44         #房价
45         price = newSoup.find_all("dd", {"class": "price_right"})[i]
46         info.append(span.span.text)
47         info.append(price.span.next_sibling.next_sibling.text)
48         time.sleep(0.5)
49         df_xsq.loc[i] = info
50     except:
51         pass
52 #显示加载过程
53 print(i/n,end="")
54 print("爬取完毕!")
55 df_xsq.drop_duplicates(subset=["地址"], keep='first')

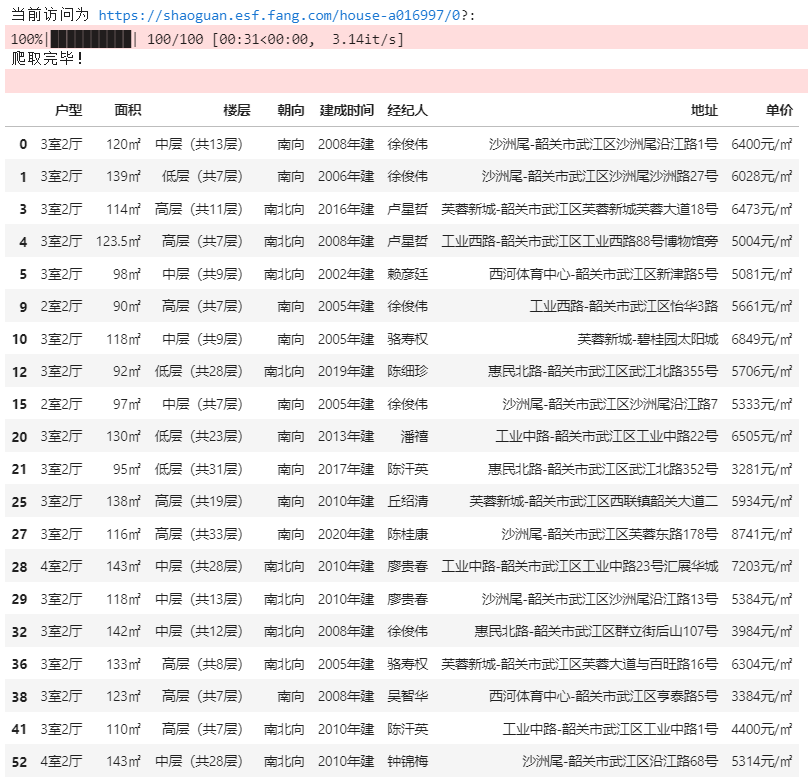
(2)相对落后地区
 1 #相对落后地区
 2 import numpy as np
 3 import matplotlib.pyplot as plt
 4 import os
 5 import pandas as pd
 6 from bs4 import BeautifulSoup
 7 import requests
 8 import time
 9 #一个可以生成进度条的库
10 from tqdm import tqdm
11 #爬取的网页
12 headers = {
13     'User-Agent':
14     'Mozilla/5.0 (Windows NT 10.0; Win64; x64) AppleWebKit/537.36 (KHTML, like Gecko) Chrome/96.0.4664.110 Safari/537.36'
15 }
16 #“房天下”网页
17 url = "https://shaoguan.esf.fang.com/house-a016997/"
18 #爬取过程
19 attrs = ["户型", "面积", "楼层", "朝向", "建成时间", "经纪人", "地址", "单价"]
20 df_xsq = pd.DataFrame(columns=attrs)
21 n = 100
22 res = requests.get(url,headers=headers)
23 soup = BeautifulSoup(res.text, "html.parser")
24 #跳转页面的解码
25 tag = soup.find_all("script")[3]
26 a = str(tag).find("rfss")
27 var_t4 = url
28 var_t3 = str(tag)[a:a + 28]
29 #随机爬取的页数
30 newUrl = var_t4 + "1" + "?" + var_t3
31 print("当前访问为 {0}:".format(newUrl))
32 newPage = requests.get(newUrl, headers=headers)
33 newSoup = BeautifulSoup(newPage.text, "html.parser")
34 #tqdm创建进度条
35 for i in tqdm(range(n)):
36     try:
37         #首页信息
38         p = newSoup.find_all("dl", {"class": "clearfix"})[i].dd.p
39         #地址信息
40         span = newSoup.find_all("p", {"class": "add_shop"})[i]
41         #信息汇总
42         info = p.text.replace("\t", "").replace("\n",
43                                                 "").split("|")
44         #房价
45         price = newSoup.find_all("dd", {"class": "price_right"})[i]
46         info.append(span.span.text)
47         info.append(price.span.next_sibling.next_sibling.text)
48         time.sleep(0.5)
49         df_xsq.loc[i] = info
50     except:
51         pass
52 #显示加载过程
53 print(i/n,end="")
54 print("爬取完毕!")
55 df_xsq.drop_duplicates(subset=["地址"], keep='first')
2.数据分析与可视化
(1)扇形图
 1 #绘制扇形图
 2 from collections import Counter
 3 import matplotlib.pyplot as plt
 4 import matplotlib as mpt
 5 #绘图
 6 mpt.rcParams['font.family']='fangsong'
 7 #房价
 8 result = [ str(x) for x in result ]
 9 ha = pd.Series(result) + '千'
10 hah=ha.tolist()
11 labels = hah
12 #房价占比
13 ta = round(f/1000)
14 ma = ta[0:20].astype('int')
15 ex = ma
16 result = dict(Counter(ex))
17 ty=[]
18 for i2 in result:
19     py=result[i2]
20     py=py/0.2
21     ty.append(py)
22 sizes  = ty
23 #扇形图之间的距离
24 kl = []
25 g =  i2+2
26 for i in range(g):
27     jk=0.03
28     i+=1
29     kl.append(jk)
30 explode= kl
31 #绘制扇形图
32 plt.pie(sizes,explode=explode,labels=labels,autopct='%1.1f%%',shadow=False,startangle=90)
33 plt.axis('equal')
34 #标签
35 plt.legend('123456')
36 plt.show()

(2)直方图
 1 #绘制频数直方图
 2 from matplotlib import pyplot as plt
 3 #数据
 4 k = round(f/100)
 5 j = k[0:20].astype('int')
 6 a = j[0:20]
 7 #组距
 8 d = 4
 9 #组数
10 num_bins = (max(a)-min(a))//d + 1
11 #根据数据情况设置组距
12 print(max(a), min(a), max(a)-min(a))
13 print(f"组数:{num_bins}")
14 # 设置图形大小
15 plt.figure(figsize=(10,5), dpi=80)
16 # range表示总数据的总区间(y轴表示区间上的个数)
17 plt.hist(a, num_bins, range=(40, 93))
18 # 设置x轴的刻度
19 plt.xticks(range(min(a), max(a)+d, d))
20 # 绘制网格
21 plt.grid()
22 plt.show()

(3)柱状图
 1 #绘制柱状图
 2 import matplotlib
 3 import matplotlib.pyplot as plt
 4 import numpy as np
 5 #数据
 6 labels = [[i] for i in range(1,21)]
 7 men_means = f[0:20]
 8 #绘图过程
 9 x = np.arange(len(labels))
10 #柱子宽度
11 width = 0.5
12 fig, ax = plt.subplots()
13 rects1 = ax.bar(x, men_means, width, label='标签')
14 ax.set_title('柱状图')
15 ax.set_xticks(x)
16 ax.set_xticklabels(labels)
17 ax.legend()
18 #在每条柱子上方附加一个文本标签,显示其高度
19 def autolabel(rects):
20     for rect in rects:
21         height = rect.get_height()
22         ax.annotate('{}'.format(height),
23                     xy=(rect.get_x() + rect.get_width() / 2, height),
24                     #文本标签与柱子的距离
25                     xytext=(0,3),
26                     textcoords="offset points",
27                     ha='center', va='bottom')
28 autolabel(rects1)
29 fig.tight_layout()
30 plt.show()

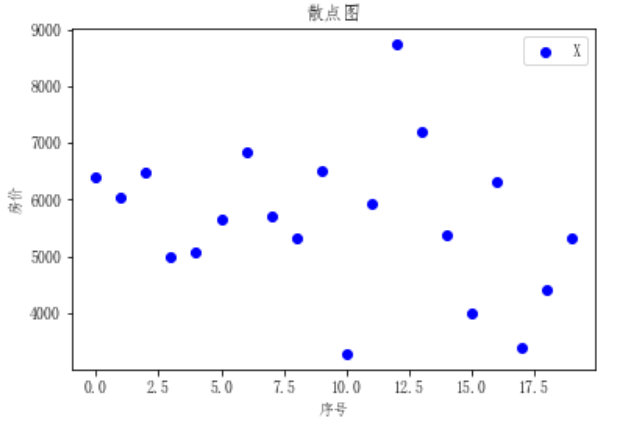
(4)散点图
 1 #绘制散点图
 2 import numpy as np
 3 import matplotlib.pyplot as plt
 4 #数据
 5 x = [[i] for i in (f[0:20])]
 6 y = [[i] for i in range(0,20)]
 7 #绘图过程
 8 fig = plt.figure()
 9 ax1 = fig.add_subplot(111)
10 #绘制
11 ax1.set_title('散点图')
12 plt.xlabel('序号')
13 plt.ylabel('房价')
14 ax1.scatter(y,x,c = 'b',marker = 'o')
15 plt.legend('X')
16 plt.show()
(5)折线图
 1 #绘制折线图
 2 import numpy as np
 3 import matplotlib.pyplot as plt
 4 #数据
 5 x1=[[i] for i in range(0,20)]
 6 y1=[[i] for i in (f[0:20])]
 7 #绘图过程
 8 fig, (ax1) = plt.subplots(1, 1)
 9 #绘制折线图
10 ax1.plot(x1, y1, 'o-')
11 plt.show()

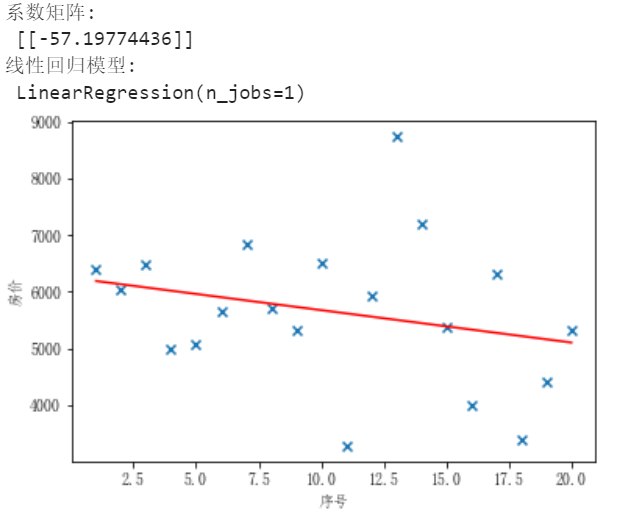
(6)线性回归模型
 1 #绘制线性回归
 2 import numpy as np
 3 import matplotlib.pyplot as plt
 4 from sklearn.linear_model import LinearRegression
 5 #数据
 6 X=[[i] for i in range(1,21)]
 7 y=[[i] for i in (f[0:20])]
 8 #绘图过程
 9 model = LinearRegression(copy_X=True, fit_intercept=True, n_jobs=1, normalize=False)
10 #线性回归建模
11 model.fit(X, y)
12 print('系数矩阵:\n',model.coef_)
13 print('线性回归模型:\n',model)
14 #使用模型预测
15 predicted = model.predict(X)
16 #绘制散点图,参数:x横轴 y纵轴
17 plt.scatter(X, y, marker='x')
18 plt.plot(X, predicted,c='r')
19 #绘制x轴和y轴坐标
20 plt.xlabel("序号")
21 plt.ylabel("房价")
22 plt.show()
3.数据持久化
 1 #数据持久化
 2 import xlwt
 3 #设置数据的编码格式
 4 book = xlwt.Workbook(encoding='utf-8',style_compression=0)
 5 #建立一张sheet表
 6 sheet = book.add_sheet('单价',cell_overwrite_ok=True)
 7 #列名
 8 col = ['户型','面积','楼层','朝向','建成时间','经纪人','地址','单价']
 9 for i in range(0,8):
10         sheet.write(0,i,col[i])
11 #户型
12 m1=0
13 for i in c1.index:
14             m1+=1
15             sheet.write(m1,0,c1[i])
16 #面积
17 m2=0
18 for i in c2.index:
19             m2+=1
20             sheet.write(m2,1,c2[i])
21 #楼层
22 m3=0
23 for i in c3.index:
24             m3+=1
25             sheet.write(m3,2,c3[i])
26 #朝向
27 m4=0
28 for i in c4.index:
29             m4+=1
30             sheet.write(m4,3,c4[i])
31 #建成时间
32 m5=0
33 for i in c5.index:
34             m5+=1
35             sheet.write(m5,4,c5[i])
36 #经纪人
37 m6=0
38 for i in c6.index:
39             m6+=1
40             sheet.write(m6,5,c6[i])
41 #地址
42 m7=0
43 for i in c7.index:
44             m7+=1
45             sheet.write(m7,6,c7[i])
46 #房价
47 k=0
48 for i in c.index:
49             k+=1
50             sheet.write(k,7,c[i])
51 #保存exls文件
52 savepath = 'C:/Users/XUWENCH/Desktop/表格.xls'
53 book.save(savepath)
4.完整程序代码
  1 #相对发达地区
  2 import numpy as np
  3 import matplotlib.pyplot as plt
  4 import os
  5 import pandas as pd
  6 from bs4 import BeautifulSoup
  7 import requests
  8 import time
  9 #一个可以生成进度条的库
 10 from tqdm import tqdm
 11 #爬取的网页
 12 headers = {
 13     'User-Agent':
 14     'Mozilla/5.0 (Windows NT 10.0; Win64; x64) AppleWebKit/537.36 (KHTML, like Gecko) Chrome/96.0.4664.110 Safari/537.36'
 15 }
 16 #“房天下”网页
 17 url = "https://qz.esf.fang.com/house-a016886/"
 18 #爬取过程
 19 attrs = ["户型", "面积", "楼层", "朝向", "建成时间", "经纪人", "地址", "单价"]
 20 df_xsq = pd.DataFrame(columns=attrs)
 21 n = 100
 22 res = requests.get(url,headers=headers)
 23 soup = BeautifulSoup(res.text, "html.parser")
 24 #跳转页面的解码
 25 tag = soup.find_all("script")[3]
 26 a = str(tag).find("rfss")
 27 var_t4 = url
 28 var_t3 = str(tag)[a:a + 28]
 29 #随机爬取的页数
 30 newUrl = var_t4 + "1" + "?" + var_t3
 31 print("当前访问为 {0}:".format(newUrl))
 32 newPage = requests.get(newUrl, headers=headers)
 33 newSoup = BeautifulSoup(newPage.text, "html.parser")
 34 #tqdm创建进度条
 35 for i in tqdm(range(n)):
 36     try:
 37         #首页信息
 38         p = newSoup.find_all("dl", {"class": "clearfix"})[i].dd.p
 39         #地址信息
 40         span = newSoup.find_all("p", {"class": "add_shop"})[i]
 41         #信息汇总
 42         info = p.text.replace("\t", "").replace("\n",
 43                                                 "").split("|")
 44         #房价
 45         price = newSoup.find_all("dd", {"class": "price_right"})[i]
 46         info.append(span.span.text)
 47         info.append(price.span.next_sibling.next_sibling.text)
 48         time.sleep(0.5)
 49         df_xsq.loc[i] = info
 50     except:
 51         pass
 52 #显示加载过程
 53 print(i/n,end="")
 54 print("爬取完毕!")
 55 df_xsq.drop_duplicates(subset=["地址"], keep='first')
 56
 57 #相对落后地区
 58 import numpy as np
 59 import matplotlib.pyplot as plt
 60 import os
 61 import pandas as pd
 62 from bs4 import BeautifulSoup
 63 import requests
 64 import time
 65 #一个可以生成进度条的库
 66 from tqdm import tqdm
 67 #爬取的网页
 68 headers = {
 69     'User-Agent':
 70     'Mozilla/5.0 (Windows NT 10.0; Win64; x64) AppleWebKit/537.36 (KHTML, like Gecko) Chrome/96.0.4664.110 Safari/537.36'
 71 }
 72 #“房天下”网页
 73 url = "https://shaoguan.esf.fang.com/house-a016997/"
 74 #爬取过程
 75 attrs = ["户型", "面积", "楼层", "朝向", "建成时间", "经纪人", "地址", "单价"]
 76 df_xsq = pd.DataFrame(columns=attrs)
 77 n = 100
 78 res = requests.get(url,headers=headers)
 79 soup = BeautifulSoup(res.text, "html.parser")
 80 #跳转页面的解码
 81 tag = soup.find_all("script")[3]
 82 a = str(tag).find("rfss")
 83 var_t4 = url
 84 var_t3 = str(tag)[a:a + 28]
 85 #随机爬取的页数
 86 newUrl = var_t4 + "0" + "?" + var_t3
 87 print("当前访问为 {0}:".format(newUrl))
 88 newPage = requests.get(newUrl, headers=headers)
 89 newSoup = BeautifulSoup(newPage.text, "html.parser")
 90 #tqdm创建进度条
 91 for i in tqdm(range(n)):
 92     try:
 93         #首页信息
 94         p = newSoup.find_all("dl", {"class": "clearfix"})[i].dd.p
 95         #地址信息
 96         span = newSoup.find_all("p", {"class": "add_shop"})[i]
 97         #信息汇总
 98         info = p.text.replace("\t", "").replace("\n",
 99                                                 "").split("|")
100         #房价
101         price = newSoup.find_all("dd", {"class": "price_right"})[i]
102         info.append(span.span.text)
103         info.append(price.span.next_sibling.next_sibling.text)
104         time.sleep(0.5)
105         df_xsq.loc[i] = info
106     except:
107         pass
108 #显示加载过程
109 print(i/n,end="")
110 print("爬取完毕!")
111 df_xsq.drop_duplicates(subset=["地址"], keep='first')
112
113 #数据处理
114 a=df_xsq.drop_duplicates(subset=["地址"], keep='first')
115 #随机截取部分二手房信息
116 b=a[0:20]
117 c=b['单价']
118 c1=b['户型']
119 c2=b['面积']
120 c3=b['楼层']
121 c4=b['朝向']
122 c5=b['建成时间']
123 c6=b['经纪人']
124 c7=b['地址']
125 #g=[b['户型'],b['面积'],b['楼层'],b['朝向'],b['建成时间'],b['经纪人'],b['地址'],b['单价']]
126 #截取房价的数值部分
127 e = c.apply(lambda x:x[:4])
128 #将object类型转换成整型
129 f=e.astype('int')
130
131 #绘制扇形图
132 from collections import Counter
133 import matplotlib.pyplot as plt
134 import matplotlib as mpt
135 #绘图
136 mpt.rcParams['font.family']='fangsong'
137 #房价
138 result = [ str(x) for x in result ]
139 ha = pd.Series(result) + '千'
140 hah=ha.tolist()
141 labels = hah
142 #房价占比
143 ta = round(f/1000)
144 ma = ta[0:20].astype('int')
145 ex = ma
146 result = dict(Counter(ex))
147 ty=[]
148 for i2 in result:
149     py=result[i2]
150     py=py/0.2
151     ty.append(py)
152 sizes  = ty
153 #扇形图之间的距离
154 kl = []
155 g =  i2+2
156 for i in range(g):
157     jk=0.03
158     i+=1
159     kl.append(jk)
160 explode= kl
161 #绘制扇形图
162 plt.pie(sizes,explode=explode,labels=labels,autopct='%1.1f%%',shadow=False,startangle=90)
163 plt.axis('equal')
164 #标签
165 plt.legend('123456')
166 plt.show()
167
168 #绘制频数直方图
169 from matplotlib import pyplot as plt
170 #数据
171 k = round(f/100)
172 j = k[0:20].astype('int')
173 a = j[0:20]
174 #组距
175 d = 4
176 #组数
177 num_bins = (max(a)-min(a))//d + 1
178 #根据数据情况设置组距
179 print(max(a), min(a), max(a)-min(a))
180 print(f"组数:{num_bins}")
181 # 设置图形大小
182 plt.figure(figsize=(10,5), dpi=80)
183 # range表示总数据的总区间(y轴表示区间上的个数)
184 plt.hist(a, num_bins, range=(40, 93))
185 # 设置x轴的刻度
186 plt.xticks(range(min(a), max(a)+d, d))
187 # 绘制网格
188 plt.grid()
189 plt.show()
190
191 #绘制柱状图
192 import matplotlib
193 import matplotlib.pyplot as plt
194 import numpy as np
195 #数据
196 labels = [[i] for i in range(1,21)]
197 men_means = f[0:20]
198 #绘图过程
199 x = np.arange(len(labels))
200 #柱子宽度
201 width = 0.5
202 fig, ax = plt.subplots()
203 rects1 = ax.bar(x, men_means, width, label='标签')
204 ax.set_title('柱状图')
205 ax.set_xticks(x)
206 ax.set_xticklabels(labels)
207 ax.legend()
208 #在每条柱子上方附加一个文本标签,显示其高度
209 def autolabel(rects):
210     for rect in rects:
211         height = rect.get_height()
212         ax.annotate('{}'.format(height),
213                     xy=(rect.get_x() + rect.get_width() / 2, height),
214                     #文本标签与柱子的距离
215                     xytext=(0,3),
216                     textcoords="offset points",
217                     ha='center', va='bottom')
218 autolabel(rects1)
219 fig.tight_layout()
220 plt.show()
221
222 #绘制散点图
223 import numpy as np
224 import matplotlib.pyplot as plt
225 #数据
226 x = [[i] for i in (f[0:20])]
227 y = [[i] for i in range(0,20)]
228 #绘图过程
229 fig = plt.figure()
230 ax1 = fig.add_subplot(111)
231 #绘制
232 ax1.set_title('散点图')
233 plt.xlabel('序号')
234 plt.ylabel('房价')
235 ax1.scatter(y,x,c = 'b',marker = 'o')
236 plt.legend('X')
237 plt.show()
238
239 #绘制折线图
240 import numpy as np
241 import matplotlib.pyplot as plt
242 #数据
243 x1=[[i] for i in range(0,20)]
244 y1=[[i] for i in (f[0:20])]
245 #绘图过程
246 fig, (ax1) = plt.subplots(1, 1)
247 #绘制折线图
248 ax1.plot(x1, y1, 'o-')
249 plt.show()
250
251 #绘制线性回归模型
252 import numpy as np
253 import matplotlib.pyplot as plt
254 from sklearn.linear_model import LinearRegression
255 #数据
256 X=[[i] for i in range(1,21)]
257 y=[[i] for i in (f[0:20])]
258 #绘图过程
259 model = LinearRegression(copy_X=True, fit_intercept=True, n_jobs=1, normalize=False)
260 #线性回归建模
261 model.fit(X, y)
262 print('系数矩阵:\n',model.coef_)
263 print('线性回归模型:\n',model)
264 #使用模型预测
265 predicted = model.predict(X)
266 #绘制散点图,参数:x横轴 y纵轴
267 plt.scatter(X, y, marker='x')
268 plt.plot(X, predicted,c='r')
269 #绘制x轴和y轴坐标
270 plt.xlabel("序号")
271 plt.ylabel("房价")
272 plt.show()
273
274 #数据持久化
275 import xlwt
276 #设置数据的编码格式
277 book = xlwt.Workbook(encoding='utf-8',style_compression=0)
278 #建立一张sheet表
279 sheet = book.add_sheet('单价',cell_overwrite_ok=True)
280 #列名
281 col = ['户型','面积','楼层','朝向','建成时间','经纪人','地址','单价']
282 for i in range(0,8):
283         sheet.write(0,i,col[i])
284 #户型
285 m1=0
286 for i in c1.index:
287             m1+=1
288             sheet.write(m1,0,c1[i])
289 #面积
290 m2=0
291 for i in c2.index:
292             m2+=1
293             sheet.write(m2,1,c2[i])
294 #楼层
295 m3=0
296 for i in c3.index:
297             m3+=1
298             sheet.write(m3,2,c3[i])
299 #朝向
300 m4=0
301 for i in c4.index:
302             m4+=1
303             sheet.write(m4,3,c4[i])
304 #建成时间
305 m5=0
306 for i in c5.index:
307             m5+=1
308             sheet.write(m5,4,c5[i])
309 #经纪人
310 m6=0
311 for i in c6.index:
312             m6+=1
313             sheet.write(m6,5,c6[i])
314 #地址
315 m7=0
316 for i in c7.index:
317             m7+=1
318             sheet.write(m7,6,c7[i])
319 #房价
320 k=0
321 for i in c.index:
322             k+=1
323             sheet.write(k,7,c[i])
324 #保存文件
325 savepath = 'C:/Users/XUWENCH/Desktop/表格.xls'
326 book.save(savepath)
五、总结
1.经过对主题数据的分析与可视化,可以得到哪些结论?是否达到预期的目标?
经过对在售房的信息分析,得出目前主要以三室两厅的户型为主流,面积则是相对发达地区以110平方米以下为主,相对落后地区以110平方米以上为主,房子朝向都是以朝南为主。通过对相对落后地区房价的可视化,分析得出房价主要在六千每平方米左右,五千每平方米以下的房源多余六千每平方米以上的房源。整理的信息对购房者大致了解在售房有一定的用处,但具体的房子的结构、周围的环境等,还需购房者通过其他渠道了解。
2.在完成此设计过程中,得到哪些收获?以及要改进的建议?
通过完成此次设计,使我受益匪浅。此次设计涉及大量的专业知识,让我不仅巩固了过往学习过的知识,起到查缺补漏的作用,还增加了我对新领域的探索,是一次比较大收获。还需改进的地方是数据处理部分,数据的转换步骤较为繁琐有待优化。

 浙公网安备 33010602011771号