柱状图
年度销售额统计
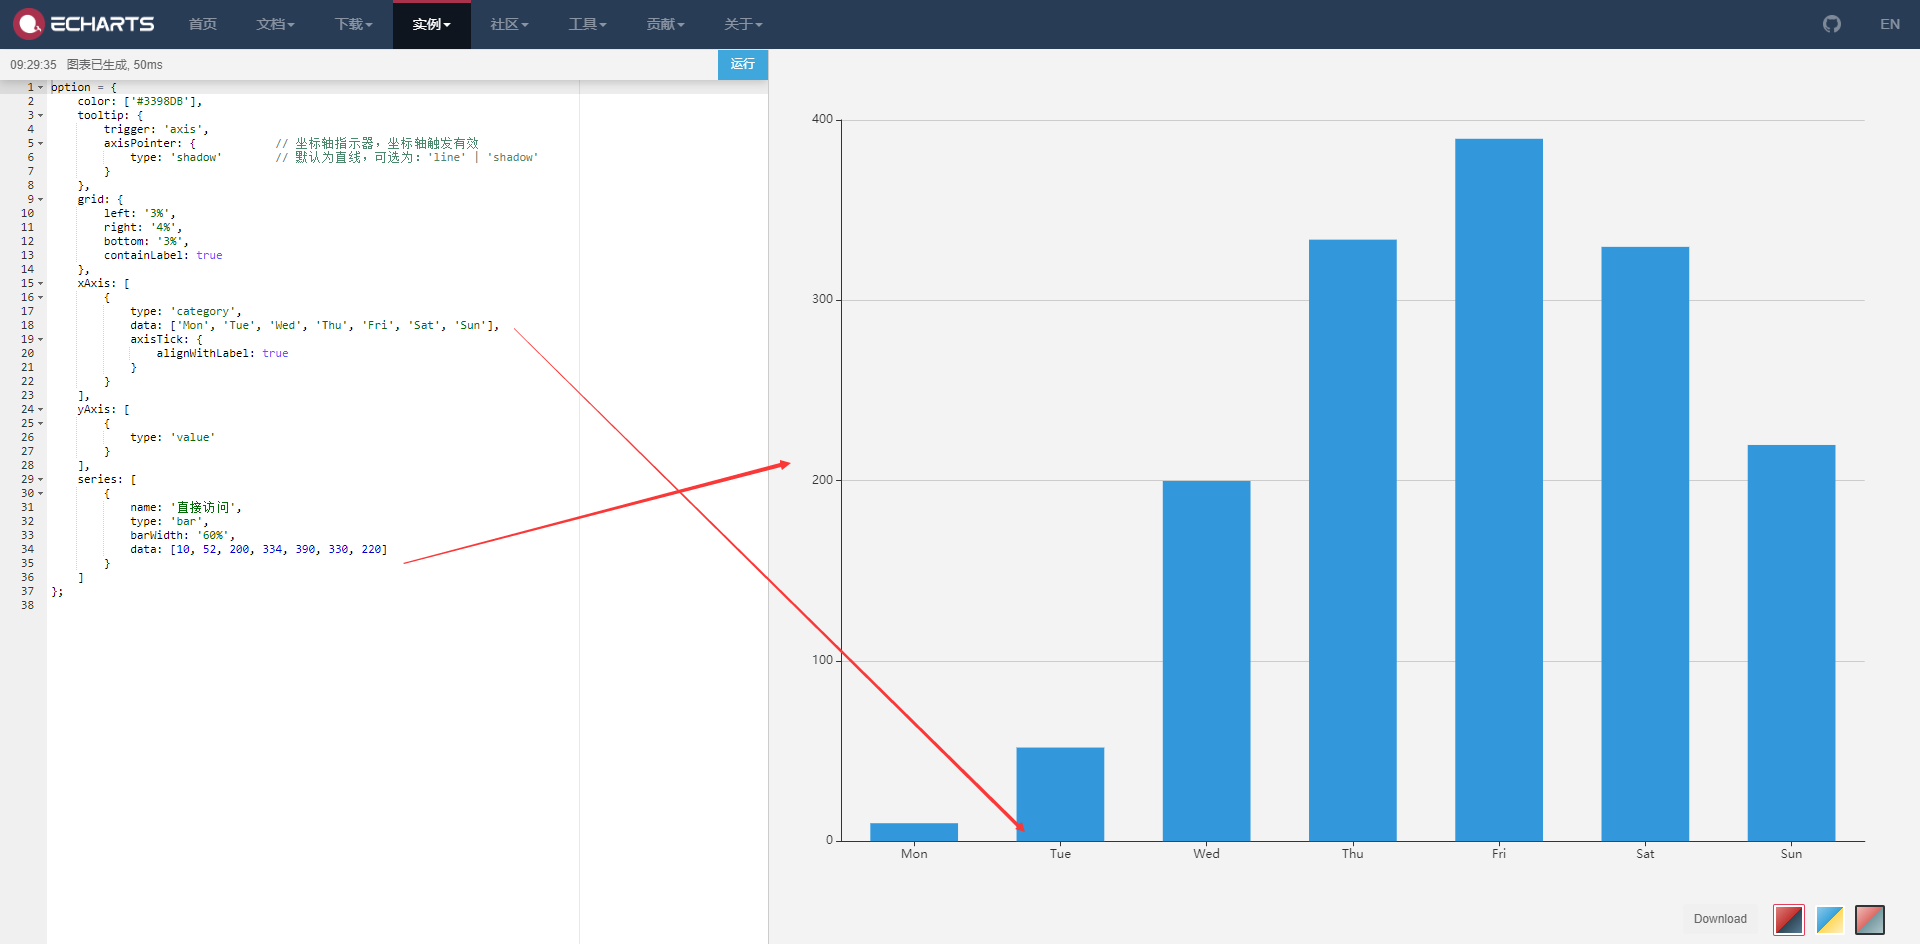
首先在该网站编写,实例数据,然后下载页面
https://www.echartsjs.com/examples/zh/editor.html?c=bar-tick-align
引入echarts核心Js文件

<script type="text/javascript" src="/resources/common/echarts.min.js"></script>
页面的修改

<!--年度销售额统计开始-->
<div class="layui-col-lg6 layui-col-md12" id="customerStatistica2">
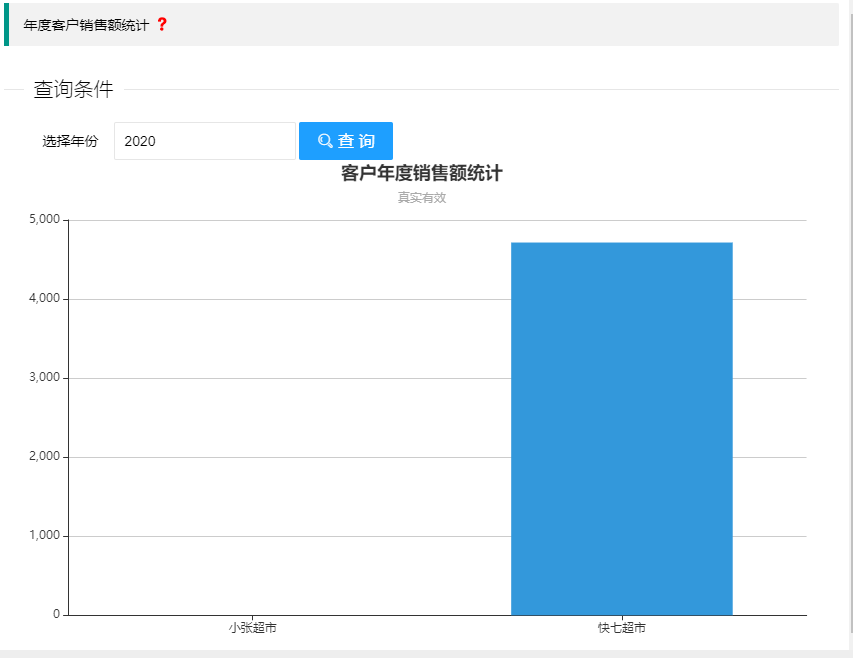
<blockquote class="layui-elem-quote title">年度客户销售额统计<i class="layui-icon layui-red"> </i></blockquote>
<fieldset class="layui-elem-field layui-field-title" style="margin-top: 30px;">
<legend>查询条件</legend>
</fieldset>
<div class="layui-form">
<div class="layui-inline">
<div class="layui-inline">
<label class="layui-form-label">选择年份</label>
<div class="layui-input-inline">
<input type="text" name="yaer" class="layui-input" id="year" placeholder="请选择年份">
</div>
</div>
</div>
<div class="layui-inline">
<button type="button" class="layui-btn layui-btn-normal layui-icon layui-icon-search" id="doSearch"> 查 询 </button>
</div>
</div>
<div id="container2" style="height: 100%"></div>
</div>
<!--年度销售额统计结束-->
JavaScript的修改
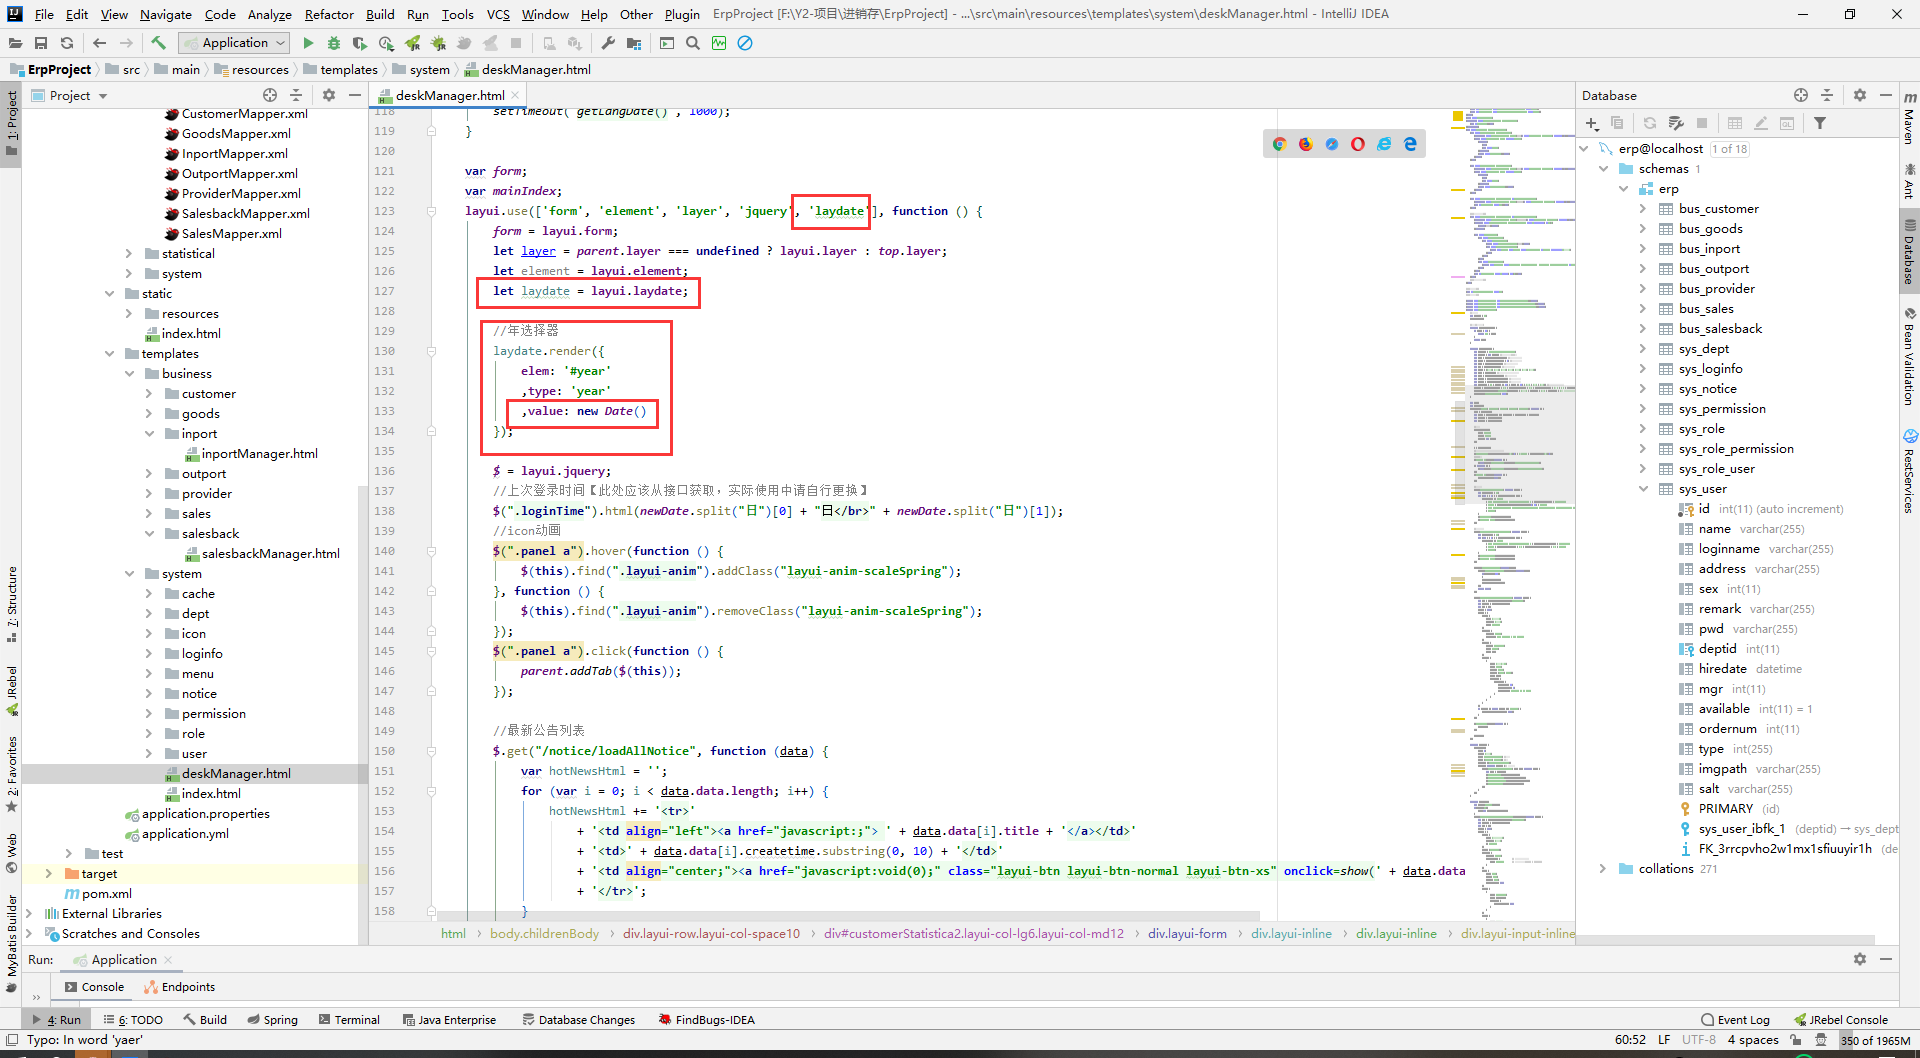
layui日期的初始化
请求数据并显示
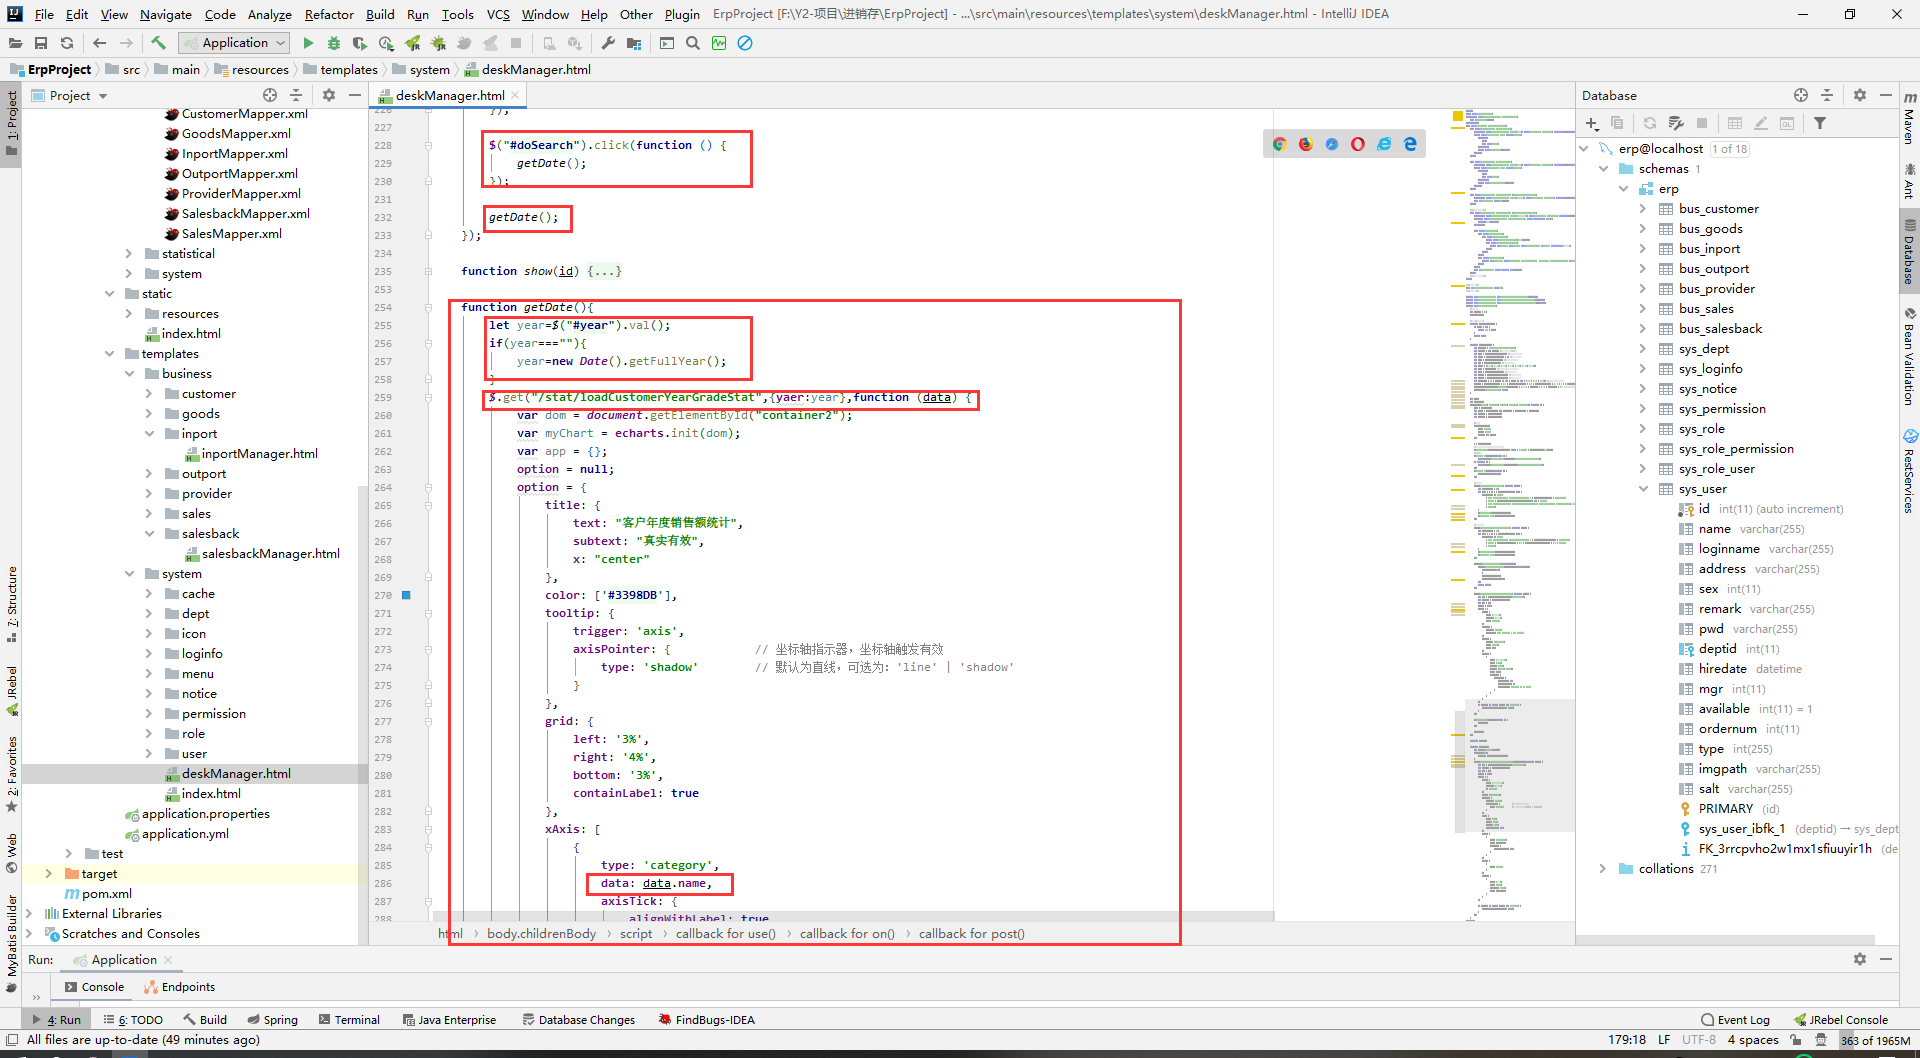
$("#doSearch").click(function () {
            getDate();
});

getDate();

function getDate(){
        let year=$("#year").val();
        if(year===""){
            year=new Date().getFullYear();
        }
        $.get("/stat/loadCustomerYearGradeStat",{yaer:year},function (data) {
            var dom = document.getElementById("container2");
            var myChart = echarts.init(dom);
            var app = {};
            option = null;
            option = {
                title: {
                    text: "客户年度销售额统计",
                    subtext: "真实有效",
                    x: "center"
                },
                color: ['#3398DB'],
                tooltip: {
                    trigger: 'axis',
                    axisPointer: {            // 坐标轴指示器,坐标轴触发有效
                        type: 'shadow'        // 默认为直线,可选为:'line' | 'shadow'
                    }
                },
                grid: {
                    left: '3%',
                    right: '4%',
                    bottom: '3%',
                    containLabel: true
                },
                xAxis: [
                    {
                        type: 'category',
                        data: data.name,
                        axisTick: {
                            alignWithLabel: true
                        }
                    }
                ],
                yAxis: [
                    {
                        type: 'value'
                    }
                ],
                series: [
                    {
                        name: '销售额',
                        type: 'bar',
                        barWidth: '60%',
                        data: data.value
                    }
                ]
            };

            if (option && typeof option === "object") {
                myChart.setOption(option, true);
            }
        });
    }
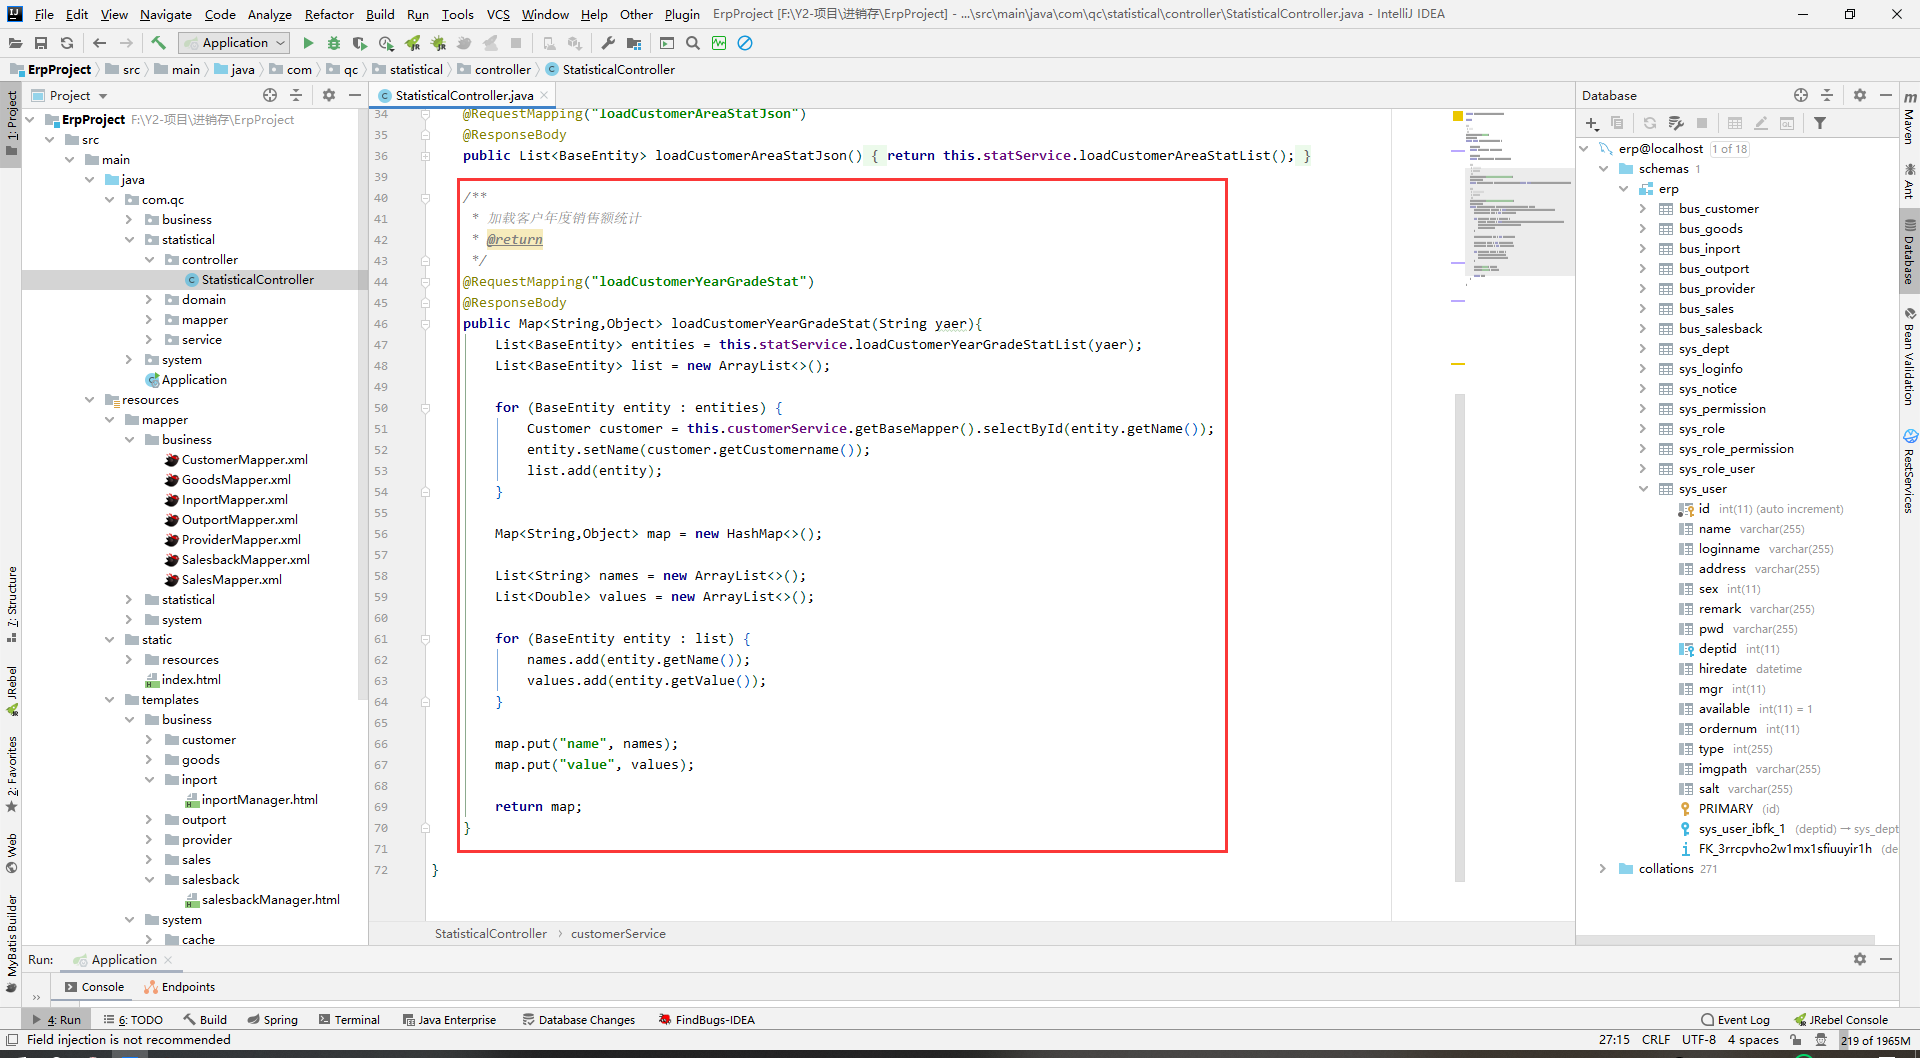
StatisticalController
@Autowired
private ICustomerService customerService;

/**
     * 加载客户年度销售额统计
     * @return
     */
    @RequestMapping("loadCustomerYearGradeStat")
    @ResponseBody
    public Map<String,Object> loadCustomerYearGradeStat(String yaer){
        List<BaseEntity> entities = this.statService.loadCustomerYearGradeStatList(yaer);
        List<BaseEntity> list = new ArrayList<>();

        for (BaseEntity entity : entities) {
            Customer customer = this.customerService.getBaseMapper().selectById(entity.getName());
            entity.setName(customer.getCustomername());
            list.add(entity);
        }

        Map<String,Object> map = new HashMap<>();

        List<String> names = new ArrayList<>();
        List<Double> values = new ArrayList<>();

        for (BaseEntity entity : list) {
            names.add(entity.getName());
            values.add(entity.getValue());
        }

        map.put("name", names);
        map.put("value", values);

        return map;
}
StatService
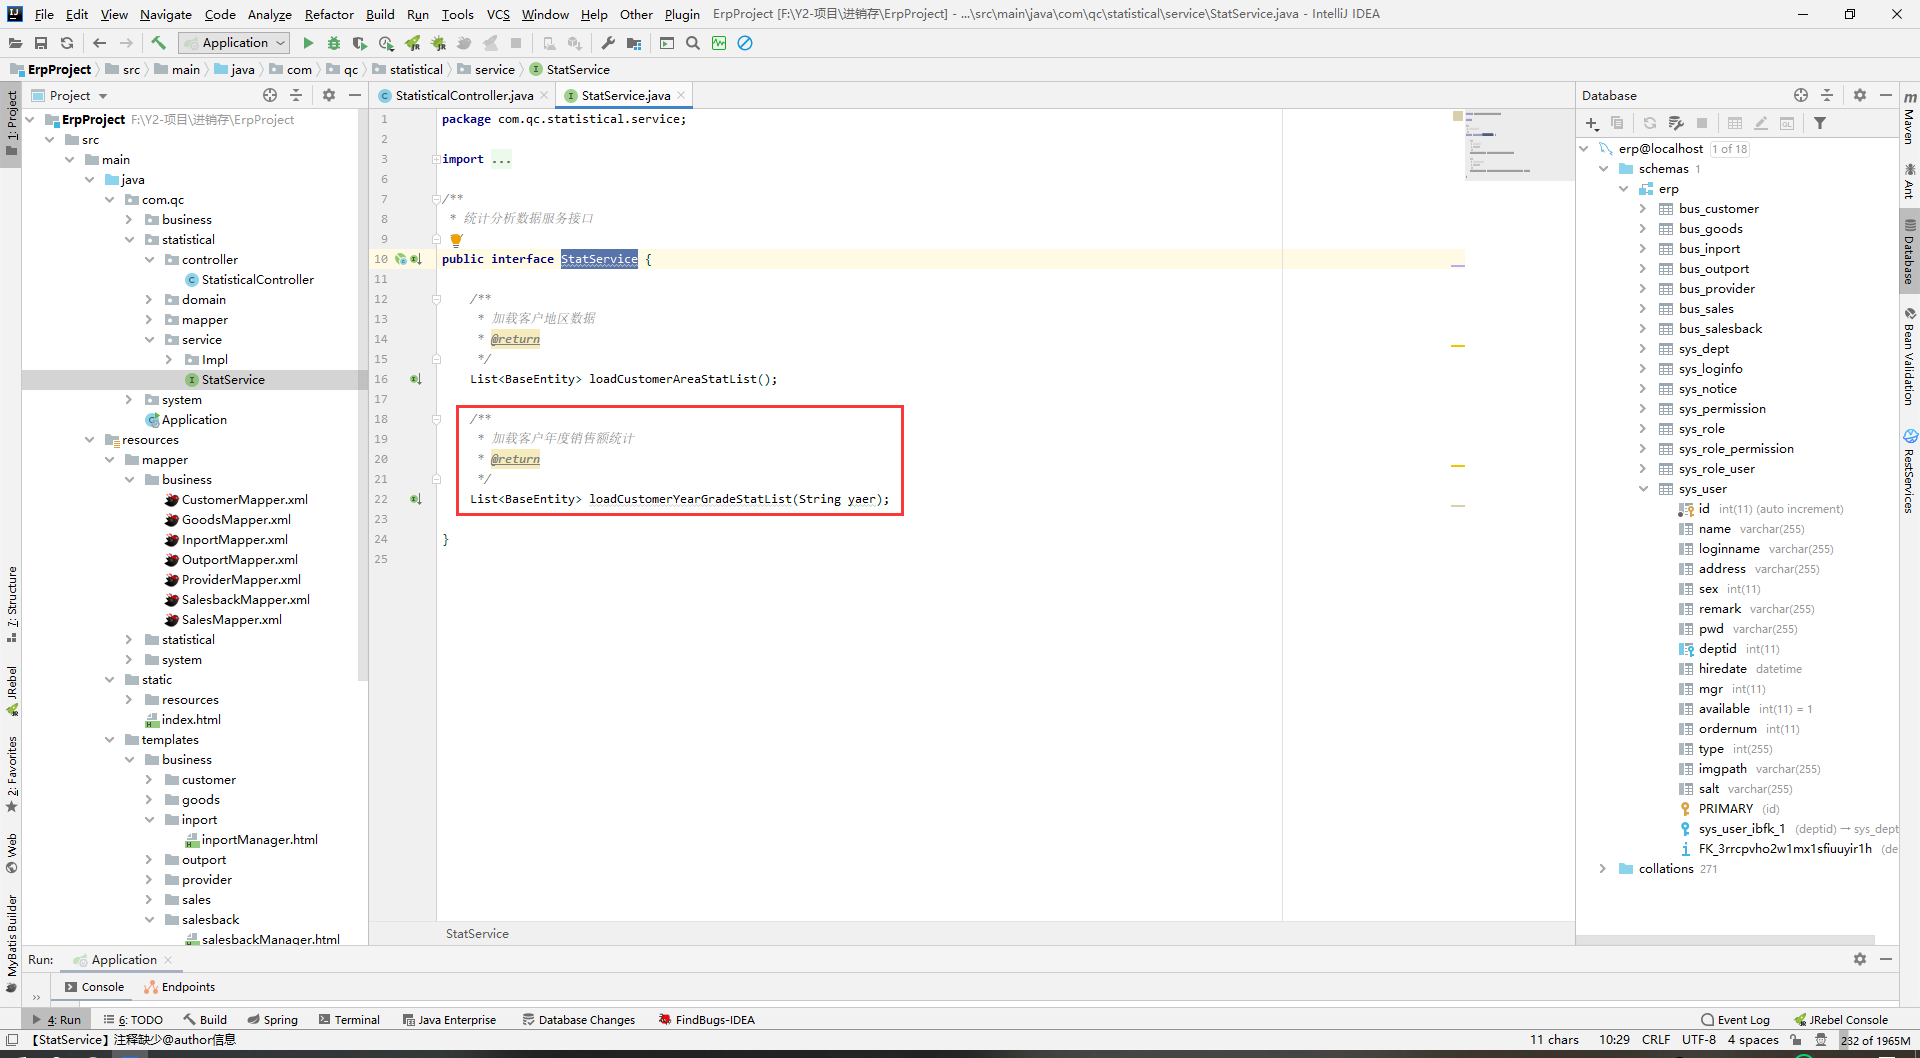
/**
     * 加载客户年度销售额统计
     * @return
     */
    List<BaseEntity> loadCustomerYearGradeStatList(String yaer);
StatServiceImpl
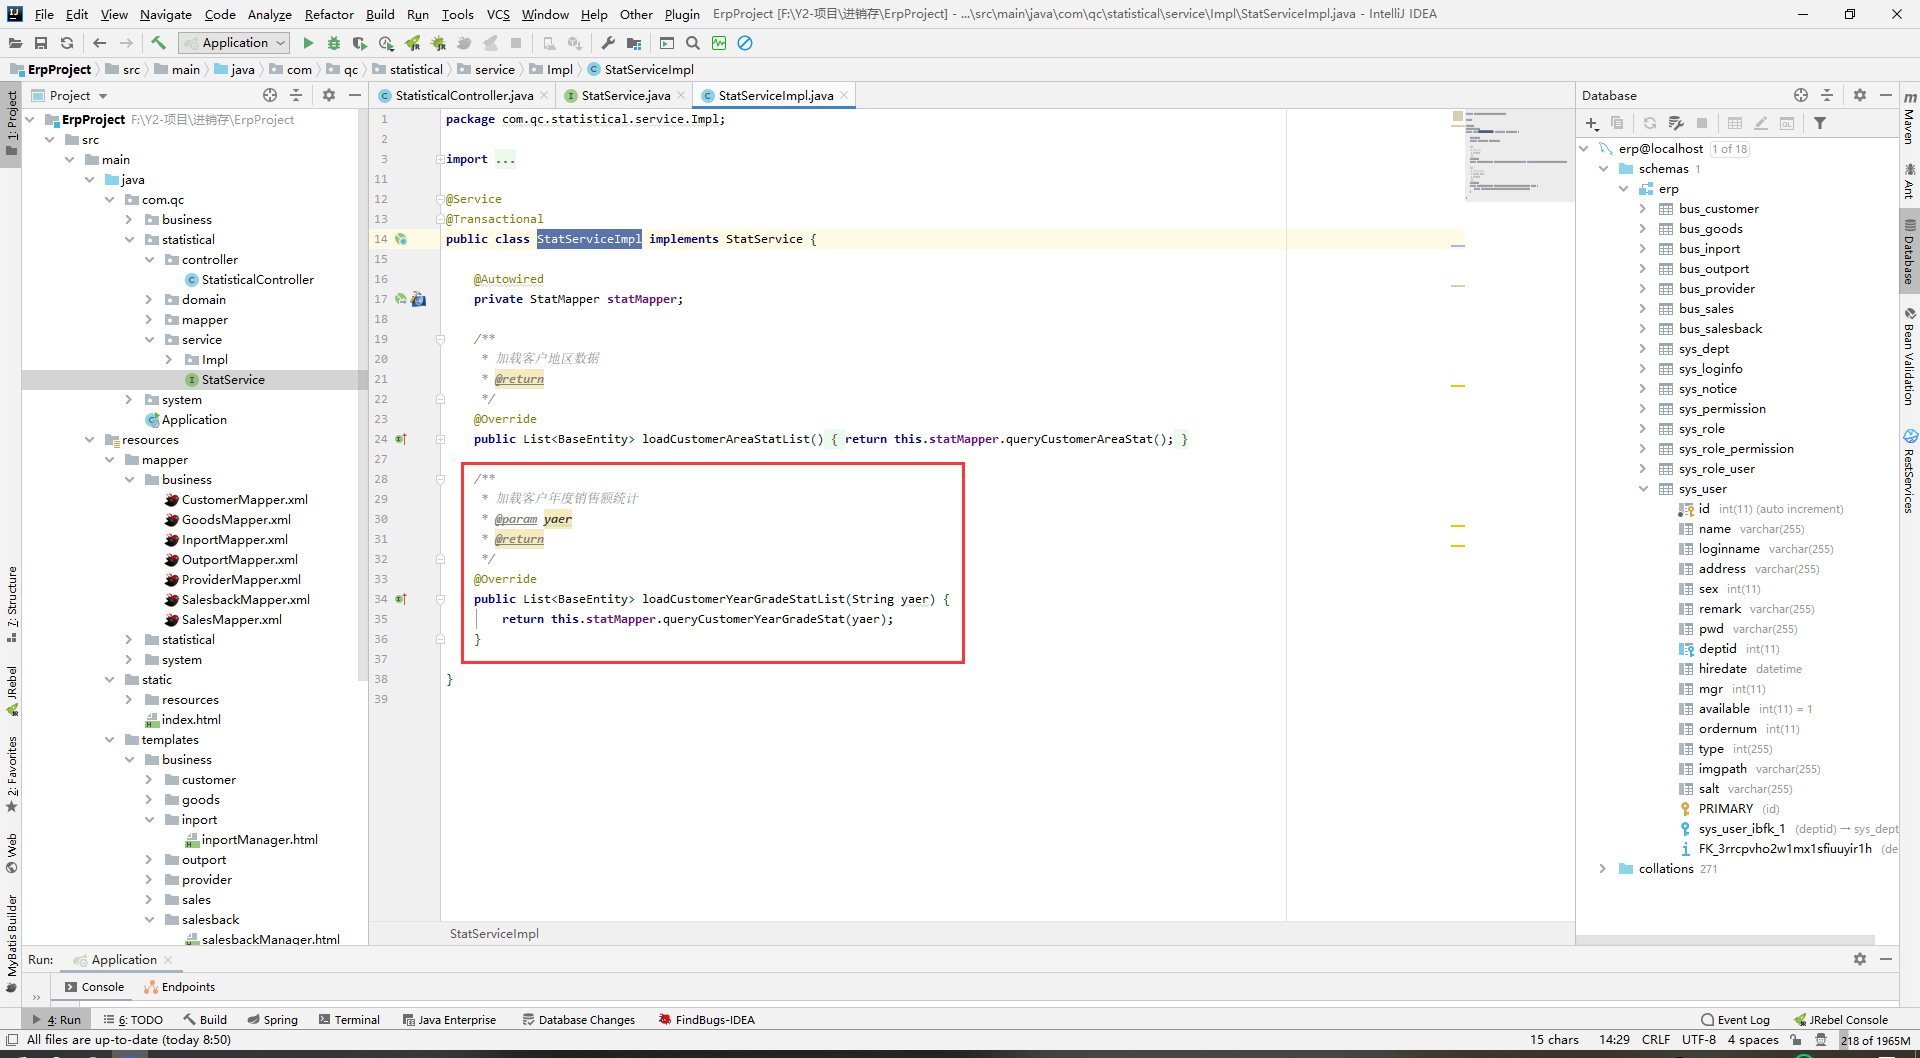
/**
     * 加载客户年度销售额统计
     * @param yaer
     * @return
     */
    @Override
    public List<BaseEntity> loadCustomerYearGradeStatList(String yaer) {
        return this.statMapper.queryCustomerYearGradeStat(yaer);
    }
StatMapper
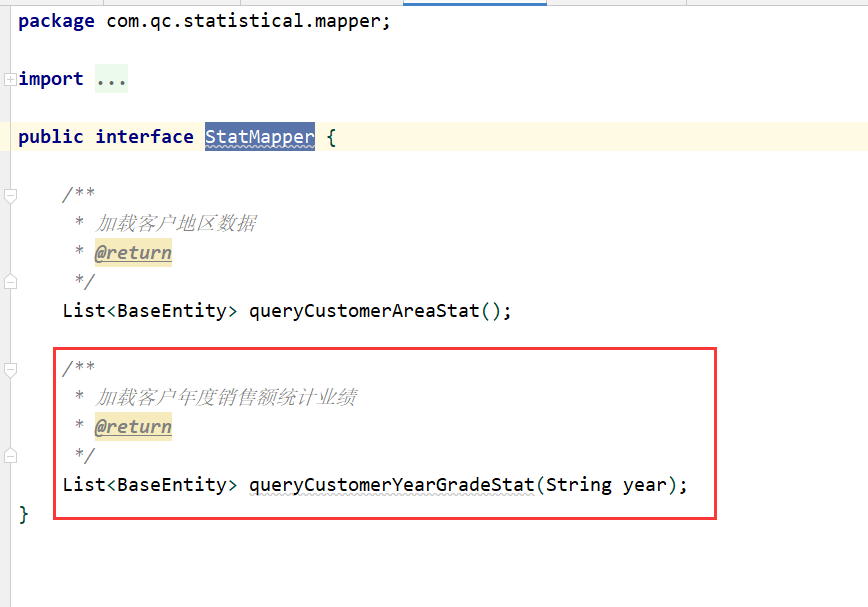
/**
     * 加载客户年度销售额统计业绩
     * @return
     */
    List<BaseEntity> queryCustomerYearGradeStat(String year);
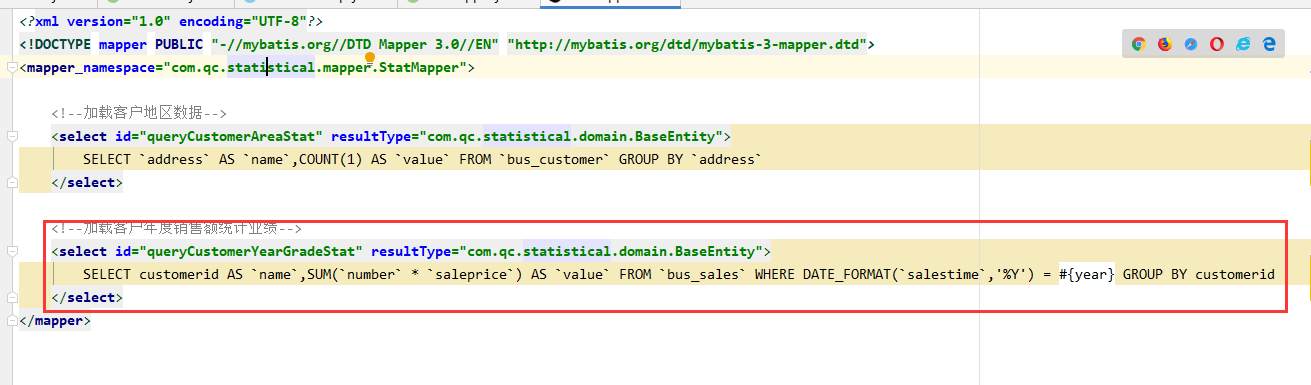
StatMapper.xml
最终效果

 浙公网安备 33010602011771号