echarts 水球图
本文章出自:
作者:你不知道的巨蟹
前言
echarts5 官网:https://echarts.apache.org/
echarts-liquidfill 水球图插件官网: https://www.npmjs.com/package/echarts-liquidfill
官方效果图:
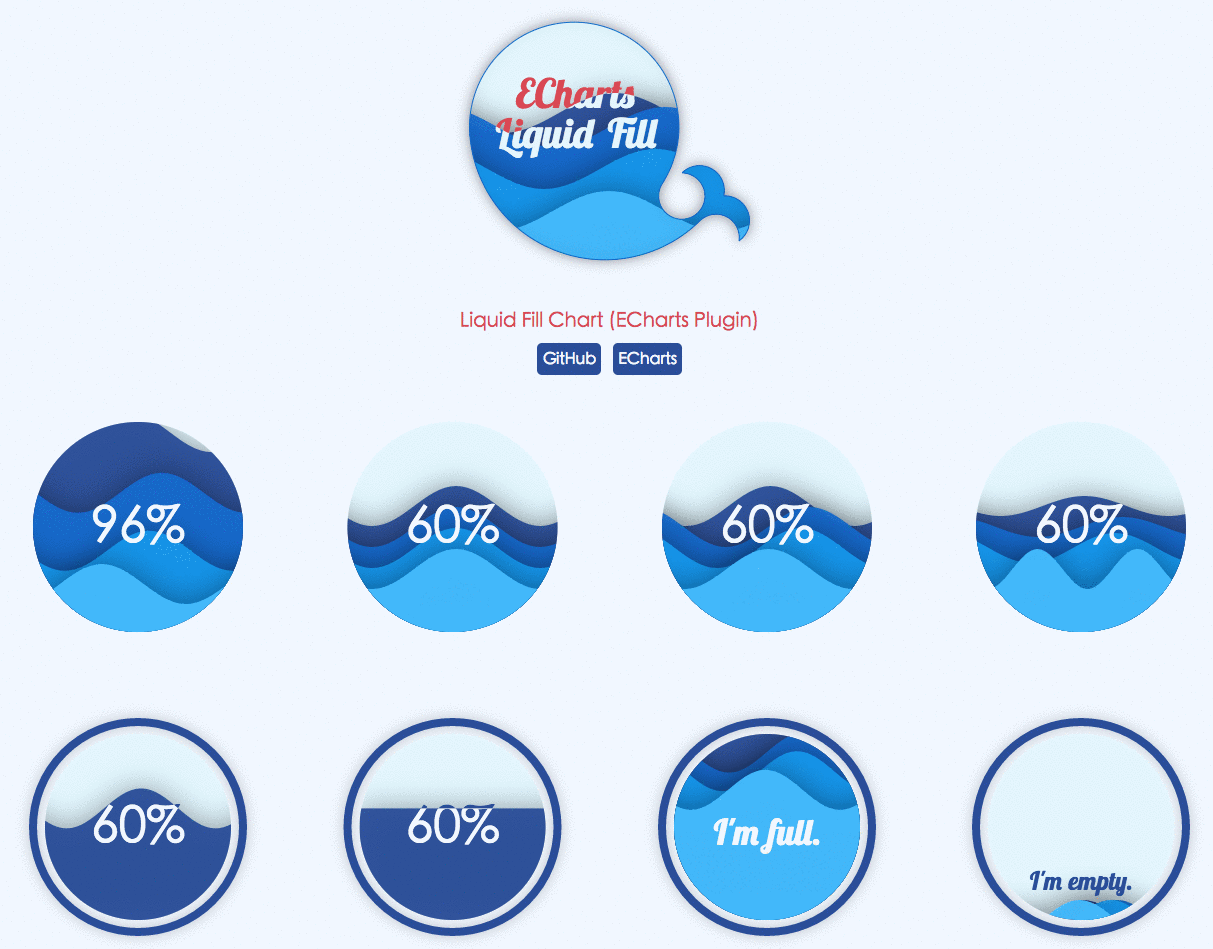
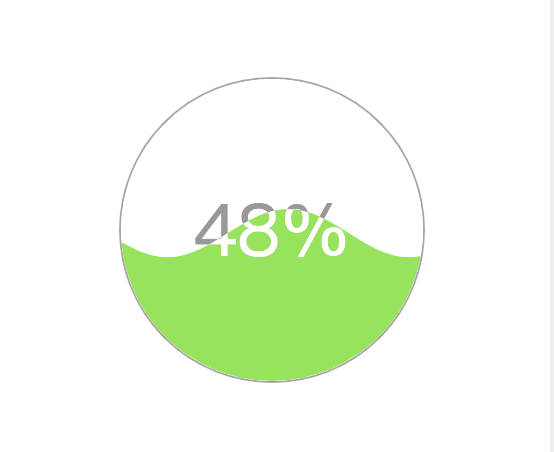
我们可以基于上图做样式定制,如下图
安装
npm install echarts --save
npm install echarts-liquidfill --save
1. echarts-liquidfill 基于 echarts,所以要确保已经安装了 echarts
2. echarts4 需要安装 echarts-liquidfill@2.0.6 版本,echarts5 需要安装 echarts-liquidfill@3.0.0 及以上版本
引入
echarts4 的引入方式
import Echarts from 'echarts'
import 'echarts-liquidfill’
echarts5 的引入方式
import * as echarts from 'echarts';
import 'echarts-liquidfill'
基本使用示例
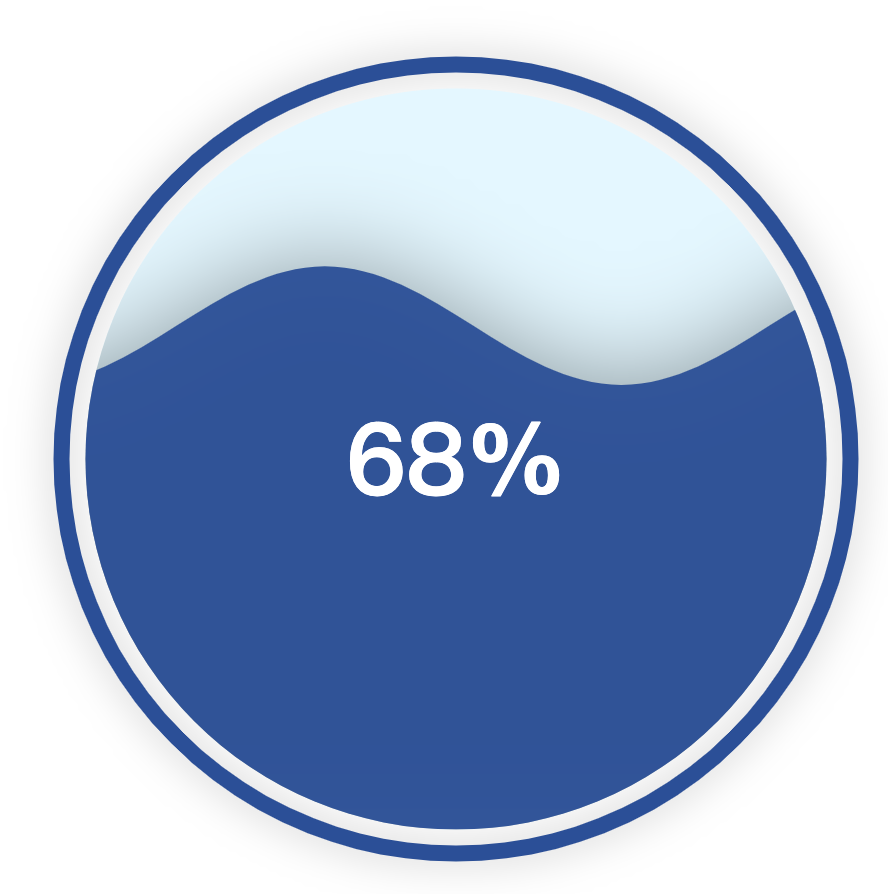
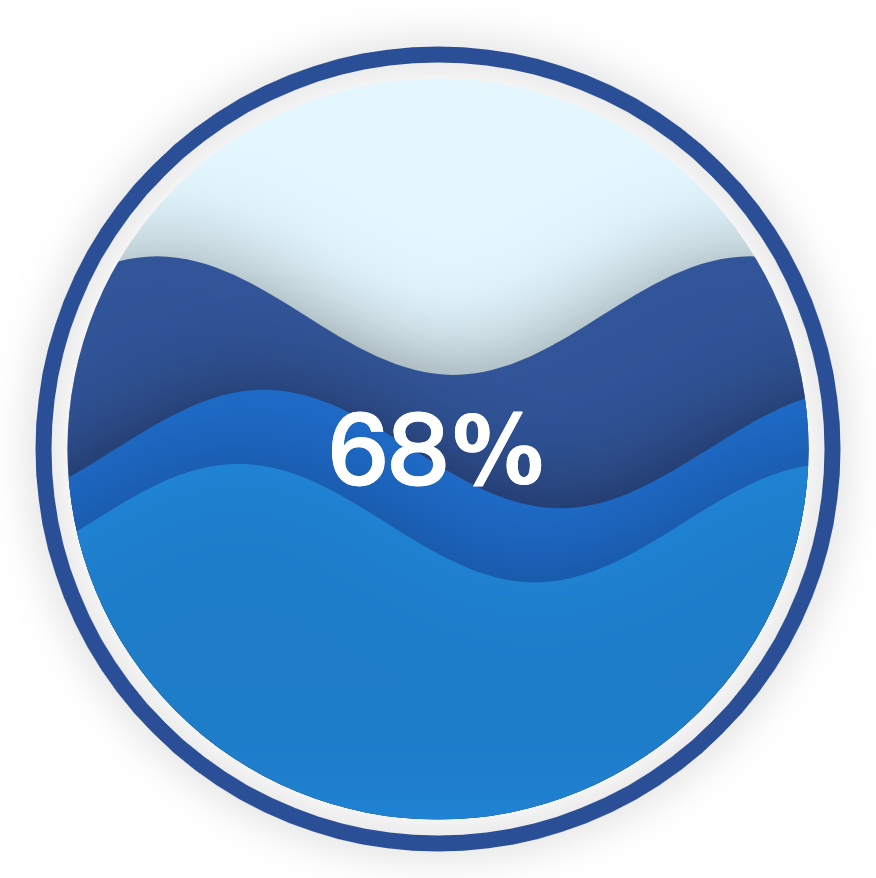
1. 一个波浪

<template>
    <div id="container" class="liquidfill-container"></div>
</template>

<script>
    import 'echarts-liquidfill'
    export default {
        name: 'LiquidfillTest',
        mounted () {
            const data = [0.68] // 显示一个波浪
            const dom = document.getElementById('container')
            const chart = this.$echarts.init(dom)
            chart.setOption({
                series: [{
                    type: 'liquidFill',
                    data: data
                }]
            })
        }
    }
</script>

<style lang="scss" scoped>
.liquidfill-container {
    width: 100%;
    height: 100%;
}
</style>
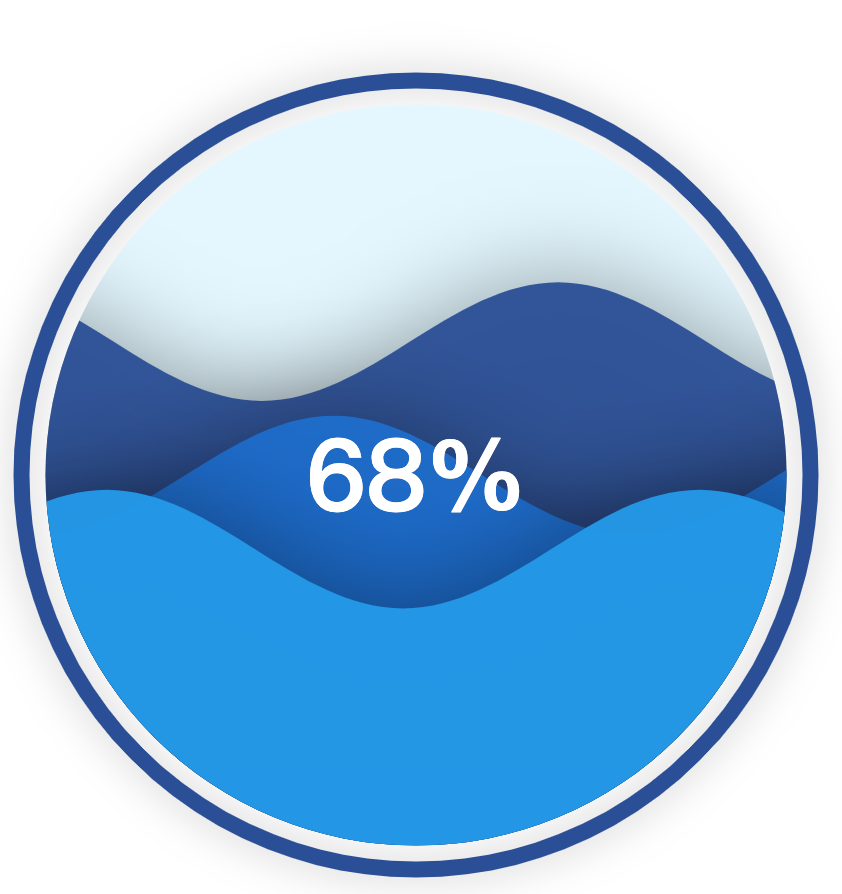
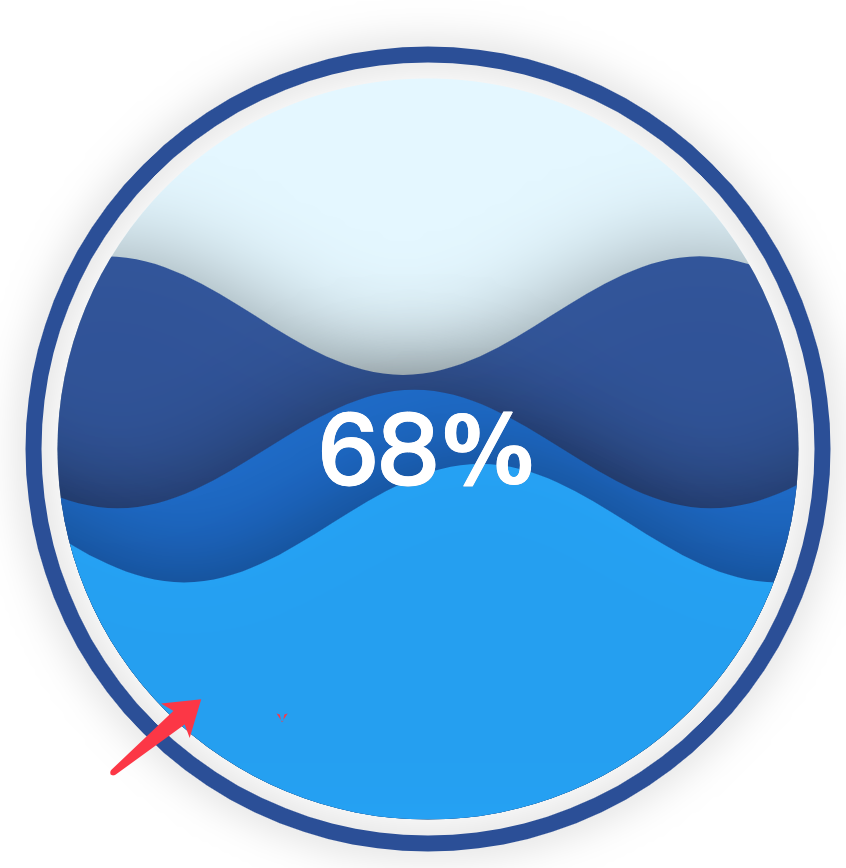
2. 显示多个波浪
<template>
    <div id="container" class="liquidfill-container"></div>
</template>

<script>
    import 'echarts-liquidfill'
    export default {
        name: 'LiquidfillTest',
        mounted () {
            const data = [0.68, 0.5, 0.4] // 显示多个波浪, 并且数值必须从大到小排列, 若从小到大排列,最大的波浪会遮挡住其余比它小的波浪
            const dom = document.getElementById('container')
            const chart = this.$echarts.init(dom)
            chart.setOption({
                series: [{
                    type: 'liquidFill',
                    data: data
                }]
            })
        }
    }
</script>

<style lang="scss" scoped>
.liquidfill-container {
    width: 100%;
    height: 100%;
}
</style>
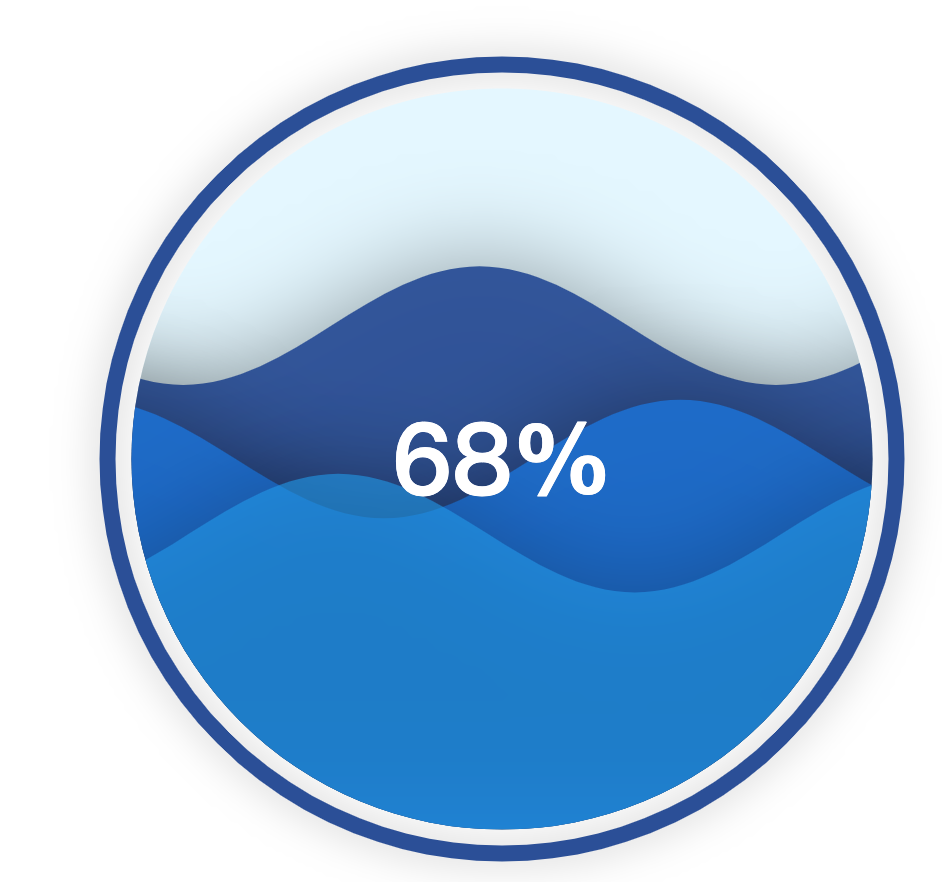
3. itemStyle,emphasis 属性分别给其中一个波浪设置透明度以及 hover 后的样式
<template>
    <div id="container" class="liquidfill-container"></div>
</template>

<script>
    import 'echarts-liquidfill'
    export default {
        name: 'LiquidfillTest',
        mounted () {
             const data = [0.68, 0.5, { // 如果只想给其中某一个波浪,比如最后一个波浪设置透明度以及鼠标移入的透明度
                value: 0.4,
                itemStyle: {
                    opacity: 0.6
                },
                emphasis: {
                    itemStyle: {
                        opacity: 0.9
                    }
                }
            }]
            const dom = document.getElementById('container')
            const chart = this.$echarts.init(dom)
            chart.setOption({
                series: [{
                    type: 'liquidFill',
                    data: data
                }]
            })
        }
    }
</script>

<style lang="scss" scoped>
.liquidfill-container {
    width: 100%;
    height: 100%;
}
</style>
4. direction 属性,设置波浪往不同的方向浮动,比如,一条波浪从左往右,另外两条波浪从右往左
<template>
    <div id="container" class="liquidfill-container"></div>
</template>

<script>
    import 'echarts-liquidfill'
    export default {
        name: 'LiquidfillTest',
        mounted () {
             const data = [0.68, 0.5, { // 如果只想给其中某一个波浪,比如最后一个波浪设置透明度以及鼠标移入的透明度
                value: 0.4,
                direction: 'left', // 让波浪往不同的方向浮动,比如这里设置往左,未设置的波浪会往右
                itemStyle: {
                    opacity: 0.6
                },
                emphasis: {
                    itemStyle: {
                        opacity: 0.9
                    }
                }
            }]
            const dom = document.getElementById('container')
            const chart = this.$echarts.init(dom)
            chart.setOption({
                series: [{
                    type: 'liquidFill',
                    data: data
                }]
            })
        }
    }
</script>

<style lang="scss" scoped>
.liquidfill-container {
    width: 100%;
    height: 100%;
}
</style>
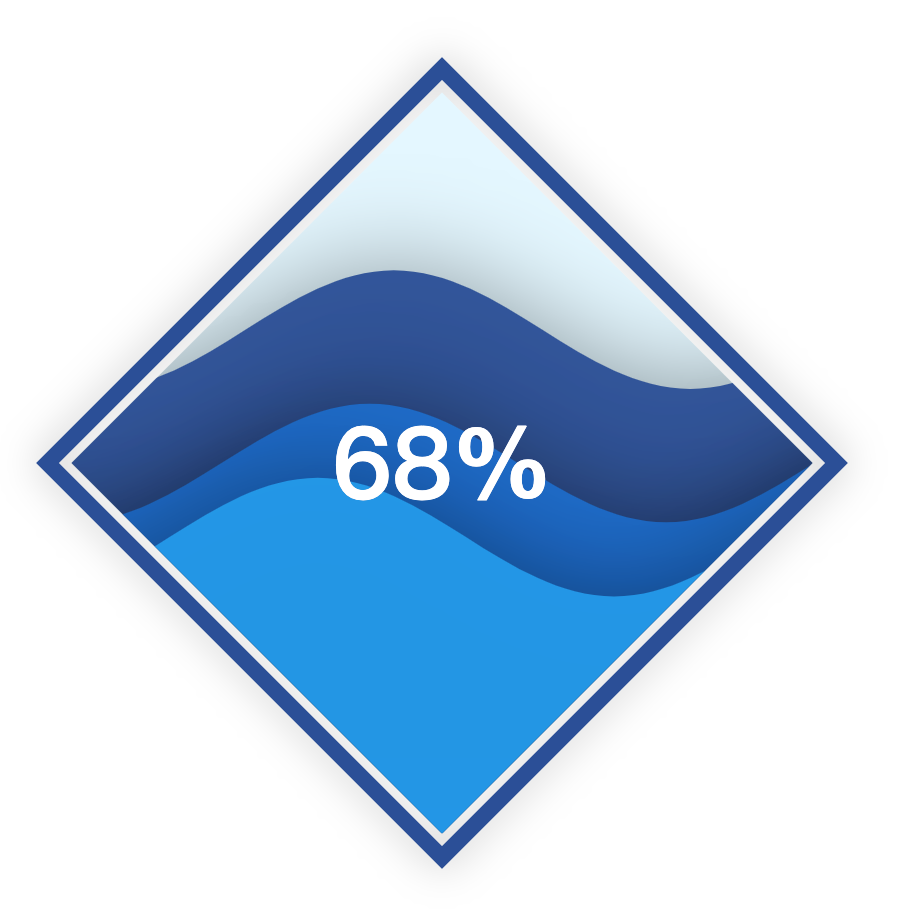
5. shape 属性改变水球的形状,默认为 circle
<template>
    <div id="container" class="liquidfill-container"></div>
</template>

<script>
    import 'echarts-liquidfill'
    export default {
        name: 'LiquidfillTest',
        mounted () {
            const data = [0.68, 0.5, 0.4]
            const dom = document.getElementById('container')
            const chart = this.$echarts.init(dom)
            chart.setOption({
                series: [{
                    type: 'liquidFill',
                    data: data,
                    shape: 'diamond' // 改变水球图的形状,比如 'circle', 'rect', 'roundRect', 'triangle', 'diamond', 'pin', 'arrow'
                }]
            })
        }
    }
</script>

<style lang="scss" scoped>
.liquidfill-container {
    width: 100%;
    height: 100%;
}
</style>
6. color 属性,修改波浪的颜色
并会自动与下面代码 data 中的数据从大到小进行映射,如,red-0.68;blue-0.5;yellow-0.4
<template>
    <div id="container" class="liquidfill-container"></div>
</template>

<script>
    import 'echarts-liquidfill'
    export default {
        name: 'LiquidfillTest',
        mounted () {
             const data = [0.68, 0.5, 0.4]
            const dom = document.getElementById('container')
            const chart = this.$echarts.init(dom)
            chart.setOption({
                series: [{
                    type: 'liquidFill',
                    data: data,
                    shape: 'circle', // 改变水球图的形状,比如 'circle', 'rect', 'roundRect', 'triangle', 'diamond', 'pin', 'arrow'
                    color: ['red', 'blue', 'yellow'] // 修改波浪的颜色,并会自动与 data 中的数据从大到小进行映射,如,red-0.68;blue-0.5;yellow-0.4
                }]
            })
        }
    }
</script>

<style lang="scss" scoped>
.liquidfill-container {
    width: 100%;
    height: 100%;
}
</style>
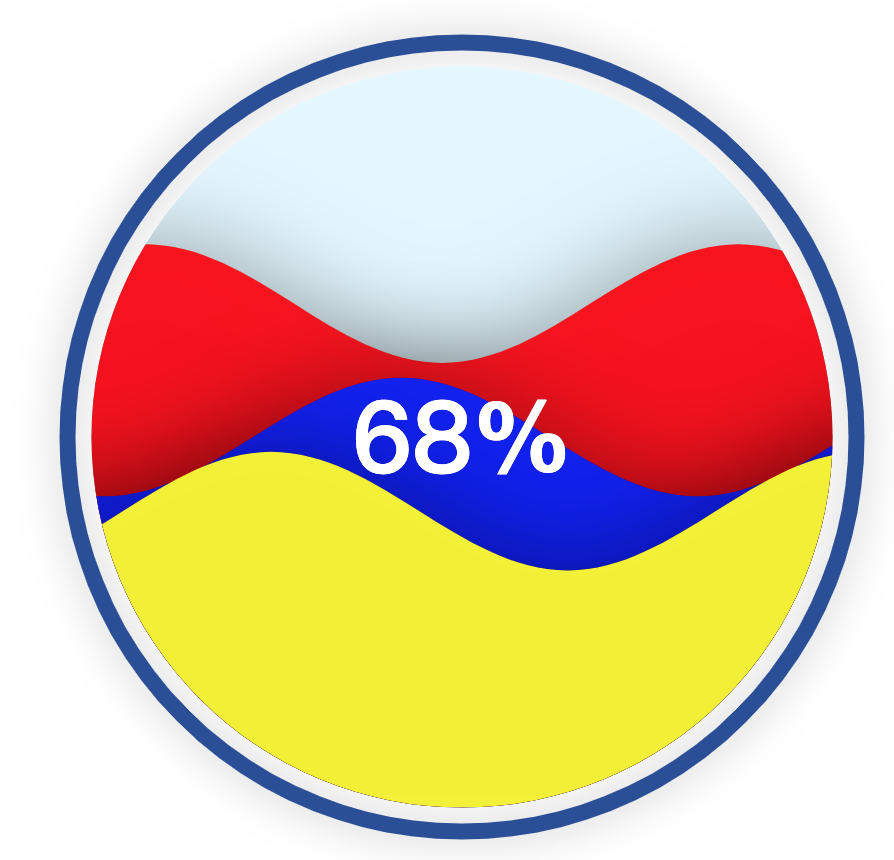
7. background 属性,修改水球图背景颜色
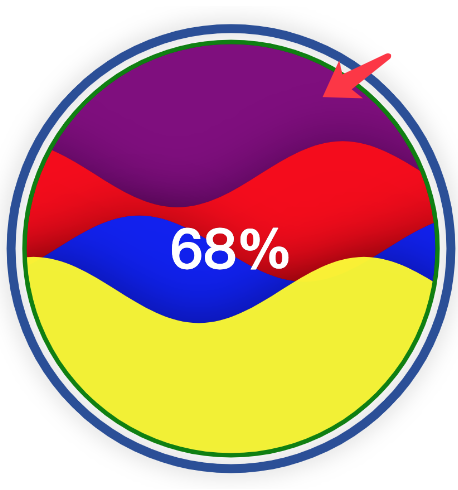
<template>
    <div id="container" class="liquidfill-container"></div>
</template>

<script>
    import 'echarts-liquidfill'
    export default {
        name: 'LiquidfillTest',
        mounted () {
             const data = [0.68, 0.5, 0.4]
            const dom = document.getElementById('container')
            const chart = this.$echarts.init(dom)
            chart.setOption({
                series: [{
                    type: 'liquidFill',
                    data: data,
                    shape: 'circle', // 改变水球图的形状,比如 'circle', 'rect', 'roundRect', 'triangle', 'diamond', 'pin', 'arrow'
                    color: ['red', 'blue', 'yellow'], // 修改波浪的颜色,并会自动与 data 中的数据从大到小进行映射,如,red-0.68;blue-0.5;yellow-0.4
                     backgroundStyle: {
                        color: 'purple', // 修改背景颜色
                        borderWidth: 4, // 修改背景边框宽度
                        borderColor: 'green' // 修改背景边框的颜色
                    }
                }]
            })
        }
    }
</script>

<style lang="scss" scoped>
.liquidfill-container {
    width: 100%;
    height: 100%;
}
</style>
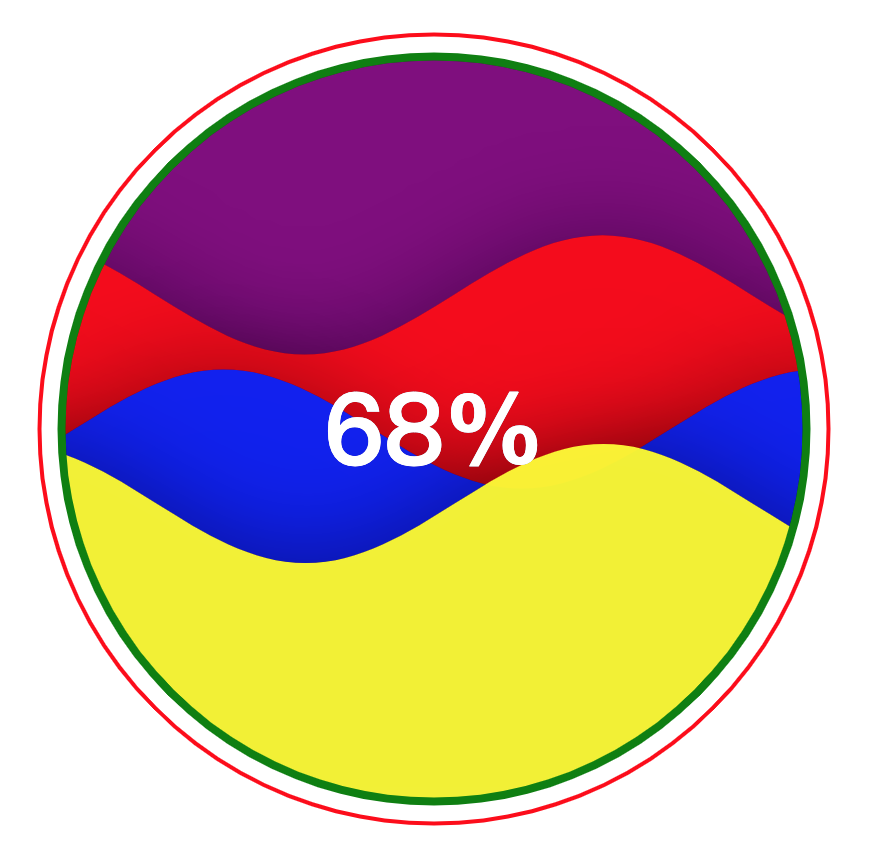
8. outline 属性,修改外层样式
<template>
    <div id="container" class="liquidfill-container"></div>
</template>

<script>
    import 'echarts-liquidfill'
    export default {
        name: 'LiquidfillTest',
        mounted () {
             const data = [0.68, 0.5, 0.4]
            const dom = document.getElementById('container')
            const chart = this.$echarts.init(dom)
            chart.setOption({
                series: [{
                    type: 'liquidFill',
                    data: data,
                    shape: 'circle', // 改变水球图的形状,比如 'circle', 'rect', 'roundRect', 'triangle', 'diamond', 'pin', 'arrow'
                    color: ['red', 'blue', 'yellow'], // 修改波浪的颜色,并会自动与 data 中的数据从大到小进行映射,如,red-0.68;blue-0.5;yellow-0.4
                     backgroundStyle: {
                        color: 'purple', // 修改背景颜色
                        borderWidth: 4, // 修改背景边框宽度
                        borderColor: 'green' // 修改背景边框的颜色
                    },
                     outline: { // 修改外层样式
                        show: true,
                        borderDistance: 10, // 设置和外层轮廓的间距
                        itemStyle: {
                            borderWidth: 2, // 设置外层边框宽度
                            borderColor: 'red', // 设置外层边框颜色
                            shadowBlur: 'none' // 消除外层边框阴影
                        }
                    }
                }]
            })
        }
    }
</script>

<style lang="scss" scoped>
.liquidfill-container {
    width: 100%;
    height: 100%;
}
</style>
注:因为想偷懒,水球效果图没有做动图,所以有一些效果设置截图后也看不出效果,我把完整示例和注释附上😂
完整示例 Demo
<template>
    <div id="container" class="liquidfill-container"></div>
</template>

<script>
    import 'echarts-liquidfill'
    export default {
        name: 'LiquidfillTest',
        mounted () {
            // const data = [0.68] // 显示一个波浪
            // const data = [0.68, 0.5, 0.4] // 显示多个波浪, 并且数值必须从大到小排列, 若从小到大排列,最大的波浪会遮挡住其余比它小的波浪
            const data = [0.68, 0.5, { // 如果只想给其中某一个波浪,比如最后一个波浪设置透明度以及鼠标移入的透明度
                value: 0.4,
                direction: 'left', // 让波浪往不同的方向浮动,比如这里设置往左,未设置的波浪会往右
                itemStyle: {
                    opacity: 0.6
                },
                emphasis: {
                    itemStyle: {
                        opacity: 0.9
                    }
                }
            }]
            const dom = document.getElementById('container')
            const chart = this.$echarts.init(dom)
            chart.setOption({
                series: [{
                    type: 'liquidFill',
                    data: data,
                    // radius: '100%', // 半径
                    shape: 'circle', // 改变水球图的形状,比如 'circle', 'rect', 'roundRect', 'triangle', 'diamond', 'pin', 'arrow'
                    color: ['red', 'blue', 'yellow'], // 修改波浪的颜色,并会自动与 data 中的数据从大到小进行映射,如,red-0.68;blue-0.5;yellow-0.4
                    // itemStyle: { // 设置水球透明度
                    //     opacity: 0.6
                    // },
                    // emphasis: { // 设置鼠标移入波浪后的透明度,不设置该数值,默认跟 itemStyle 中设置的一样,为 0.6
                    //     itemStyle: {
                    //         opacity: 0.9
                    //     }
                    // },
                    // waveAnimation: false, // 让波浪停止绘制,从动态变为静止,该属性最好和 AnimationDuration, AnimationDurationUpdate 一起设置
                    // AnimationDuration: 0,
                    // AnimationDurationUpdate: 0,
                    amplitude: 10, // 控制波浪的振幅,为 0,怎会变为直线的波纹并且波浪为静止,如果给 10,波纹明显幅度变小,50 则会很陡峭
                    backgroundStyle: {
                        color: 'purple', // 修改背景颜色
                        borderWidth: 4, // 修改背景边框宽度
                        borderColor: 'green' // 修改背景边框的颜色
                    },
                    outline: { // 修改外层样式
                        show: true,
                        borderDistance: 10, // 设置和外层轮廓的间距
                        itemStyle: {
                            borderWidth: 2, // 设置外层边框宽度
                            borderColor: 'red', // 设置外层边框颜色
                            shadowBlur: 'none' // 消除外层边框阴影
                        }
                    }
                    // outline: { // 隐藏外层
                    //     show: false
                    // }
                }]
            })
        }
    }
</script>

<style lang="scss" scoped>
.liquidfill-container {
    width: 100%;
    height: 100%;
}
</style>

 浙公网安备 33010602011771号