使用Matplotlib实现实时数据流可视化(animation模块)
先说一下自己的需求:为辣鸡项目所迫,有一硬件产生实时数据流,需要采集并动态展示数据变化规律,帧数在20-50帧
一.性能较差的方法
开始我是不知道有animation这个神器的,就用set_xdata/set_ydata更新数据,pause刷新图像
pltx = np.arange(0, 400, 10)
plty = [0 for length in range(0, 40)]
plt.ion()
fig = plt.figure()
ax = fig.add_subplot(111)
line, = ax .plot(pltx, plty)

def update()
    line.set_ydata(plty)
    plt.pause(0.001)
功能是实现了,但没想到效率极其坑爹,8组数据+20帧的配置就拽不动了,有明显的滞后。鬼知道它这个pause是怎么实现的。。
下面是正解:
二.FuncAnimation类
- 实现高效动画的核心就是FuncAnimation类(需要导入matplotlib.animation),提供用于更新数据的update和获取帧数的frames即可
看一下官方API文档的参数解释:
FuncAnimation(fig, func, frames=None, init_func=None, fargs=None, save_count=None, **kwargs)
fig : matplotlib.figure.Figure
The figure object that is used to get draw, resize, and any other needed events.
func : callable
The function to call at each frame. The first argument will be the next value in frames. Any additional positional arguments can be supplied via the fargs parameter.
frames : iterable, int, generator function, or None, optional
Source of data to pass func and each frame of the animation
If an iterable, then simply use the values provided. If the iterable has a length, it will override the save_count kwarg.
If an integer, then equivalent to passing range(frames)
If None, then equivalent to passing itertools.count.
In all of these cases, the values in frames is simply passed through to the user-supplied func and thus can be of any type.
init_func : callable, optional
A function used to draw a clear frame. If not given, the results of drawing from the first item in the frames sequence will be used. This function will be called once before the first frame.
If blit == True, init_func must return an iterable of artists to be re-drawn.
The required signature is:
def init_func() -> iterable_of_artists:
fargs : tuple or None, optional
Additional arguments to pass to each call to func.
save_count : int, optional
The number of values from frames to cache.
interval : number, optional
Delay between frames in milliseconds. Defaults to 200.
repeat_delay : number, optional
If the animation in repeated, adds a delay in milliseconds before repeating the animation. Defaults to None.
repeat : bool, optional
Controls whether the animation should repeat when the sequence of frames is completed. Defaults to True.
blit : bool, optional
Controls whether blitting is used to optimize drawing. Defaults to False.
说几个常用参数
-
update:
update函数接收一个frame参数作为当前帧数,可以根据帧数更新数据,也可以把帧数作为x计算y的值(函数动画)
返回更新数据后的plot对象
-
frames:
frames为每一帧调用的update函数提供帧数,可以是整数、可迭代对象或生产器函数,视具体情况而定
-
interval:
刷新时间间隔,以ms为单位
-
repeat:
控制当帧序列迭代完毕后是否重新迭代,默认为True
三.例子1
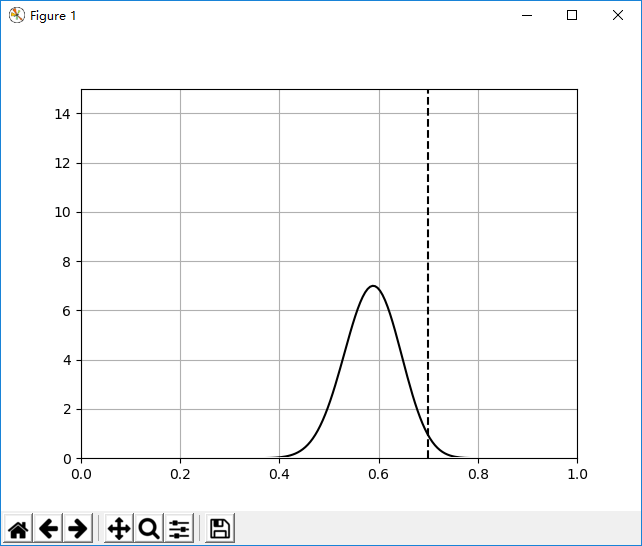
官方例子,贝叶斯函数动画:
import math

import numpy as np
import matplotlib.pyplot as plt
from matplotlib.animation import FuncAnimation


def beta_pdf(x, a, b):
    return (x**(a-1) * (1-x)**(b-1) * math.gamma(a + b)
            / (math.gamma(a) * math.gamma(b)))


class UpdateDist(object):
    def __init__(self, ax, prob=0.5):
        self.success = 0
        self.prob = prob
        self.line, = ax.plot([], [], 'k-')
        self.x = np.linspace(0, 1, 200)
        self.ax = ax

        # Set up plot parameters
        self.ax.set_xlim(0, 1)
        self.ax.set_ylim(0, 15)
        self.ax.grid(True)

        # This vertical line represents the theoretical value, to
        # which the plotted distribution should converge.
        self.ax.axvline(prob, linestyle='--', color='black')

    def init(self):
        self.success = 0
        self.line.set_data([], [])
        return self.line,

    def __call__(self, i):
        # This way the plot can continuously run and we just keep
        # watching new realizations of the process
        if i == 0:
            return self.init()

        # Choose success based on exceed a threshold with a uniform pick
        if np.random.rand(1,) < self.prob:
            self.success += 1
        y = beta_pdf(self.x, self.success + 1, (i - self.success) + 1)
        self.line.set_data(self.x, y)
        return self.line,

# Fixing random state for reproducibility
np.random.seed(19680801)


fig, ax = plt.subplots()
ud = UpdateDist(ax, prob=0.7)
anim = FuncAnimation(fig, ud, frames=np.arange(100), init_func=ud.init,
                     interval=5, blit=True)
plt.show()
- ud对象被调用时根据i计算贝叶斯函数值
- frames是包含0~99的numpy数组,同时也是一个可迭代对象
效果如图:
四.例子2
我的程序需要在每次新数据包发来时更新图像,但更新数据的时间是不可预知的
- 因此,将帧间隔时间设置到一个小于数据包间隔时间的值(我设为30ms),并在update函数中判断当前数据包是不是新的,如果是则更新图像
- 这里给frames传了个生成器函数进去,不断检测数据包是否更新,并将结果返回给update函数
关键代码:
def update(frame):
    if (frame == 0):
        return line1
    del plty[0]
    plty.append((outputData[listPos - 1][3]))
    return line

def gen_function():
    global listPos
    lastPos = 0
    while (1):
        if (lastPos != listPos):
            lastPos = listPos
            yield 1
        else:
            yield 0

if (__name__ == "__main__"):
    pyplotInit()
    ani = animation.FuncAnimation(fig, update, frames=gen_function, interval=30, blit=True)
    plt.show()

 浙公网安备 33010602011771号