
使用Class类封装Echarts图表
新建echarts.js
import * as echarts from "echarts/core";
import { LineChart, BarChart, SunburstChart } from "echarts/charts";
import {
  TitleComponent,
  TooltipComponent,
  GridComponent,
  LegendComponent,
  DataZoomComponent,
} from "echarts/components";
import { CanvasRenderer } from "echarts/renderers";
echarts.use([
  TitleComponent,
  TooltipComponent,
  GridComponent,
  LegendComponent,
  BarChart,
  CanvasRenderer,
  LineChart,
  DataZoomComponent,
  SunburstChart,
]);
// 文档:https://echarts.apache.org/
export default class Chart {
  instance;
  data = null;
  xAxis = { type: "category", data: [] };
  yAxis = { type: "value" };
  title = { text: "", subtext: "" };
  tooltip = { trigger: "axis", axisPointer: { type: "shadow" } };
  dataZoom = { type: "inside" };
  onClick = null;
  grid = null;
  /**
   *
   * @param {string} target querySelector中选择器
   * @param {object} data echarts的设置
   */
  constructor(target, data) {
    this.instance = echarts.init(document.querySelector(target));
    data = data ? data : { series: [] };
    this.data = data.series;
    delete data.series;
    this.init(data);
    this.render(this.data, data);
  }
  getInstance() {
    return this.instance;
  }
  init(data) {
    ["title", "xAxis", "yAxis", "tooltip", "dataZoom", "grid"].forEach((item) => {
      if (data[item]) {
        let func = `set${item.toLocaleUpperCase()[0]}${item.slice(1)}`;
        this[func](data[item]);
        delete data[item];
      }
    });
  }
  /**
   * 设置标题
   * @param {object|string} title  标题或标题对象
   * @param {string} subtext 子标题
   */
  setTitle(title, subtext) {
    if (Object.prototype.toString.call(title) == "[object String]") {
      title = { text: title, subtext: "", left: "left" };
    }
    this.title = title;
    if (subtext) {
      this.title.subtext = subtext.toString();
    }
    return this;
  }
  /**
   * 设置X轴标题数据
   * @param {array|Object} data
   */
  setXAxis(data) {
    if (Object.prototype.toString.call(data) == "[object Array]") {
      this.xAxis.data = data;
    } else {
      this.xAxis = data;
    }
    return this;
  }
  /**
   * 设置Y轴标题数据
   * @param {object} data
   */
  setYAxis(data) {
    this.yAxis = data;
    return this;
  }
  /**
   * 设置网格尺寸
   * @param {object} data
   */
  setGrid(data) {
    this.grid = data;
    return this;
  }
  /**
   * 设置鼠标停留显示
   * @param {object} data
   */
  setTooltip(data) {
    this.tooltip = data;
  }
  /**
   * 设置放大缩小
   * @param {object} data
   */
  setDataZoom(data) {
    this.dataZoom = data;
  }
  /**
   *
   * @param {array} data echarts.series
   */
  render(data, option) {
    if (!option) {
      //option = { tooltip: this.tooltip, dataZoom: this.dataZoom };
      option = { tooltip: this.tooltip, grid: this.grid };
    }
    if (!option.legend) {
      option["legend"] = { data: [] };
      if (Object.prototype.toString.call(data) == "[object Array]") {
        data.forEach((item) => {
          if (item.name) {
            option.legend.data.push(item.name);
          }
        });
      }
    }
    this.instance.setOption({
      title: this.title,
      xAxis: this.xAxis,
      yAxis: this.yAxis,
      series: data,
      ...option,
    });
    if (this.onClick) {
      this.instance.on("click", "series", this.onClick);
    }
  }
}
页面中使用
<template>
    <div id="canvas" style="height: 250px"></div>
</template>

<script>
import Chart from '@/echarts'
export default {
    name: 'brokenLine',
    data() {
        return {
            chart: null,
            selectsYears: new Date().getFullYear().toString(),
            selectsquarter: this.quarters,
            brokenTabs: ['学费', '演出', '考级', '教材', '其他'],
        }
    },
    computed: {
        years() {
            let arr = []
            let now = new Date()
            let year = now.getFullYear()
            for (let i = 10; i < 50; i++) {
                let l = `20${i}`
                if (year >= l) {
                    arr.push(i)
                }
            }
            return arr
        },
    },
    mounted() {
        this.setQuarter()
        this.getData()
    },
    methods: {
        clickChart(event) {},
        handleYears(val) {
            this.selectsYears = val
            this.getData()
        },
        handleQuarter(val) {
            this.selectsquarter = val
            this.getData()
        },
        renderChart(data) {
            if (!this.chart) {
                this.chart = new Chart('#canvas')
                this.chart.onClick = this.clickChart
            }
            this.chart.render(this.tuitionHandler(data))
        },
        tuitionHandler(data) {
            let xAxis = {type: 'category', data: []}
            let result = this.brokenTabs.map(item => {
                return {data: [], type: 'line', name: item}
            })
            this.chart
                .setXAxis(xAxis)
                .setTitle('万元')
                .setGrid({
                    top: '50px',
                    right: '10px',
                    bottom: '30px',
                    left: '80px',
                })
                .setTooltip({
                    trigger: 'axis',
                    axisPointer: {
                        type: 'cross',
                        label: {
                            backgroundColor: '#6a7985',
                        },
                    },
                })
            data.forEach(e => {
                xAxis.data.push(e.year)
                result[0].data.push(e.examine)
                result[1].data.push(e.perform)
                result[2].data.push(e.tuition)
                result[3].data.push(Math.round(Math.random() * 100000 * 100) / 100)
                result[4].data.push(Math.round(Math.random() * 100000 * 100) / 100)
            })
            return result
        },
        getData() {
            let params = {
                year: this.selectsYears,
                quarter: this.selectsquarter,
            }
            this.$http.get(this.$api.getCostTrend, {params}).then(({data}) => {
                this.renderChart(data)
            })
        },
        setQuarter() {
            let month = new Date().getMonth() + 1
            let quarter = month <= 3 ? 1 : month <= 6 ? 2 : month <= 9 ? 3 : 4
            this.selectsquarter = quarter
        },
    },
}
</script>
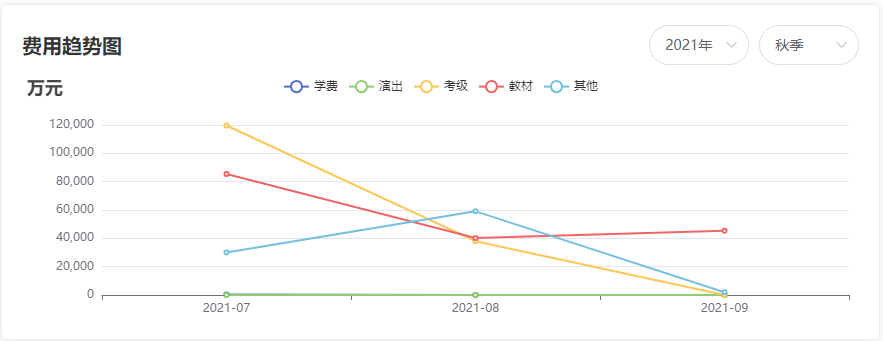
效果图

 浙公网安备 33010602011771号