1 # -*- coding: utf-8 -*-
2
3 # 代码8-1 查看数据特征
4
5 import numpy as np
6 import pandas as pd
7
8 inputfile = 'D://CourseAssignment//AI//GoodSellMod//GoodsOrder.csv' # 输入的数据文件
9 data = pd.read_csv(inputfile,encoding = 'gbk') # 读取数据
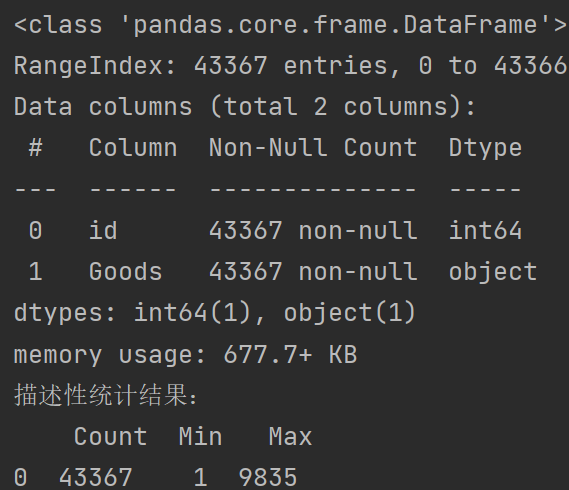
10 data .info() # 查看数据属性
11
12 data = data['id']
13 description = [data.count(),data.min(), data.max()] # 依次计算总数、最小值、最大值
14 description = pd.DataFrame(description, index = ['Count','Min', 'Max']).T # 将结果存入数据框
15 print('描述性统计结果:\n',np.round(description)) # 输出结果
![]()
1 # 销量排行前10商品的销量及其占比
2 import pandas as pd
3 inputfile = 'D://CourseAssignment//AI//GoodSellMod//GoodsOrder.csv' # 输入的数据文件
4 data = pd.read_csv(inputfile,encoding = 'gbk') # 读取数据
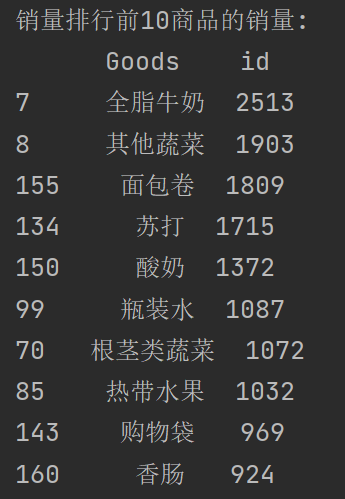
5 group = data.groupby(['Goods']).count().reset_index() # 对商品进行分类汇总
6 sorted=group.sort_values('id',ascending=False)
7 print('销量排行前10商品的销量:\n', sorted[:10]) # 排序并查看前10位热销商品
![]()
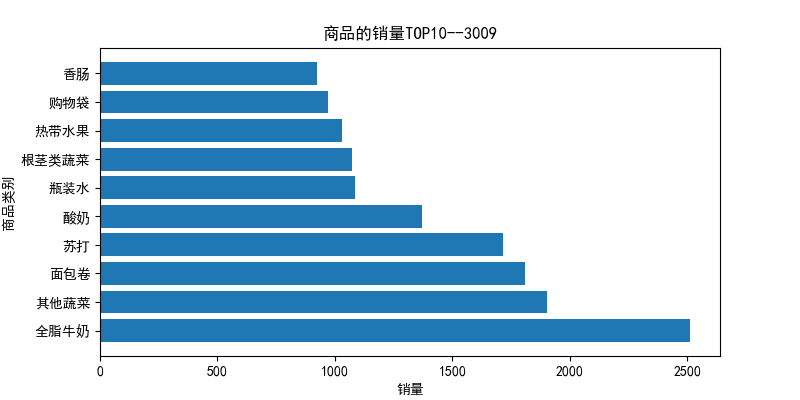
 1 # 画条形图展示出销量排行前10商品的销量
 2 import matplotlib.pyplot as plt
 3 x=sorted[:10]['Goods']
 4 y=sorted[:10]['id']
 5 plt.figure(figsize = (8, 4))  # 设置画布大小
 6 plt.barh(x,y)
 7 plt.rcParams['font.sans-serif'] = 'SimHei'
 8 plt.xlabel('销量')  # 设置x轴标题
 9 plt.ylabel('商品类别')  # 设置y轴标题
10 plt.title('商品的销量TOP10--3009')  # 设置标题
11 plt.savefig('D://CourseAssignment//AI//GoodSellMod//tmp//top10.png')  # 把图片以.png格式保存
12 plt.show()  # 展示图片
![]()
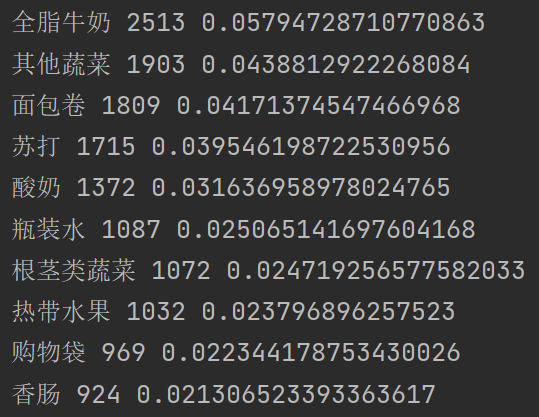
1 # 销量排行前10商品的销量占比
2 data_nums = data.shape[0]
3 for idnex, row in sorted[:10].iterrows():
4     print(row['Goods'],row['id'],row['id']/data_nums)
![]()
1 # 代码8-3 各类别商品的销量及其占比
2
3 import pandas as pd
4 inputfile1 = 'D://CourseAssignment//AI//GoodSellMod//GoodsOrder.csv'
5 inputfile2 = 'D://CourseAssignment//AI//GoodSellMod//GoodsTypes.csv'
6 data = pd.read_csv(inputfile1,encoding = 'gbk')
7 types = pd.read_csv(inputfile2,encoding = 'gbk') # 读入数据
8
9 group = data.groupby(['Goods']).count().reset_index()
10 sort = group.sort_values('id',ascending = False).reset_index()
11 data_nums = data.shape[0] # 总量
12 del sort['index']
13
14 sort_links = pd.merge(sort,types) # 合并两个datafreame 根据type
15 # 根据类别求和,每个商品类别的总量,并排序
16 sort_link = sort_links.groupby(['Types']).sum().reset_index()
17 sort_link = sort_link.sort_values('id',ascending = False).reset_index()
18 del sort_link['index'] # 删除“index”列
19
20 # 求百分比,然后更换列名,最后输出到文件
21 sort_link['count'] = sort_link.apply(lambda line: line['id']/data_nums,axis=1)
22 sort_link.rename(columns = {'count':'percent'},inplace = True)
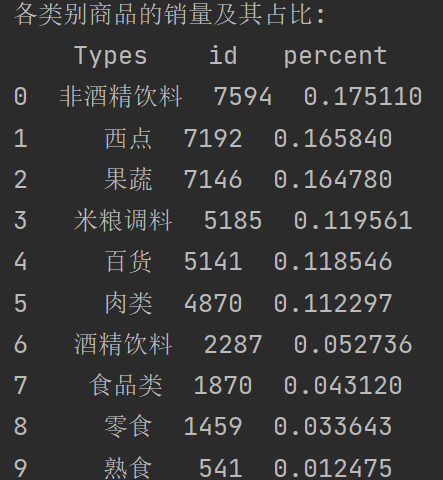
23 print('各类别商品的销量及其占比:\n',sort_link)
24 outfile1 = 'D://CourseAssignment//AI//GoodSellMod//tmp//percent.csv'
25 sort_link.to_csv(outfile1,index = False,header = True,encoding='gbk') # 保存结果
![]()
1 # 画饼图展示每类商品销量占比
2 import matplotlib.pyplot as plt
3 data = sort_link['percent']
4 labels = sort_link['Types']
5 plt.figure(figsize=(8, 6)) # 设置画布大小
6 plt.pie(data,labels=labels,autopct='%1.2f%%')
7 plt.rcParams['font.sans-serif'] = 'SimHei'
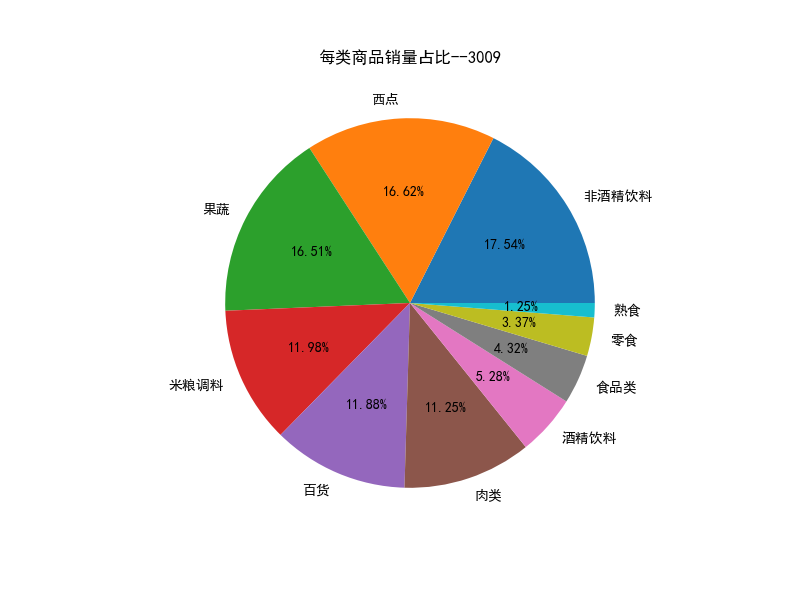
8 plt.title('每类商品销量占比--3009') # 设置标题
9 plt.savefig('D://CourseAssignment//AI//GoodSellMod//tmp//persent.png') # 把图片以.png格式保存
10 plt.show()
![]()
1 # 代码8-4 非酒精饮料内部商品的销量及其占比
2
3 # 先筛选“非酒精饮料”类型的商品,然后求百分比,然后输出结果到文件。
4 selected = sort_links.loc[sort_links['Types'] == '非酒精饮料'] # 挑选商品类别为“非酒精饮料”并排序
5 child_nums = selected['id'].sum() # 对所有的“非酒精饮料”求和
6 selected['child_percent'] = selected.apply(lambda line: line['id']/child_nums,axis = 1) # 求百分比
7 selected.rename(columns = {'id':'count'},inplace = True)
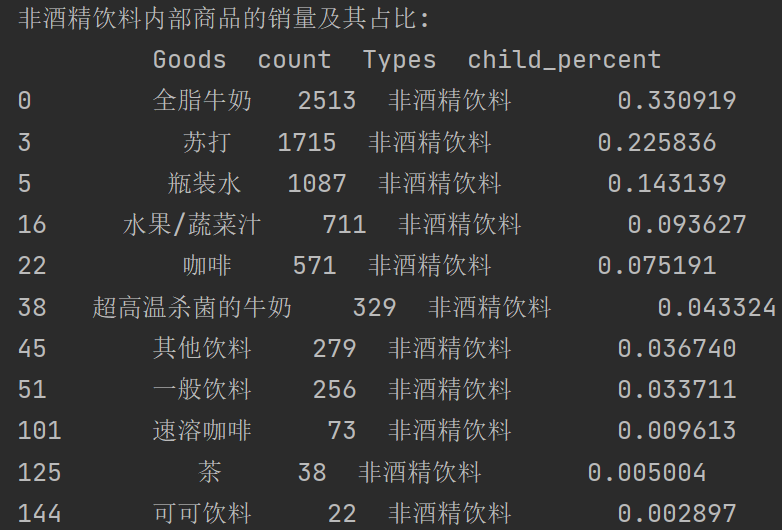
8 print('非酒精饮料内部商品的销量及其占比:\n',selected)
9 outfile2 = 'D://CourseAssignment//AI//GoodSellMod//tmp//child_percent.csv'
10 sort_link.to_csv(outfile2,index = False,header = True,encoding='gbk') # 输出结果
![]()
1 # 画饼图展示非酒精饮品内部各商品的销量占比
2 import matplotlib.pyplot as plt
3 data = selected['child_percent']
4 labels = selected['Goods']
5 plt.figure(figsize = (8,6)) # 设置画布大小
6 explode = (0.02,0.03,0.04,0.05,0.06,0.07,0.08,0.08,0.3,0.1,0.3) # 设置每一块分割出的间隙大小
7 plt.pie(data,explode = explode,labels = labels,autopct = '%1.2f%%',
8 pctdistance = 1.1,labeldistance = 1.2)
9 plt.rcParams['font.sans-serif'] = 'SimHei'
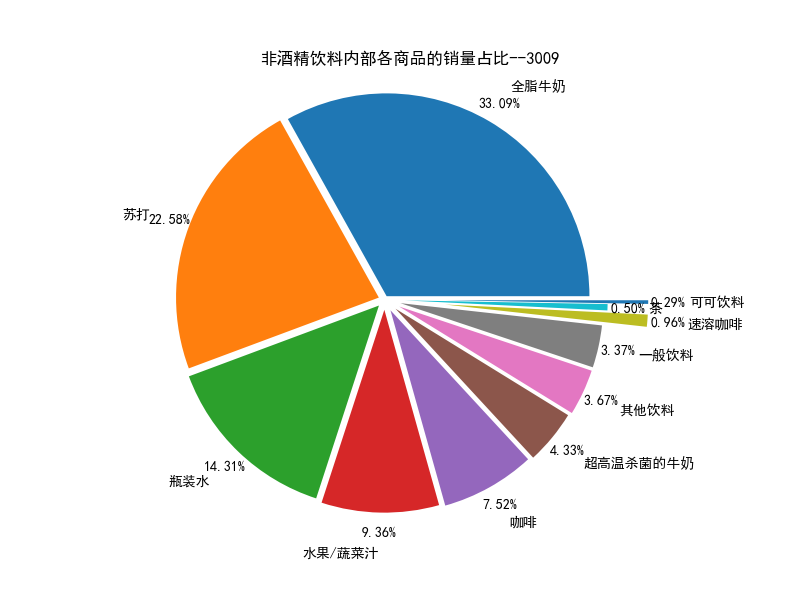
10 plt.title("非酒精饮料内部各商品的销量占比--3009") # 设置标题
11 plt.axis('equal')
12 plt.savefig('D://CourseAssignment//AI//GoodSellMod//tmp//child_persent.png') # 保存图形
13 plt.show() # 展示图形
![]()
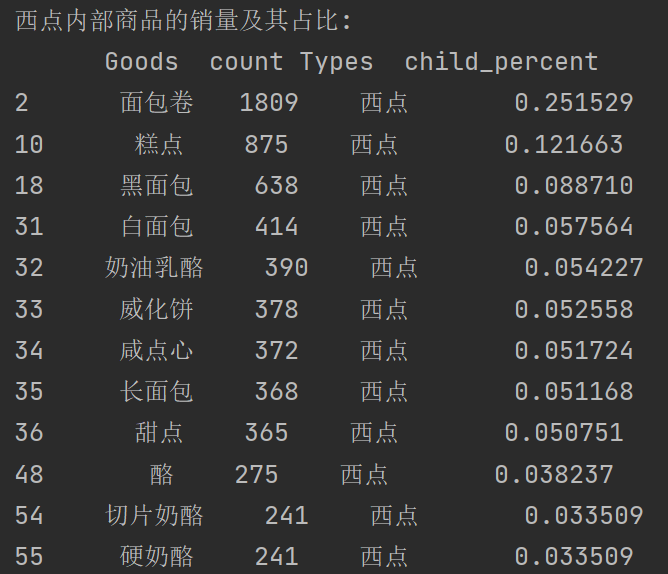
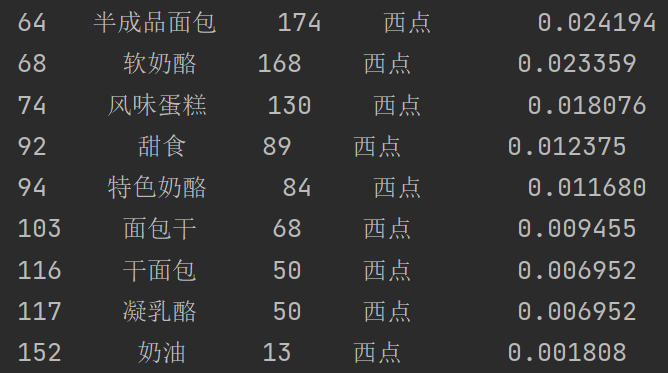
1 # 先筛选“西点”类型的商品,然后求百分比,然后输出结果到文件。
2 selected = sort_links.loc[sort_links['Types'] == '西点']  # 挑选商品类别为“非酒精饮料”并排序
3 child_nums = selected['id'].sum()  # 对所有的“非酒精饮料”求和
4 selected['child_percent'] = selected.apply(lambda line: line['id']/child_nums,axis = 1)  # 求百分比
5 selected.rename(columns = {'id':'count'},inplace = True)
6 print('西点内部商品的销量及其占比:\n',selected)
7 outfile3 = 'D://CourseAssignment//AI//GoodSellMod//tmp//bread_precent.csv'
8 sort_link.to_csv(outfile3,index = False,header = True,encoding='gbk')  # 输出结果
![]()
![]()
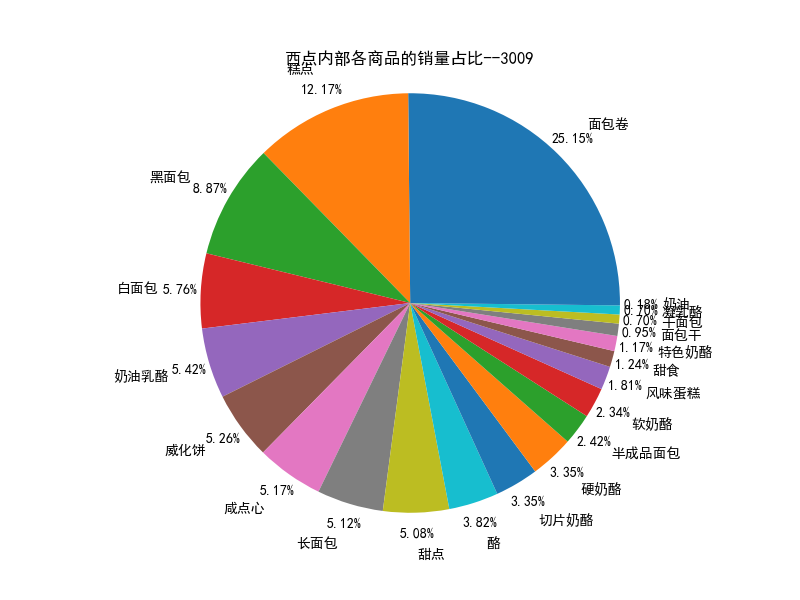
 1 # 画饼图展示西点内部各商品的销量占比
 2 import matplotlib.pyplot as plt
 3 data = selected['child_percent']
 4 labels = selected['Goods']
 5 plt.figure(figsize = (8,6))  # 设置画布大小
 6 explode = (0.02,0.03,0.04,0.05,0.06,0.07,0.08,0.08,0.3,0.1,0.3)  # 设置每一块分割出的间隙大小
 7 plt.pie(data,explode = None,labels = labels,autopct = '%1.2f%%',
 8         pctdistance = 1.1,labeldistance = 1.2)
 9 plt.rcParams['font.sans-serif'] = 'SimHei'
10 plt.title("西点内部各商品的销量占比--3009")  # 设置标题
11 plt.axis('equal')
12 plt.savefig('D://CourseAssignment//AI//GoodSellMod//tmp//bread_precent.png')  # 保存图形
13 plt.show()  # 展示图形
![]()
1 # -*- coding: utf-8 -*-
2 import pandas as pd
3 inputfile='D://CourseAssignment//AI//GoodSellMod//GoodsOrder.csv'
4 data = pd.read_csv(inputfile,encoding = 'gbk')
5
6 # 根据id对“Goods”列合并,并使用“,”将各商品隔开
7 data['Goods'] = data['Goods'].apply(lambda x:','+x)
8 data = data.groupby('id').sum().reset_index()
9
10 # 对合并的商品列转换数据格式
11 data['Goods'] = data['Goods'].apply(lambda x :[x[1:]])
12 data_list = list(data['Goods'])
13
14 # 分割商品名为每个元素
15 data_translation = []
16 for i in data_list:
17 p = i[0].split(',')
18 data_translation.append(p)
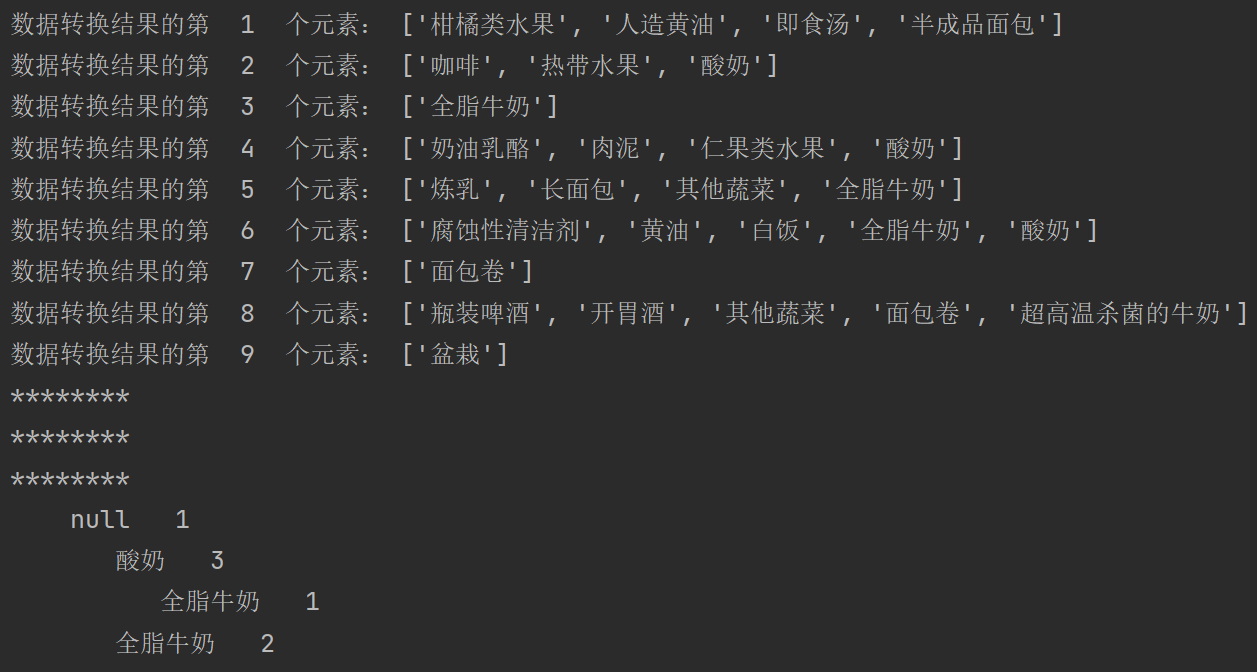
19 for i in range(9):
20 print('数据转换结果的第 ',i+1,' 个元素:', data_translation[i])
21 #print('数据转换结果的前9个元素:\n', data_translation[0:8])
22
23
24 #########################################################
25
26
27 def loadSimpleData():
28 for i in range(3):
29 print("********")
30 '''
31 simpleData = [['beer', 'milk', 'chicken'],
32 ['milk', 'bread'],
33 ['milk', 'diaper'],
34 ['beer', 'milk', 'bread'],
35 ['beer', 'diaper'],
36 ['milk', 'diaper'],
37 ['beer', 'diaper'],
38 ['beer', 'milk', 'diaper', 'chicken'],
39 ['beer', 'milk', 'diaper']]
40 return simpleData
41 '''
42 simpleData = [data_translation[0],
43 data_translation[1],
44 data_translation[2],
45 data_translation[3],
46 data_translation[4],
47 data_translation[5],
48 data_translation[6],
49 data_translation[7],
50 data_translation[8]]
51 return simpleData
52
53
54
55 def createInitSet(dataSet: list) -> dict:
56 returnSet = {}
57
58 for item in dataSet:
59 frozenItem = frozenset(item)
60 returnSet[frozenItem] = returnSet.get(frozenItem, 0) + 1
61
62 return returnSet
63
64
65 class TreeNode(object):
66 def __init__(self, nameValue: str, numOccur: int, parentNode):
67 # 项的名字
68 self.name = nameValue
69 # 项在FPTree当中出现的次数
70 self.count = numOccur
71 # 相同项的下一个节点
72 self.nodeLink = None
73 # 父节点
74 self.parentNode = parentNode
75 # 子节点
76 # for example, the children like 'milk': TreeNode('milk')
77 self.children = {}
78
79 def inc(self, count):
80 self.count += count
81
82 def show(self, ind=1):
83 print(' ' * ind, self.name, ' ', self.count)
84 for child in self.children.values():
85 child.show(ind + 1)
86
87
88 def getHeaderTable(dataSet, minSupport=1) -> dict:
89 headerTable = {}
90
91 for key, value in dataSet.items():
92 for item in key:
93 headerTable[item] = headerTable.get(item, 0) + value
94
95 lessThanMinSupportList = list(filter(lambda k: headerTable[k] < minSupport, headerTable))
96 for x in lessThanMinSupportList:
97 del headerTable[x]
98
99 return headerTable
100
101
102 def makeHeaderTable(headerTable: dict) -> dict:
103 for item in headerTable:
104 headerTable[item] = [headerTable[item], None]
105
106 return headerTable
107
108
109 def updateHeaderTable(toastNode: TreeNode, targetNode: TreeNode):
110 while toastNode.nodeLink is not None:
111 toastNode = toastNode.nodeLink
112 toastNode.nodeLink = targetNode
113
114
115 class FPTree:
116 def __init__(self, frozenDataDict: dict, headerTable: dict, minSupport: int):
117 self.treeNode = TreeNode('null', 1, None)
118 # 'milk': [counter, nodeLink]
119 self.headerTable = makeHeaderTable(headerTable)
120 self.frozenDataDict = frozenDataDict
121 self.minSupport = minSupport
122
123 def updateTree(self, treeNode, items: list, count: int):
124 item = items[0]
125 if item in treeNode.children:
126 treeNode.children[item].inc(count)
127 else:
128 treeNode.children[item] = TreeNode(item, count, treeNode)
129 if self.headerTable[item][1] is None:
130 self.headerTable[item][1] = treeNode.children[item]
131 else:
132 updateHeaderTable(self.headerTable[item][1], treeNode.children[item])
133 if len(items) > 1:
134 self.updateTree(treeNode.children[item], items[1::], count)
135
136 def createFPTree(self):
137 freqItems = set(self.headerTable.keys())
138
139 if len(freqItems) == 0:
140 self.headerTable = None
141 return
142
143 for transaction, count in self.frozenDataDict.items():
144 learnSet = {}
145 for item in transaction:
146 if item in freqItems:
147 learnSet[item] = self.headerTable[item][0]
148
149 if len(learnSet) > 0:
150 orderedItems = [item[0] for item in sorted(learnSet.items(), key=lambda k: (k[1], k[0]), reverse=True)]
151 self.updateTree(self.treeNode, orderedItems, count)
152
153
154 def main():
155 data = loadSimpleData()
156 dataDict = createInitSet(data)
157 headerTable = getHeaderTable(dataDict, 3)
158 fpTree = FPTree(dataDict, headerTable, 3)
159 fpTree.createFPTree()
160 fpTree.treeNode.show()
161
162 main()
![]()


 浙公网安备 33010602011771号