
pandas vs excel
01.创建文件

import pandas as pd

df = pd.DataFrame({'ID':[1,2,3],'Name':['Tim','','Nick']}) #创建DataFrame

df
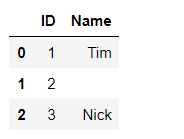
df = df.set_index('ID')

df
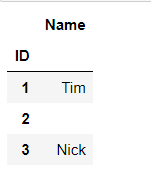
df.to_excel(r"C:\Users\Administrator\Desktop\output.xlsx") #写入到Excel
02.读取文件

import pandas as pd

people = pd.read_excel(r"C:\Users\Administrator\Desktop\people.xlsx") #读取Excel文件

print(people.shape) #输出行列数
print(people.columns) #输出列名
print(people.head()) #输出头5行
print(people.tail(3)) #查看数据的最后3行

people = pd.read_excel(r"C:\Users\Administrator\Desktop\people.xlsx", header=1) #读取Excel文件,默认以第二行为列名

people = pd.read_excel(r"C:\Users\Administrator\Desktop\people.xlsx", header=None) #读取Excel文件,默认没有列名
#将会自动用1,2,3....来代替列名

people.columns = ['ID','Type','FirstName','MiddleName','LastName'] #设置列名

people = people.set_index('ID')
people.set_index('ID',inplace=True) #直接在原来的DataFrame上进行修改,不会生成新的dataframe

people

people.to_excel(r"C:\Users\Administrator\Desktop\output.xlsx")

df = pd.read_excel(r"C:\Users\Administrator\Desktop\output.xlsx",index_col='ID') #指明读取文件的时候 index 为 ID 列
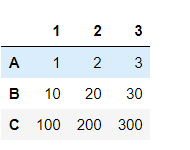
03.行、列、单元格

import pandas as pd

s1 = pd.Series()
s1.index
'''
Index([], dtype='object')
'''

d = {'x':100,'y':200,'z':300}

print(d.keys())
print(d.values())
print(d['x'])
'''
dict_keys(['x', 'y', 'z'])
dict_values([100, 200, 300])
100
'''

s1 = pd.Series(d)

print(s1.index)
print(s1.data)
s1
'''
Index(['x', 'y', 'z'], dtype='object')
<memory at 0x00000187AE02D648>

x    100
y    200
z    300
dtype: int64
'''

L1 = [100,200,300]
L2 = ['x','y','z']

s1 = pd.Series(L1,index=L2)
s1.index
'''
Index(['x', 'y', 'z'], dtype='object')
'''

s1 = pd.Series([100,200,300],index=['x','y','z'])
s1.index
'''
Index(['x', 'y', 'z'], dtype='object')
'''

s1 = pd.Series([1,2,3],index=[1,2,3],name='A')
s2 = pd.Series([10,20,30],index=[1,2,3],name='B')
s3 = pd.Series([100,200,300],index=[1,2,3],name='C')

df = pd.DataFrame({s1.name:s1,s2.name:s2,s3.name:s3})
df

s1 = pd.Series([1,2,3],index=[1,2,3],name='A')
s2 = pd.Series([10,20,30],index=[1,2,3],name='B')
s3 = pd.Series([100,200,300],index=[1,2,3],name='C')

df = pd.DataFrame([s1,s2,s3])
df
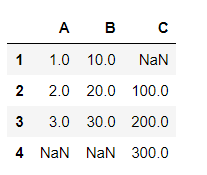
s1 = pd.Series([1,2,3],index=[1,2,3],name='A')
s2 = pd.Series([10,20,30],index=[1,2,3],name='B')
s3 = pd.Series([100,200,300],index=[2,3,4],name='C')

df = pd.DataFrame({s1.name:s1,s2.name:s2,s3.name:s3})
df
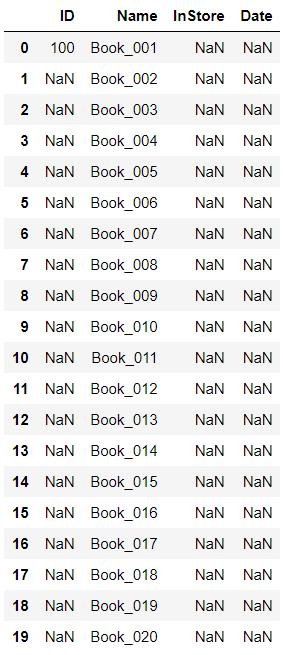
04.数字区域读取、填充数字、填充日期

import pandas as pd
from datetime import date,timedelta

datafile = r"C:\Users\67001\Desktop\Books.xlsx"

books = pd.read_excel(datafile,skiprows=3,usecols="C:F",index_col=None,dtype={'ID':str,'InStore':str,'Date':str}) #选择从第四行开始读,读C:F列
print(books['ID'])
print(type(books['ID']))
'''
0     NaN
1     NaN
2     NaN
3     NaN
4     NaN
5     NaN
6     NaN
7     NaN
8     NaN
9     NaN
10    NaN
11    NaN
12    NaN
13    NaN
14    NaN
15    NaN
16    NaN
17    NaN
18    NaN
19    NaN
Name: ID, dtype: object
<class 'pandas.core.series.Series'>
'''

books['ID'].at[0] = 100
books
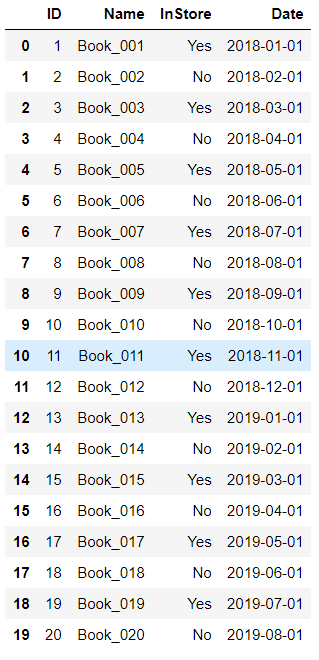
def add_month(d,md):
    yd = md // 12
    m = d.month + md % 12
    if m != 12:
        yd += m // 12
        m = m % 12
    return date(d.year + yd,m,d.day)

在Series上进行修改
start = date(2018,1,1)

for i in books.index:
    books['ID'].at[i] = i + 1
    books['InStore'].at[i] = 'Yes' if i % 2 == 0 else 'No'
#     books['Date'].at[i] = start + timedelta(days=i) # 日期加一天
#     books['Date'].at[i] = date(start.year + i,start.month,start.day) #日期加一年
    books['Date'].at[i] = add_month(start, i)

books
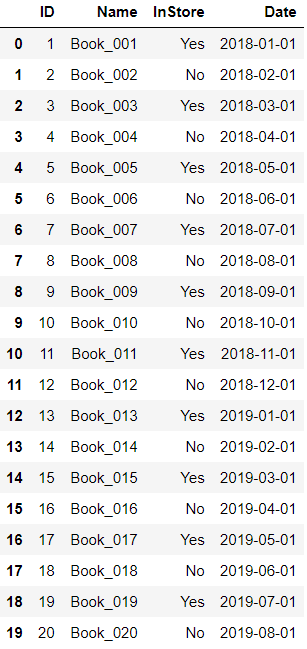
在DataFrame上进行修改
start = date(2018,1,1)

for i in books.index:
    books.at[i,'ID'] = i + 1
    books.at[i,'InStore'] = 'Yes' if i % 2 == 0 else 'No'
    books.at[i,'Date'] = add_month(start, i)

books
books.set_index('ID',inplace=True)
books.to_excel(r"C:\Users\67001\Desktop\Books1.xlsx")
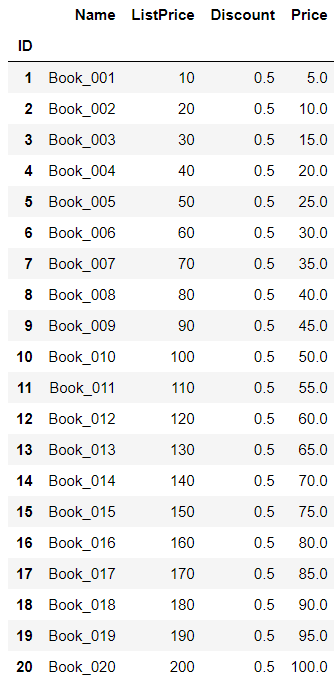
05.函数填充,计算列

import pandas as pd

books = pd.read_excel(r"C:\Users\67001\Desktop\Books.xlsx",index_col='ID')
books['Price'] = books['ListPrice']*books['Discount']
books
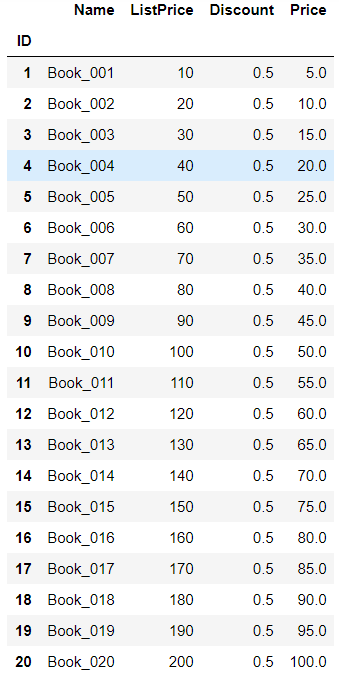
for i in books.index:
    books['Price'].at[i] = books['ListPrice'].at[i]*books['Discount'].at[i]
books
def add_2(x):
    return x + 2

books['ListPrice'] = books['ListPrice'].apply(add_2)

books
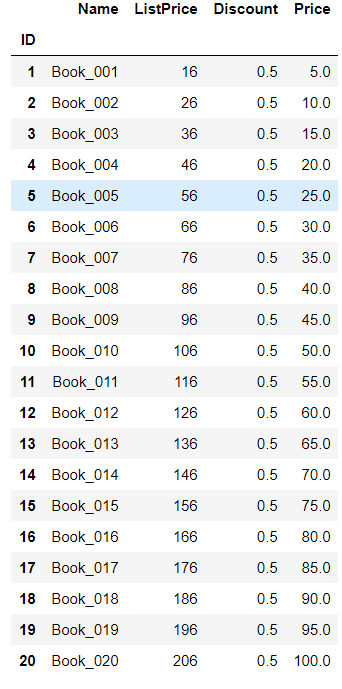
books['ListPrice'] = books['ListPrice'].apply(lambda x:x + 2)
books

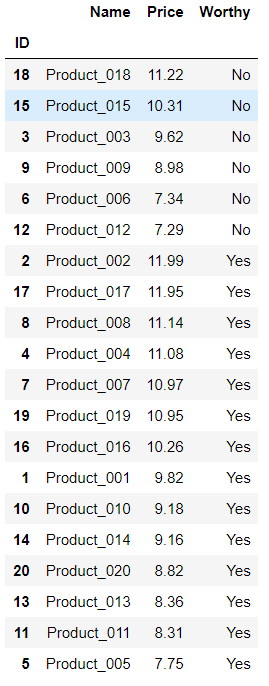
06.排序、多重排序

import pandas as pd

products = pd.read_excel(r"C:\Users\67001\Desktop\List.xlsx",index_col='ID')

products.sort_values(by='Price',inplace=True,ascending=False) #降序
products

products.sort_values(by=['Worthy','Price'],inplace=True,ascending=[True,False]) #降序
products
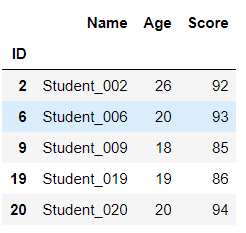
07.数据筛选、过滤

import pandas as pd

students = pd.read_excel(r"C:\Users\67001\Desktop\Students.xlsx",index_col='ID')
students

# 筛选年龄大于等于18小于30
def age_18_to_30(a):
    return 18 <= a < 30

# 筛选成绩大于等于85小于等于100
def level_a(s):
    return 85 <= s <= 100

# students = students.loc[students['Age'].apply(age_18_to_30)].loc[students['Score'].apply(level_a)]
# 或
# students = students.loc[students.Age.apply(age_18_to_30)].loc[students.Score.apply(level_a)]
# 或
students = students.loc[students.Age.apply(lambda a : 18 <= a < 30)].loc[students.Score.apply(lambda s : 85 <= s <= 100)]

students
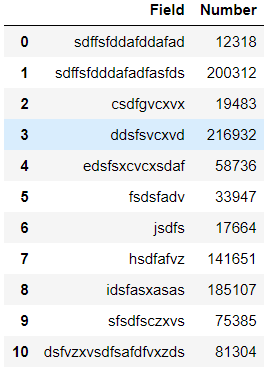
08.柱状图

import pandas as pd
import matplotlib.pyplot as plt

students = pd.read_excel(r"C:\Users\67001\Desktop\student.xlsx")
students
students.plot.bar(x='Field',y='Number')
plt.show()

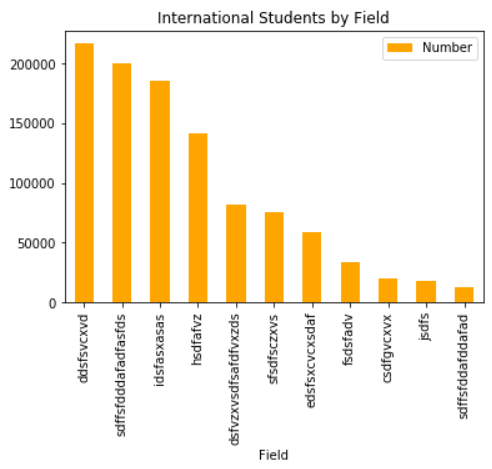
students.sort_values(by='Number',inplace=True,ascending=False)

students.plot.bar(x='Field',y='Number',color='orange',title='International Students by Field')
# plt.tight_layout()
plt.show()
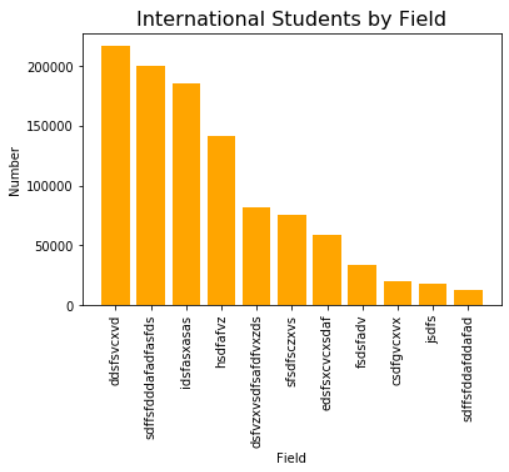
plt.bar(students.Field,students.Number,color='orange')
plt.xticks(students.Field,rotation='90')
plt.xlabel('Field')
plt.ylabel('Number')
plt.title('International Students by Field',fontsize=16)
#plt.tight_layout()
plt.show()
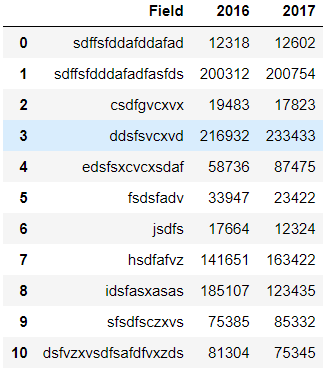
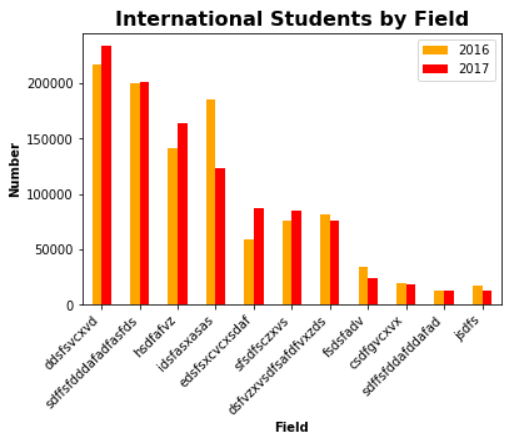
09.分组柱图、深度优化

import pandas as pd
import matplotlib.pyplot as plt

students = pd.read_excel(r"C:\Users\67001\Desktop\student1.xlsx")
students
students.sort_values(by='2017',inplace=True,ascending=False) #排序

students.plot.bar(x='Field',y=['2016','2017'],color=['orange','red'])
plt.title('International Students by Field',fontsize=16,fontweight='bold')
plt.xlabel('Field',fontweight='bold')
plt.ylabel('Number',fontweight='bold')
plt.show()

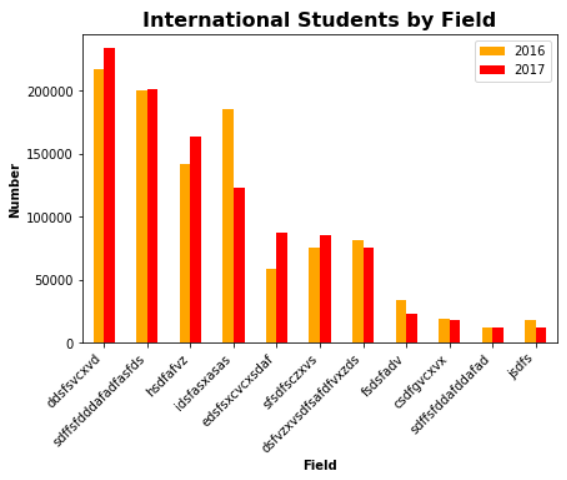
students.plot.bar(x='Field',y=['2016','2017'],color=['orange','red'])
plt.title('International Students by Field',fontsize=16,fontweight='bold')
plt.xlabel('Field',fontweight='bold')
plt.ylabel('Number',fontweight='bold')
ax = plt.gca() # 拿到 x 轴
ax.set_xticklabels(students['Field'],rotation=45,ha='right') #将 Field 按照最右端旋转 45°
plt.show()
students.plot.bar(x='Field',y=['2016','2017'],color=['orange','red'])
plt.title('International Students by Field',fontsize=16,fontweight='bold')
plt.xlabel('Field',fontweight='bold')
plt.ylabel('Number',fontweight='bold')
ax = plt.gca() # 拿到 x 轴
f = plt.gcf() #拿到图像
f.subplots_adjust(left=0.02,bottom=0.02) #调整图像比例
ax.set_xticklabels(students['Field'],rotation=45,ha='right') #将 Field 按照最右端旋转 45°
plt.show()
10.叠加柱状图、水平柱状图
11.饼图
12.折线趋势图、叠加区域图
13.散点图、直方图
14.密度图、数据相关性
15.多表联合(从VLOOKUP到JOIN)

import pandas as pd

students = pd.read_excel(r"C:\Users\67001\Desktop\Student_Score.xlsx",sheet_name='Student')
scores = pd.read_excel(r"C:\Users\67001\Desktop\Student_Score.xlsx",sheet_name='Score')

# students
# scores
# students = pd.read_excel(r"C:\Users\67001\Desktop\Student_Score.xlsx",sheet_name='Student',index_col='ID')
# scores = pd.read_excel(r"C:\Users\67001\Desktop\Student_Score.xlsx",sheet_name='Score',index_col='ID')

table = students.merge(scores,how='left',on='ID').fillna(0)
table.Score = table.Score.astype(int)
table
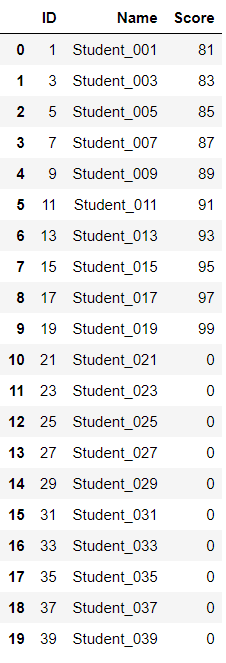
table = students.merge(scores,how='left',left_on=students.ID,right_on=scores.ID).fillna(0)
table.Score = table.Score.astype(int)
table
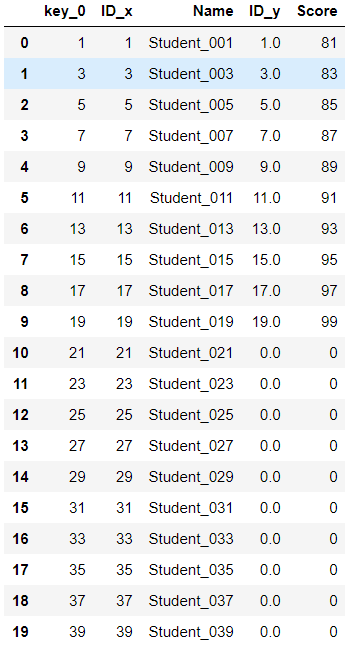
table.to_excel(r"C:\Users\67001\Desktop\StudentScore.xlsx")
16.数据校验、轴的概念

import pandas as pd

students = pd.read_excel(r"C:\Users\67001\Desktop\Students.xlsx")
students
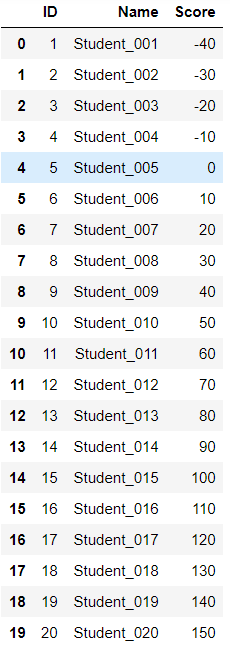
数据校验方式一

def score_validation1(row):
    try:
        assert 0<=row.Score<=100
    except:
        print(f'#{row.ID}\t student {row.Name} has an invalid score {row.Score}.')

students.apply(score_validation1,axis=1)
'''
#1     student Student_001 has an invalid score -40.
#2     student Student_002 has an invalid score -30.
#3     student Student_003 has an invalid score -20.
#4     student Student_004 has an invalid score -10.
#16     student Student_016 has an invalid score 110.
#17     student Student_017 has an invalid score 120.
#18     student Student_018 has an invalid score 130.
#19     student Student_019 has an invalid score 140.
#20     student Student_020 has an invalid score 150.
0     None
1     None
2     None
3     None
4     None
5     None
6     None
7     None
8     None
9     None
10    None
11    None
12    None
13    None
14    None
15    None
16    None
17    None
18    None
19    None
dtype: object
'''
17.把一列数据分割成两列

import pandas as pd

employees = pd.read_excel(r"C:\Users\67001\Desktop\Employees.xlsx",index_col='ID')
employees
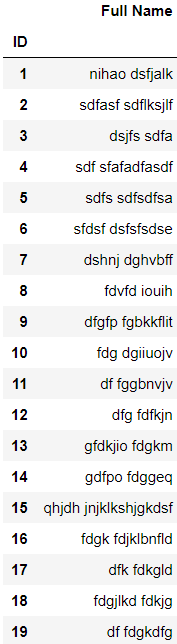
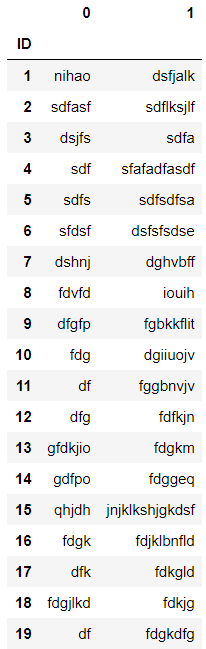
df = employees['Full Name'].str.split()
df
'''
ID
1            [nihao, dsfjalk]
2         [sdfasf, sdflksjlf]
3               [dsjfs, sdfa]
4          [sdf, sfafadfasdf]
5            [sdfs, sdfsdfsa]
6          [sfdsf, dsfsfsdse]
7            [dshnj, dghvbff]
8              [fdvfd, iouih]
9          [dfgfp, fgbkkflit]
10            [fdg, dgiiuojv]
11             [df, fggbnvjv]
12              [dfg, fdfkjn]
13           [gfdkjio, fdgkm]
14            [gdfpo, fdggeq]
15    [qhjdh, jnjklkshjgkdsf]
16         [fdgk, fdjklbnfld]
17              [dfk, fdkgld]
18           [fdgjlkd, fdkjg]
19              [df, fdgkdfg]
Name: Full Name, dtype: object
'''

df = employees['Full Name'].str.split(' ',n=2,expand=True) # ' ' 表示分隔符,n 表示保留分割后的数量,expand 表示是否分列
df
employees['First Name'] = df[0]
employees['Last Name'] = df[1]
employees

employees['Last Name'] = df[1].str.upper() #变大写
employees

https://pandas.pydata.org/pandas-docs/version/0.23/api.html#string-handling 学习路径
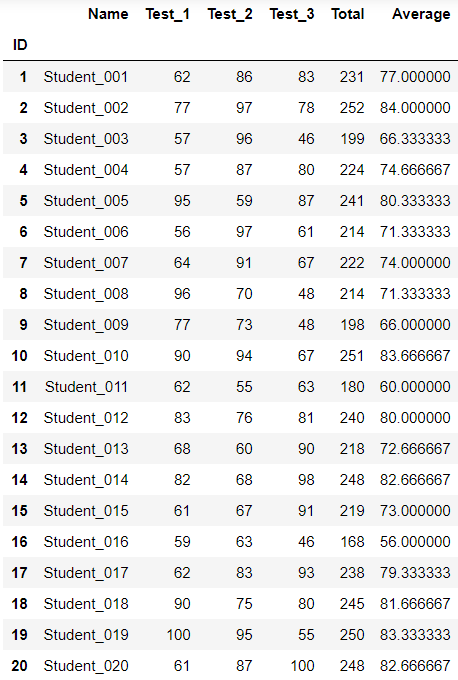
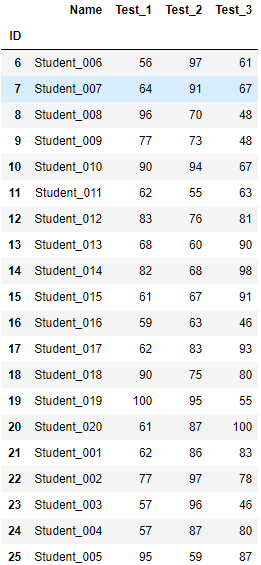
18.求和、求平均、统计引导

import pandas as pd

students = pd.read_excel(r"C:\Users\67001\Desktop\Students.xlsx",index_col='ID')
students

temp = students[['Test_1','Test_2','Test_3']]
result = temp.sum()
print(result)
print('-----------------')
print(type(result)) # series 是一列数据
'''
Test_1    1459
Test_2    1579
Test_3    1462
dtype: int64
-----------------
<class 'pandas.core.series.Series'>
'''

row_sum = temp.sum(axis=1)
row_mean = temp.mean(axis=1)

row_sum
row_mean
'''
ID
1     77.000000
2     84.000000
3     66.333333
4     74.666667
5     80.333333
6     71.333333
7     74.000000
8     71.333333
9     66.000000
10    83.666667
11    60.000000
12    80.000000
13    72.666667
14    82.666667
15    73.000000
16    56.000000
17    79.333333
18    81.666667
19    83.333333
20    82.666667
dtype: float64
'''

students['Total'] = row_sum
students['Average'] = row_mean
students
col_mean = students[['Test_1','Test_2','Test_3','Total','Average']].mean()
col_mean['Name'] = 'Summary'
col_mean
'''
Test_1       72.95
Test_2       78.95
Test_3        73.1
Total          225
Average         75
Name       Summary
dtype: object
'''

students = students.append(col_mean,ignore_index=True)
students

19.定位、消除重复数据

import pandas as pd

students = pd.read_excel(r"C:\Users\67001\Desktop\Students_Duplicates.xlsx",index_col='ID')
students

students1 = students.drop_duplicates(subset='Name',inplace=False,keep='last') #删除重复数据留下最后一行
students1
dupe=students.duplicated(subset='Name')
print(dupe.any())
print('=========================')
print(dupe)
print('=========================')
print(type(dupe))
print('=========================')
dupe1 = dupe[dupe == True]
print(dupe1)
print(dupe1.index)
print('=========================')
print(students.loc[dupe1.index])
'''
True
=========================
ID
1     False
2     False
3     False
4     False
5     False
6     False
7     False
8     False
9     False
10    False
11    False
12    False
13    False
14    False
15    False
16    False
17    False
18    False
19    False
20    False
21     True
22     True
23     True
24     True
25     True
dtype: bool
=========================
<class 'pandas.core.series.Series'>
=========================
ID
21    True
22    True
23    True
24    True
25    True
dtype: bool
Int64Index([21, 22, 23, 24, 25], dtype='int64', name='ID')
=========================
           Name  Test_1  Test_2  Test_3
ID
21  Student_001      62      86      83
22  Student_002      77      97      78
23  Student_003      57      96      46
24  Student_004      57      87      80
25  Student_005      95      59      87
'''

students

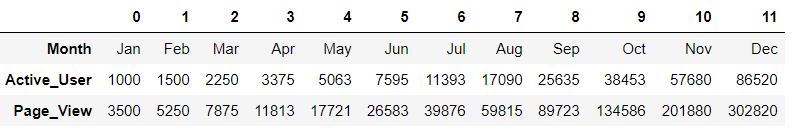
20.旋转数据表(行-列)

import pandas as pd

videos = pd.read_excel(r"C:\Users\67001\Desktop\Videos.xlsx")
videos

table = videos.transpose()
pd.options.display.max_columns=99
table
videos = pd.read_excel(r"C:\Users\67001\Desktop\Videos.xlsx",index_col='Month')
videos
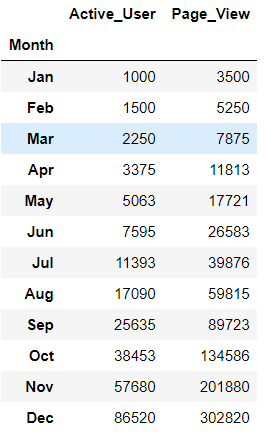
table = videos.transpose()
table

21.读取CSV、TSV、TXT文件中的数据

import pandas as pd

student1 = pd.read_csv(r"C:\Users\67001\Desktop\Students.csv") #读取 CSV 文件
student2 = pd.read_csv(r"C:\Users\67001\Desktop\Students.tsv",sep='\t') #读取 tsv 文件
student3 = pd.read_csv(r"C:\Users\67001\Desktop\Students.txt",sep='|') #读取 txt 文件
22.透视表、分组、聚合(group by)

import pandas as pd
import numpy as np

orders = pd.read_excel(r"C:\Users\67001\Desktop\Orders.xlsx")
orders.head()
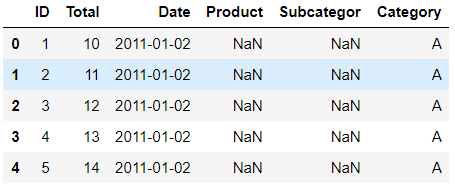
print(orders.Date.dtype)
'''
datetime64[ns]
'''

orders['Year'] = pd.DatetimeIndex(orders['Date']).year
orders.head()

pt1 = orders.pivot_table(index='Category',columns='Year',values='Total',aggfunc=np.sum)
pt1

groups = orders.groupby(['Category','Year'])
s = groups['Total'].sum()
c = groups['ID'].count()

pt2 = pd.DataFrame({'sum':s,'count':c})
pt2

pt2.to_excel(r"C:\Users\67001\Desktop\部战队.xlsx",index=False)
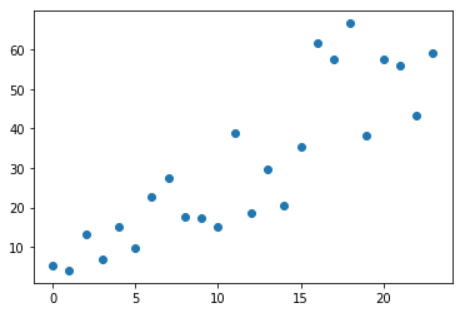
23.线性回归、数据预测

import pandas as pd
import matplotlib.pyplot as plt
from scipy.stats import linregress

sales = pd.read_excel(r"C:\Users\67001\Desktop\Sales.xlsx",dtype={'Month':str})
print(sales)
'''
      Month  Revenue
0   2017.01    5.220
1   2017.02    4.076
2   2017.03   13.240
3   2017.04    6.929
4   2017.05   15.120
5   2017.06    9.609
6   2017.07   22.746
7   2017.08   27.489
8   2017.09   17.520
9   2017.10   17.220
10  2017.11   15.156
11  2017.12   39.026
12  2018.01   18.739
13  2018.02   29.785
14  2018.03   20.607
15  2018.04   35.445
16  2018.05   61.789
17  2018.06   57.702
18  2018.07   66.667
19  2018.08   38.202
20  2018.09   57.602
21  2018.10   56.047
22  2018.11   43.446
23  2018.12   59.057
'''

plt.bar(sales.index,sales.Revenue)
plt.title("Sales")
plt.xticks(sales.index,sales.Month,rotation=90)
plt.show()

slope,intercept,r,p,std_err = linregress(sales.index,sales.Revenue)

exp = sales.index*slope + intercept

plt.scatter(sales.index,sales.Revenue)
plt.plot(sales.index,exp,color='orange')
# plt.title("Sales")
plt.title(f"y={slope}*x + {intercept}")
plt.xticks(sales.index,sales.Month,rotation=90)
plt.show()
---------------------------------------------------------------------------
IndexError                                Traceback (most recent call last)
<ipython-input-4-1c1b92ea7b45> in <module>
      4
      5 plt.scatter(sales.index,sales.Revenue)
----> 6 plt.plot(sales.index,exp,color='orange')
      7 # plt.title("Sales")
      8 plt.title(f"y={slope}*x + {intercept}")

d:\program files\python37\lib\site-packages\matplotlib\pyplot.py in plot(scalex, scaley, data, *args, **kwargs)
   2793     return gca().plot(
   2794         *args, scalex=scalex, scaley=scaley, **({"data": data} if data
-> 2795         is not None else {}), **kwargs)
   2796
   2797

d:\program files\python37\lib\site-packages\matplotlib\axes\_axes.py in plot(self, scalex, scaley, data, *args, **kwargs)
   1664         """
   1665         kwargs = cbook.normalize_kwargs(kwargs, mlines.Line2D._alias_map)
-> 1666         lines = [*self._get_lines(*args, data=data, **kwargs)]
   1667         for line in lines:
   1668             self.add_line(line)

d:\program files\python37\lib\site-packages\matplotlib\axes\_base.py in __call__(self, *args, **kwargs)
    223                 this += args[0],
    224                 args = args[1:]
--> 225             yield from self._plot_args(this, kwargs)
    226
    227     def get_next_color(self):

d:\program files\python37\lib\site-packages\matplotlib\axes\_base.py in _plot_args(self, tup, kwargs)
    397             func = self._makefill
    398
--> 399         ncx, ncy = x.shape[1], y.shape[1]
    400         if ncx > 1 and ncy > 1 and ncx != ncy:
    401             cbook.warn_deprecated(

IndexError: tuple index out of range
![]()
24.条件格式

import pandas as pd
import seaborn as sns

students = pd.read_excel(r"C:\Users\67001\Desktop\Students.xlsx",index_col='ID')
students

# 设置分数小于60的字体颜色为红色
def low_score_red(s):
    color = 'red' if s<60 else 'black'
    return f'color:{color}'

# 设置每一列分数最高的背景色为柠檬色
def highest_score_green(col):
    return ['background-color:lime' if s==col.max() else 'background-color:white' for s in col]

students.style.applymap(low_score_red,subset=['Test_1','Test_2','Test_3']) \
    .apply(highest_score_green,subset=['Test_1','Test_2','Test_3'])

color_map = sns.light_palette('green',low = 1,high = 0,as_cmap=True)
students

students.style.background_gradient(color_map,subset=['Test_1','Test_2','Test_3'])

students.style.background_gradient(cmap='Reds',low = 0,high = 1,subset=['Test_1','Test_2','Test_3'])

student1 = students.style.bar(color='red',subset=['Test_1','Test_2','Test_3'])
student1

# student1.to_excel(r"C:\Users\67001\Desktop\Students1.xlsx",index=False)
25.行操作集锦

page_001 = pd.read_excel(r"C:\Users\67001\Desktop\Students.xlsx",sheet_name='page_001')
page_002 = pd.read_excel(r"C:\Users\67001\Desktop\Students.xlsx",sheet_name='page_002')

print(page_001.head())
print(page_002.head())
'''
ID         Name  score
0   1  Student_001     90
1   2  Student_002     90
2   3  Student_003     90
3   4  Student_004     90
4   5  Student_005     90
   ID         Name  score
0  21  Student_021     80
1  22  Student_022     80
2  23  Student_023     80
3  24  Student_024     80
4  25  Student_025     80
'''

# 拼接 Dataframe,生成新的索引
students = page_001.append(page_002).reset_index(drop=True)
# students

# 添加一行新的数据
# stu = pd.Series({'ID':41,'Name':'Lin','score':100})
# students = students.append(stu,ignore_index=True)
# students

# 修改单元格内容
# students.at[39,'Name'] = 'li'
# students.at[39,'score'] = '88'

# 替换一行内容
# stu = pd.Series({'ID':40,'Name':'lin','score':0})
# students.iloc[39] = stu

# 插入行
# stu = pd.Series({'ID':100,'Name':'ixan','score':0})
# part1 = students[:20]
# part2 = students[20:]
# students = part1.append(stu,ignore_index=True).append(part2).reset_index(drop=True)

# 删除行
# students.drop(index=[0,1],inplace=True)

# students.drop(index=range(0,10),inplace=True)

# students.drop(index=students[0:10].index,inplace=True)

for i in range(5,15):
    students['Name'].at[i] = ''

# 按条件删除行
missing = students.loc[students['Name'] == '']
# missing
students.drop(index=missing.index,inplace=True)
students = students.reset_index(drop=True)

students
'''
ID    Name    score
0    1    Student_001    90
1    2    Student_002    90
2    3    Student_003    90
3    4    Student_004    90
4    5    Student_005    90
5    16    Student_016    90
6    17    Student_017    90
7    18    Student_018    90
8    19    Student_019    90
9    20    Student_020    90
10    21    Student_021    80
11    22    Student_022    80
12    23    Student_023    80
13    24    Student_024    80
14    25    Student_025    80
15    26    Student_026    80
16    27    Student_027    80
17    28    Student_028    80
18    29    Student_029    80
19    30    Student_030    80
20    31    Student_031    80
21    32    Student_032    80
22    33    Student_033    80
23    34    Student_034    80
24    35    Student_035    80
25    36    Student_036    80
26    37    Student_037    80
27    38    Student_038    80
28    39    Student_039    80
29    40    Student_040    80
'''
26.列操作集锦

import pandas as pd
import numpy as np

page_001 = pd.read_excel(r"C:\Users\67001\Desktop\Students.xlsx",sheet_name='page_001')
page_002 = pd.read_excel(r"C:\Users\67001\Desktop\Students.xlsx",sheet_name='page_002')

# 列数据拼接
# students = pd.concat([page_001,page_002],axis=1)

students = pd.concat([page_001,page_002]).reset_index(drop=True)

# 追加一列
# students['Age'] = 25

# students['Age'] = range(0,len(students))

students['Age'] = np.arange(0,len(students))

# 删除列
students.drop(columns=['Age','score'],inplace=True)

# 插入列
# students.insert(1,column='Foo',value=np.repeat('foo',len(students)))
students.insert(1,column='A',value=students['ID']*2)

# 修改列名
students.rename(columns={'Foo':'foo','Name':'name'},inplace=True)

# 修改数据类型
students['ID'] = students['ID'].astype(float)

for i in range(5,15):
    students['ID'].at[i] = np.nan

# 删除空行
students.dropna(inplace=True)

students
'''
    ID    A    foo    name
0    1.0    2    foo    Student_001
1    2.0    4    foo    Student_002
2    3.0    6    foo    Student_003
3    4.0    8    foo    Student_004
4    5.0    10    foo    Student_005
15    16.0    32    foo    Student_016
16    17.0    34    foo    Student_017
17    18.0    36    foo    Student_018
18    19.0    38    foo    Student_019
19    20.0    40    foo    Student_020
20    21.0    42    foo    Student_021
21    22.0    44    foo    Student_022
22    23.0    46    foo    Student_023
23    24.0    48    foo    Student_024
24    25.0    50    foo    Student_025
25    26.0    52    foo    Student_026
26    27.0    54    foo    Student_027
27    28.0    56    foo    Student_028
28    29.0    58    foo    Student_029
29    30.0    60    foo    Student_030
30    31.0    62    foo    Student_031
31    32.0    64    foo    Student_032
32    33.0    66    foo    Student_033
33    34.0    68    foo    Student_034
34    35.0    70    foo    Student_035
35    36.0    72    foo    Student_036
36    37.0    74    foo    Student_037
37    38.0    76    foo    Student_038
38    39.0    78    foo    Student_039
39    40.0    80    foo    Student_040
'''
27.连接数据库
28.编写复杂方程
请你一定不要停下来 成为你想成为的人
感谢您的阅读,我是LXL

 浙公网安备 33010602011771号