第十周
1、总结各系统版本的zabbix安装。
rocky8下安装zabbix6.0
yum安装zabbix

安装zabbix-server
https://www.zabbix.com/cn/download?zabbix=6.0&os_distribution=rocky_linux&os_version=9&components=server_frontend_agent&db=mysql&ws=apache

# rpm -Uvh https://repo.zabbix.com/zabbix/6.0/rhel/9/x86_64/zabbix-release-6.0-4.el9.noarch.rpm
# dnf clean all

# dnf install zabbix-server-mysql zabbix-web-mysql zabbix-apache-conf zabbix-sql-scripts zabbix-selinux-policy zabbix-agent

安装数据库和初始化数据库
#yum install -y mysql-server
[root@Rocky8 ~]# mysql
mysql> create database zabbix character set utf8mb4 collate utf8mb4_bin;
mysql> grant all privileges on zabbix.* to zabbix@localhost;
mysql> set global log_bin_trust_function_creators = 1;

#导入初始架构和数据
# zcat /usr/share/zabbix-sql-scripts/mysql/server.sql.gz | mysql --default-character-set=utf8mb4 -uzabbix -p zabbix
#验证数据库
mysql> show databases;
+--------------------+
| Database           |
+--------------------+
| information_schema |
| mysql              |
| performance_schema |
| sys                |
| zabbix             |
+--------------------+
5 rows in set (0.00 sec)

mysql> use zabbix;
Reading table information for completion of table and column names
You can turn off this feature to get a quicker startup with -A

Database changed
mysql> show tables;
+----------------------------+
| Tables_in_zabbix           |
+----------------------------+
| acknowledges               |
| actions                    |
| alerts                     |
| auditlog                   |
| autoreg_host               |
| conditions                 |
| config                     |
| config_autoreg_tls         |
| corr_condition             |
| corr_condition_group       |
| corr_condition_tag         |
| corr_condition_tagpair     |
| corr_condition_tagvalue    |
| corr_operation             |
| correlation                |
| dashboard                  |
| dashboard_page             |
| dashboard_user             |
| dashboard_usrgrp           |
| dbversion                  |
| dchecks                    |
| dhosts                     |
| drules                     |
| dservices                  |
| escalations                |
| event_recovery             |
| event_suppress             |
| event_tag                  |
| events                     |
| expressions                |
| functions                  |
| globalmacro                |
| globalvars                 |
| graph_discovery            |
| graph_theme                |
| graphs                     |
| graphs_items               |
| group_discovery            |
| group_prototype            |
| ha_node                    |
| history                    |
| history_log                |
| history_str                |
| history_text               |
| history_uint               |
| host_discovery             |
| host_inventory             |
| host_tag                   |
| hostmacro                  |
| hosts                      |
| hosts_groups               |
| hosts_templates            |
| housekeeper                |
| hstgrp                     |
| httpstep                   |
| httpstep_field             |
| httpstepitem               |
| httptest                   |
| httptest_field             |
| httptest_tag               |
| httptestitem               |
| icon_map                   |
| icon_mapping               |
| ids                        |
| images                     |
| interface                  |
| interface_discovery        |
| interface_snmp             |
| item_condition             |
| item_discovery             |
| item_parameter             |
| item_preproc               |
| item_rtdata                |
| item_tag                   |
| items                      |
| lld_macro_path             |
| lld_override               |
| lld_override_condition     |
| lld_override_opdiscover    |
| lld_override_operation     |
| lld_override_ophistory     |
| lld_override_opinventory   |
| lld_override_opperiod      |
| lld_override_opseverity    |
| lld_override_opstatus      |
| lld_override_optag         |
| lld_override_optemplate    |
| lld_override_optrends      |
| maintenance_tag            |
| maintenances               |
| maintenances_groups        |
| maintenances_hosts         |
| maintenances_windows       |
| media                      |
| media_type                 |
| media_type_message         |
| media_type_param           |
| module                     |
| opcommand                  |
| opcommand_grp              |
| opcommand_hst              |
| opconditions               |
| operations                 |
| opgroup                    |
| opinventory                |
| opmessage                  |
| opmessage_grp              |
| opmessage_usr              |
| optemplate                 |
| problem                    |
| problem_tag                |
| profiles                   |
| proxy_autoreg_host         |
| proxy_dhistory             |
| proxy_history              |
| regexps                    |
| report                     |
| report_param               |
| report_user                |
| report_usrgrp              |
| rights                     |
| role                       |
| role_rule                  |
| script_param               |
| scripts                    |
| service_alarms             |
| service_problem            |
| service_problem_tag        |
| service_status_rule        |
| service_tag                |
| services                   |
| services_links             |
| sessions                   |
| sla                        |
| sla_excluded_downtime      |
| sla_schedule               |
| sla_service_tag            |
| sysmap_element_trigger     |
| sysmap_element_url         |
| sysmap_shape               |
| sysmap_url                 |
| sysmap_user                |
| sysmap_usrgrp              |
| sysmaps                    |
| sysmaps_element_tag        |
| sysmaps_elements           |
| sysmaps_link_triggers      |
| sysmaps_links              |
| tag_filter                 |
| task                       |
| task_acknowledge           |
| task_check_now             |
| task_close_problem         |
| task_data                  |
| task_remote_command        |
| task_remote_command_result |
| task_result                |
| timeperiods                |
| token                      |
| trends                     |
| trends_uint                |
| trigger_depends            |
| trigger_discovery          |
| trigger_queue              |
| trigger_tag                |
| triggers                   |
| users                      |
| users_groups               |
| usrgrp                     |
| valuemap                   |
| valuemap_mapping           |
| widget                     |
| widget_field               |
+----------------------------+
173 rows in set (0.00 sec)

mysql>
#为Zabbix server配置数据库
[root@Rocky8 ~]# cat /etc/zabbix/zabbix_server.conf
DBPassword=123456
#重启Zabbix server和agent进程
systemctl restart zabbix-server zabbix-agent httpd php-fpm

#zabbix网页配置就完成安装zabbix-server了
#注意问题:
修改时区问题
中文乱码问题
#zabbix-agent安装
# rpm -Uvh https://repo.zabbix.com/zabbix/6.0/rhel/9/x86_64/zabbix-release-6.0-4.el9.noarch.rpm
# dnf clean all
#dnf install zabbix-agent
vi /etc/zabbix/zabbix_agentd.conf
。。。。
server 10.0.0.4 #指向当前zabbix-server
ListenPort 10050 #监听端口
startAgents=3 #被动状态时默认启动的实例数
Hostname=10.0.0.24 #区分大小写在zabbix-server唯一的值

重启zabbix——agent服务
[root@localhost src]# systemctl restart zabbix-agent.service
[root@localhost src]# systemctl status zabbix-agent.service
安装完成后的web界面
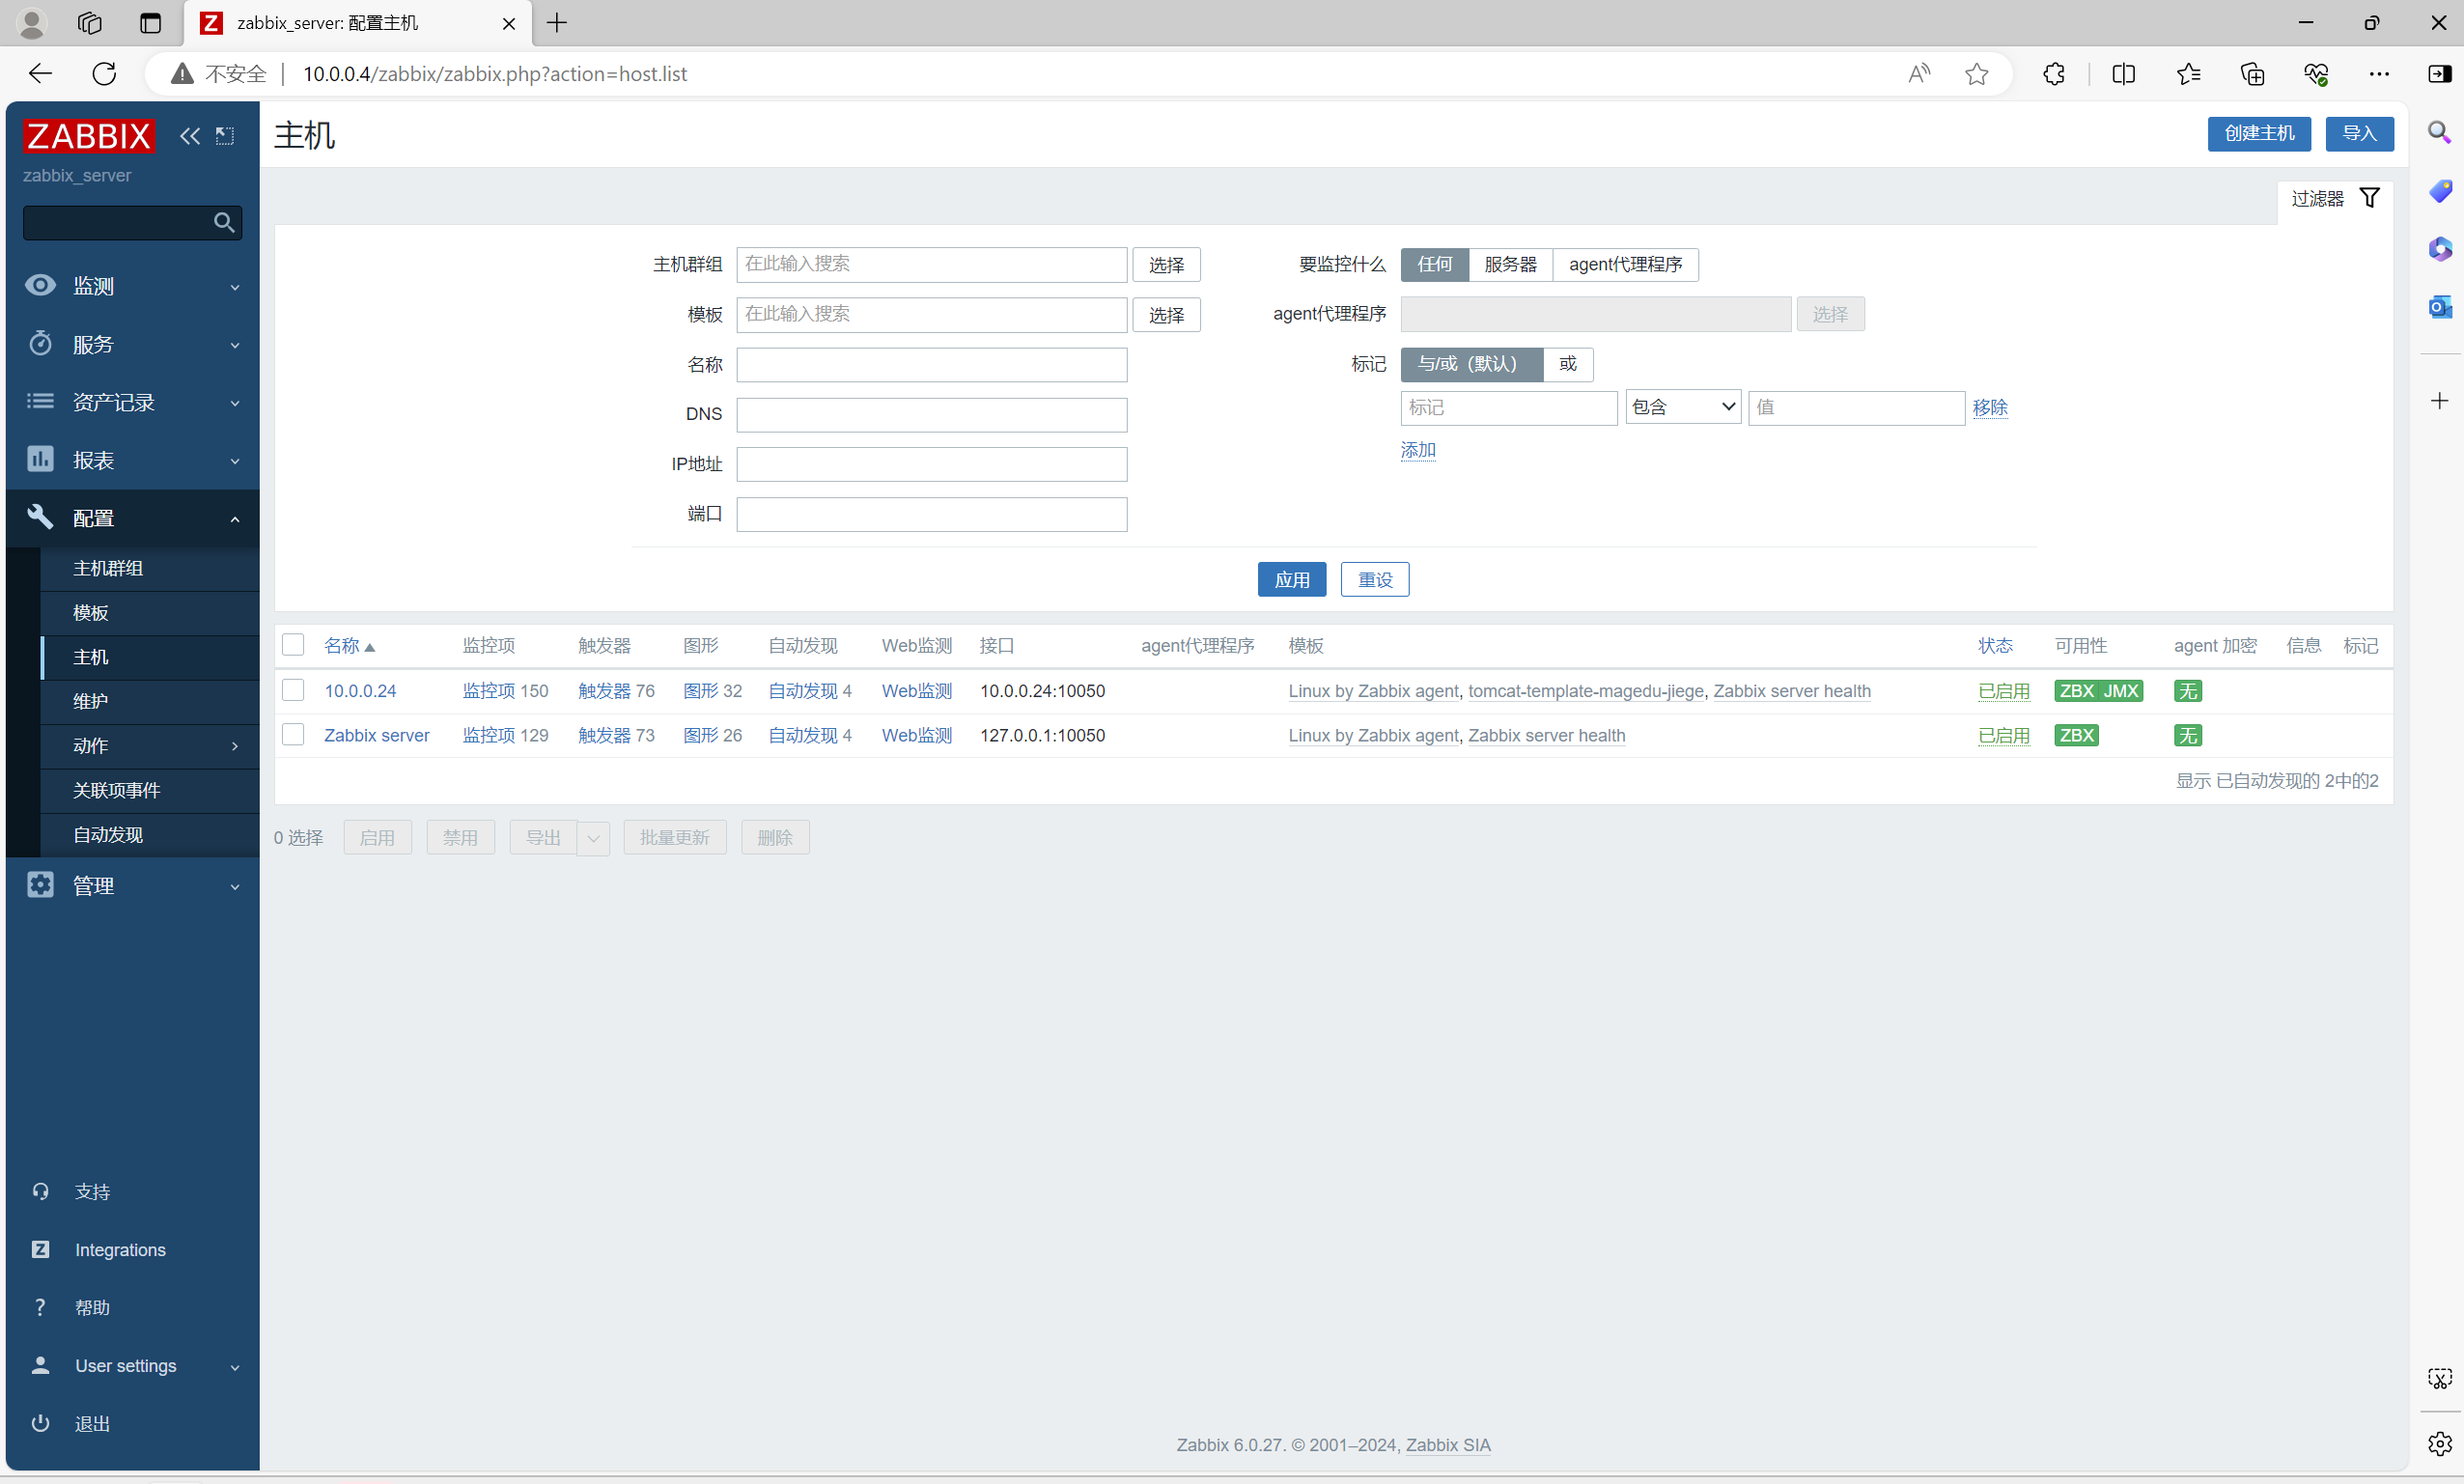
2、总结 zabbix主动模式和被动模式简介及实现
主动模式和被动模式都是将Agent作为参照的
被动模式:由Server建立TCP链接并向Agent端发送请求。Agent需启动监听端口,等待Server连接。
被动模式下的端口状态:
[root@Rocky8 ~]# netstat -tanlp |grep 10050
tcp        0      0 0.0.0.0:10050           0.0.0.0:*               LISTEN      978/zabbix_agentd
tcp        0      0 127.0.0.1:10050         127.0.0.1:60338         TIME_WAIT   -
tcp        0      0 127.0.0.1:10050         127.0.0.1:60366         TIME_WAIT   -
tcp        0      0 127.0.0.1:10050         127.0.0.1:60388         TIME_WAIT   -
tcp        0      0 127.0.0.1:10050         127.0.0.1:60360         TIME_WAIT   -
tcp        0      0 127.0.0.1:10050         127.0.0.1:60370         TIME_WAIT   -
tcp        0      0 127.0.0.1:60420         127.0.0.1:10050         TIME_WAIT   -
tcp        0      0 127.0.0.1:10050         127.0.0.1:60424         TIME_WAIT   -
tcp        0      0 127.0.0.1:10050         127.0.0.1:60486         TIME_WAIT   -
tcp        0      0 127.0.0.1:10050         127.0.0.1:60332         TIME_WAIT   -
tcp        0      0 127.0.0.1:10050         127.0.0.1:60380         TIME_WAIT   -
tcp        0      0 127.0.0.1:10050         127.0.0.1:60498         TIME_WAIT   -
tcp        0      0 127.0.0.1:10050         127.0.0.1:60324         TIME_WAIT   -
tcp        0      0 127.0.0.1:10050         127.0.0.1:60358         TIME_WAIT   -
tcp        0      0 127.0.0.1:10050         127.0.0.1:60468         TIME_WAIT   -
tcp        0      0 127.0.0.1:10050         127.0.0.1:60500         TIME_WAIT   -
tcp        0      0 127.0.0.1:10050         127.0.0.1:60376         TIME_WAIT   -
tcp        0      0 127.0.0.1:10050         127.0.0.1:60414         TIME_WAIT   -
tcp        0      0 127.0.0.1:10050         127.0.0.1:60390         TIME_WAIT   -
tcp        0      0 127.0.0.1:10050         127.0.0.1:60374         TIME_WAIT   -
tcp        0      0 127.0.0.1:10050         127.0.0.1:60384         TIME_WAIT   -
tcp        0      0 127.0.0.1:10050         127.0.0.1:60330         TIME_WAIT   -
tcp        0      0 127.0.0.1:10050         127.0.0.1:60410         TIME_WAIT   -
tcp        0      0 127.0.0.1:10050         127.0.0.1:60348         TIME_WAIT   -
tcp        0      0 127.0.0.1:10050         127.0.0.1:60362         TIME_WAIT   -
tcp        0      0 127.0.0.1:10050         127.0.0.1:60368         TIME_WAIT   -
tcp        0      0 127.0.0.1:10050         127.0.0.1:60440         TIME_WAIT   -
tcp        0      0 127.0.0.1:10050         127.0.0.1:60400         TIME_WAIT   -
tcp        0      0 127.0.0.1:10050         127.0.0.1:60446         TIME_WAIT   -
tcp        0      0 127.0.0.1:10050         127.0.0.1:60460         TIME_WAIT   -
tcp        0      0 127.0.0.1:10050         127.0.0.1:60406         TIME_WAIT   -
tcp        0      0 127.0.0.1:10050         127.0.0.1:60316         TIME_WAIT   -
tcp        0      0 127.0.0.1:10050         127.0.0.1:60494         TIME_WAIT   -
tcp        0      0 127.0.0.1:10050         127.0.0.1:60514         TIME_WAIT   -
tcp        0      0 127.0.0.1:10050         127.0.0.1:60472         TIME_WAIT   -
tcp        0      0 127.0.0.1:10050         127.0.0.1:60506         TIME_WAIT   -
tcp        0      0 127.0.0.1:10050         127.0.0.1:60378         TIME_WAIT   -
主动模式:由Agent主动建立TCP链接并向Server端发送请求。因为是Agent主动发起的TCP连接,所以Agent所在机器本身无需再启动监听Agent端口。
#修改agent为主动模式
[10:05:25 root@localhost ~]#grep "^[a-Z]" /etc/zabbix/zabbix_agentd.conf
PidFile=/run/zabbix/zabbix_agentd.pid
LogFile=/var/log/zabbix/zabbix_agentd.log
LogFileSize=0
Server=10.0.0.4
ListenPort=10050
StartAgents=3
ServerActive=10.0.0.4
Hostname=10.0.0.34
Include=/etc/zabbix/zabbix_agentd.d/*.conf
[16:04:08 root@active ~]#netstat -tanlp | grep 10050
tcp 0 0 0.0.0.0:10050 0.0.0.0:* LISTEN 953/zabbix_agentd
tcp 0 0 10.0.0.34:10050 10.0.0.4:37408 TIME_WAIT -
tcp 0 0 10.0.0.34:10050 10.0.0.4:37404 TIME_WAIT -
tcp 0 0 10.0.0.34:10050 10.0.0.4:37400 TIME_WAIT -
tcp 0 0 10.0.0.34:10050 10.0.0.4:37374 TIME_WAIT -
tcp 0 0 10.0.0.34:10050 10.0.0.4:37360 TIME_WAIT -
tcp 0 0 10.0.0.34:10050 10.0.0.4:37398 TIME_WAIT -
tcp 0 0 10.0.0.34:10050 10.0.0.4:37406 TIME_WAIT -
tcp 0 0 10.0.0.34:10050 10.0.0.4:37390 TIME_WAIT -
tcp 0 0 10.0.0.34:10050 10.0.0.4:37410 TIME_WAIT -
tcp 0 0 10.0.0.34:10050 10.0.0.4:37382 TIME_WAIT -
tcp 0 0 10.0.0.34:10050 10.0.0.4:37378 TIME_WAIT -
tcp 0 0 10.0.0.34:10050 10.0.0.4:37394 TIME_WAIT -
tcp 0 0 10.0.0.34:10050 10.0.0.4:37354 TIME_WAIT -
tcp 0 0 10.0.0.34:10050 10.0.0.4:37386 TIME_WAIT -
tcp 0 0 10.0.0.34:10050 10.0.0.4:37356 TIME_WAIT -
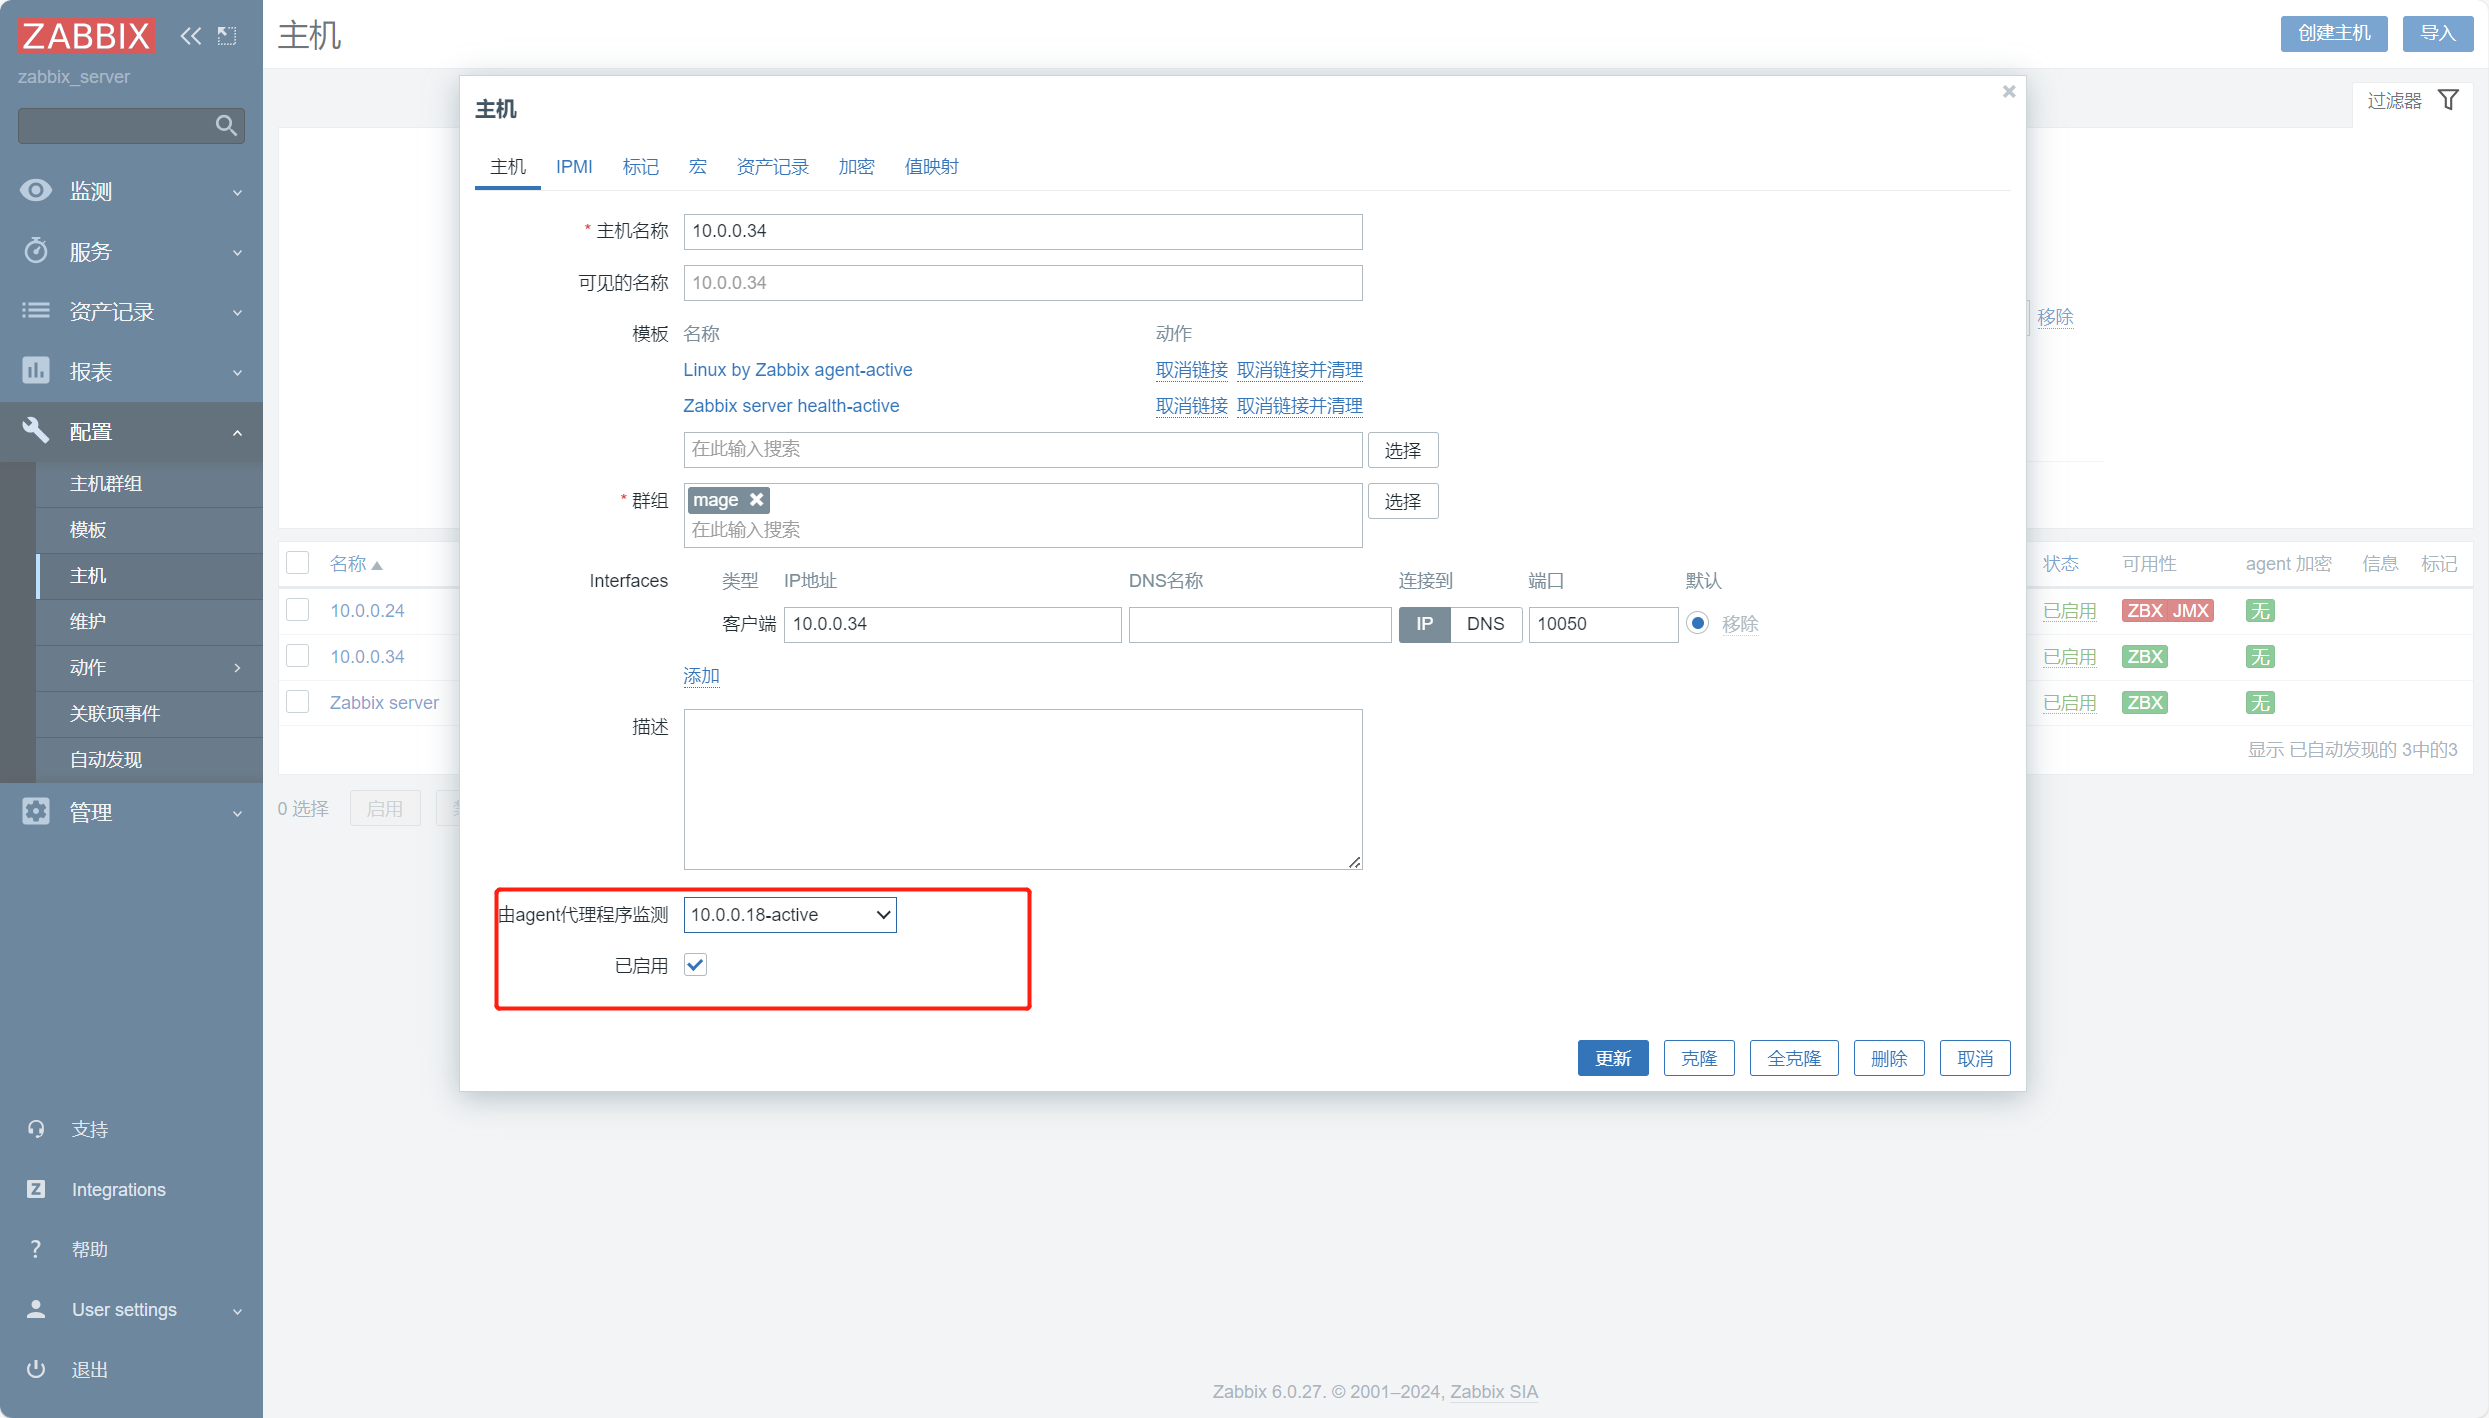
#配置好主动模式的模板,然后添加主动模式主机。
总结:
Zabbix的主动模式和被动模式都是相对agent来说的。一般情况下默认使用的是zabbix的被动模式,即zabbix server根据监控项定义的时间主动去收集zabbix agent上的数据,优点是能使用更多的模板,更具有灵活性,缺点是当zabbix agent节点过多的时候会增加zabbix server的负荷。主动模式就是zabbix agent将消息推送给zabbix server,优点是减轻了zabbix server的压力,缺点是所有的模板要修改为主动模式。
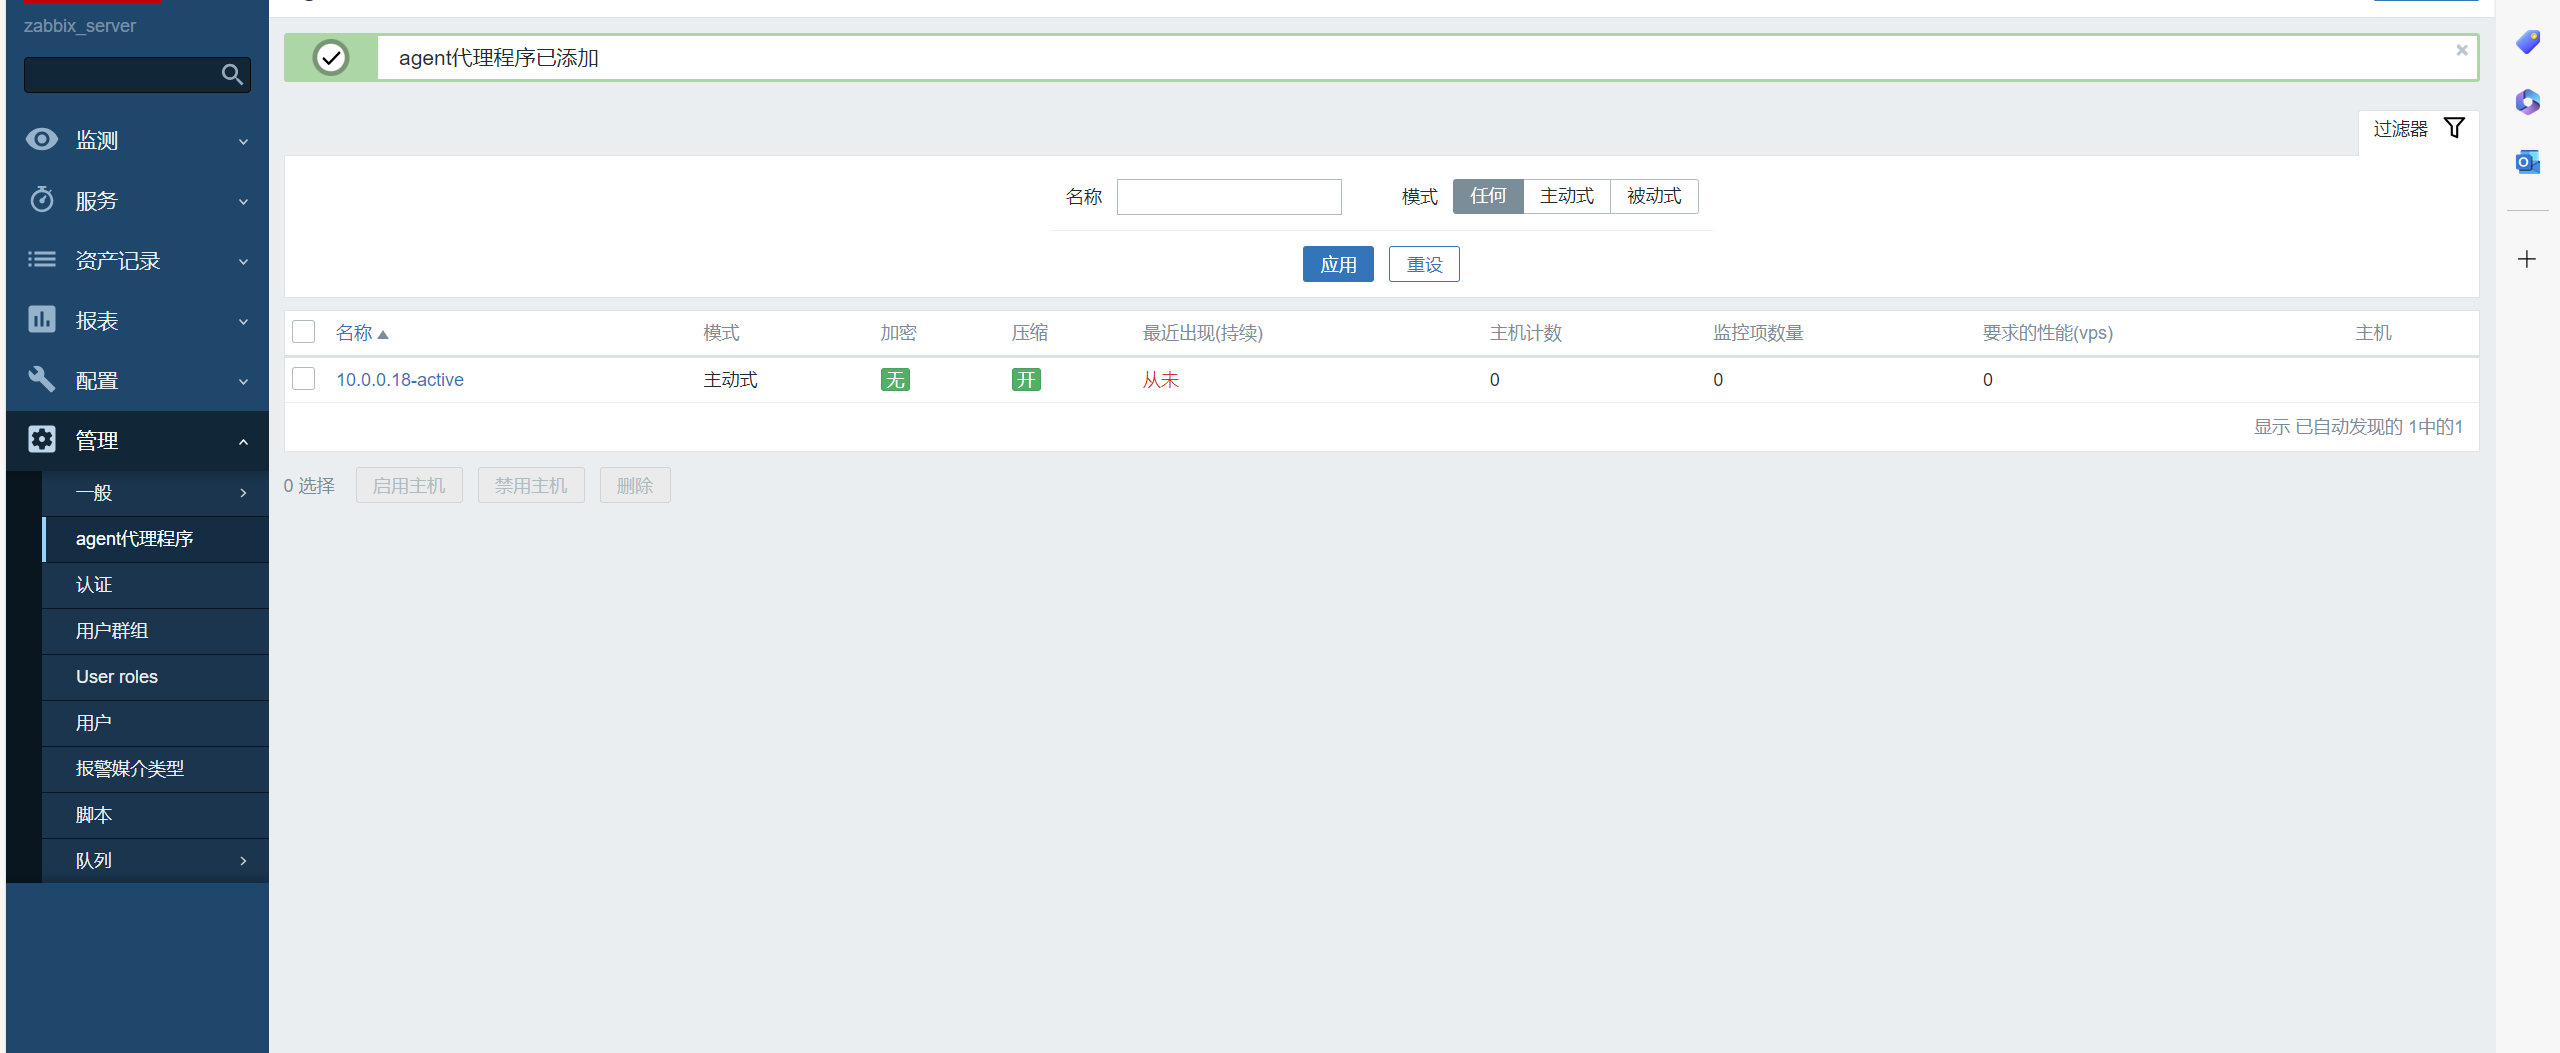
3、总结 zabbix proxy主动及被动案例
proxy主动模式案列
yum安装zabbix-proxy

rpm -Uvh https://repo.zabbix.com/zabbix/6.0/rhel/8/x86_64/zabbix-release-6.0-4.el8.noarch.rpm
dnf install zabbix-proxy-mysql zabbix-sql-scripts zabbix-selinux-policy

在数据库中创建zabbix_proxy_active库
mysql> create database zabbix_proxy_active character set utf8mb4 collate utf8mb4_bin;
Query OK, 1 row affected (0.00 sec)

mysql> create user zabbix@'10.0.0.%' identified by '123456';
Query OK, 0 rows affected (0.01 sec)

mysql> grant all privileges on zabbix_proxy_active.* to zabbix@'10.0.0.%';
Query OK, 0 rows affected (0.00 sec)

#修改zabbix_proxy_conf配置文件
[17:41:12 root@proxy ~]#grep '^[a-Z]' /etc/zabbix/zabbix_proxy.conf
ProxyMode=0
Server=10.0.0.4
Hostname=10.0.0.18-active
ListenPort=10051
LogFile=/var/log/zabbix/zabbix_proxy.log
LogFileSize=0
PidFile=/run/zabbix/zabbix_proxy.pid
SocketDir=/run/zabbix
DBHost=10.0.0.4
DBName=zabbix_proxy_active
DBUser=zabbix
DBPassword=123456
DBPort=3306
ProxyLocalBuffer=720
ProxyOfflineBuffer=720
HeartbeatFrequency=60
StartPollers=5
SNMPTrapperFile=/var/log/snmptrap/snmptrap.log
Timeout=30
LogSlowQueries=3000
StatsAllowedIP=127.0.0.1
#重启服务
[17:44:52 root@proxy ~]#systemctl restart zabbix-proxy.service
#查看端口起来情况
[17:44:52 root@proxy ~]#ss -ntl
State    Recv-Q   Send-Q            Local Address:Port        Peer Address:Port   Process
LISTEN   0        128                     0.0.0.0:22               0.0.0.0:*
LISTEN   0        128                     0.0.0.0:10051            0.0.0.0:*
LISTEN   0        128                        [::]:22                  [::]:*
LISTEN   0        128                        [::]:10051               [::]:*
LISTEN   0        1            [::ffff:127.0.0.1]:8005                   *:*
LISTEN   0        100                           *:8080                   *:*
web添加代理
修改主机
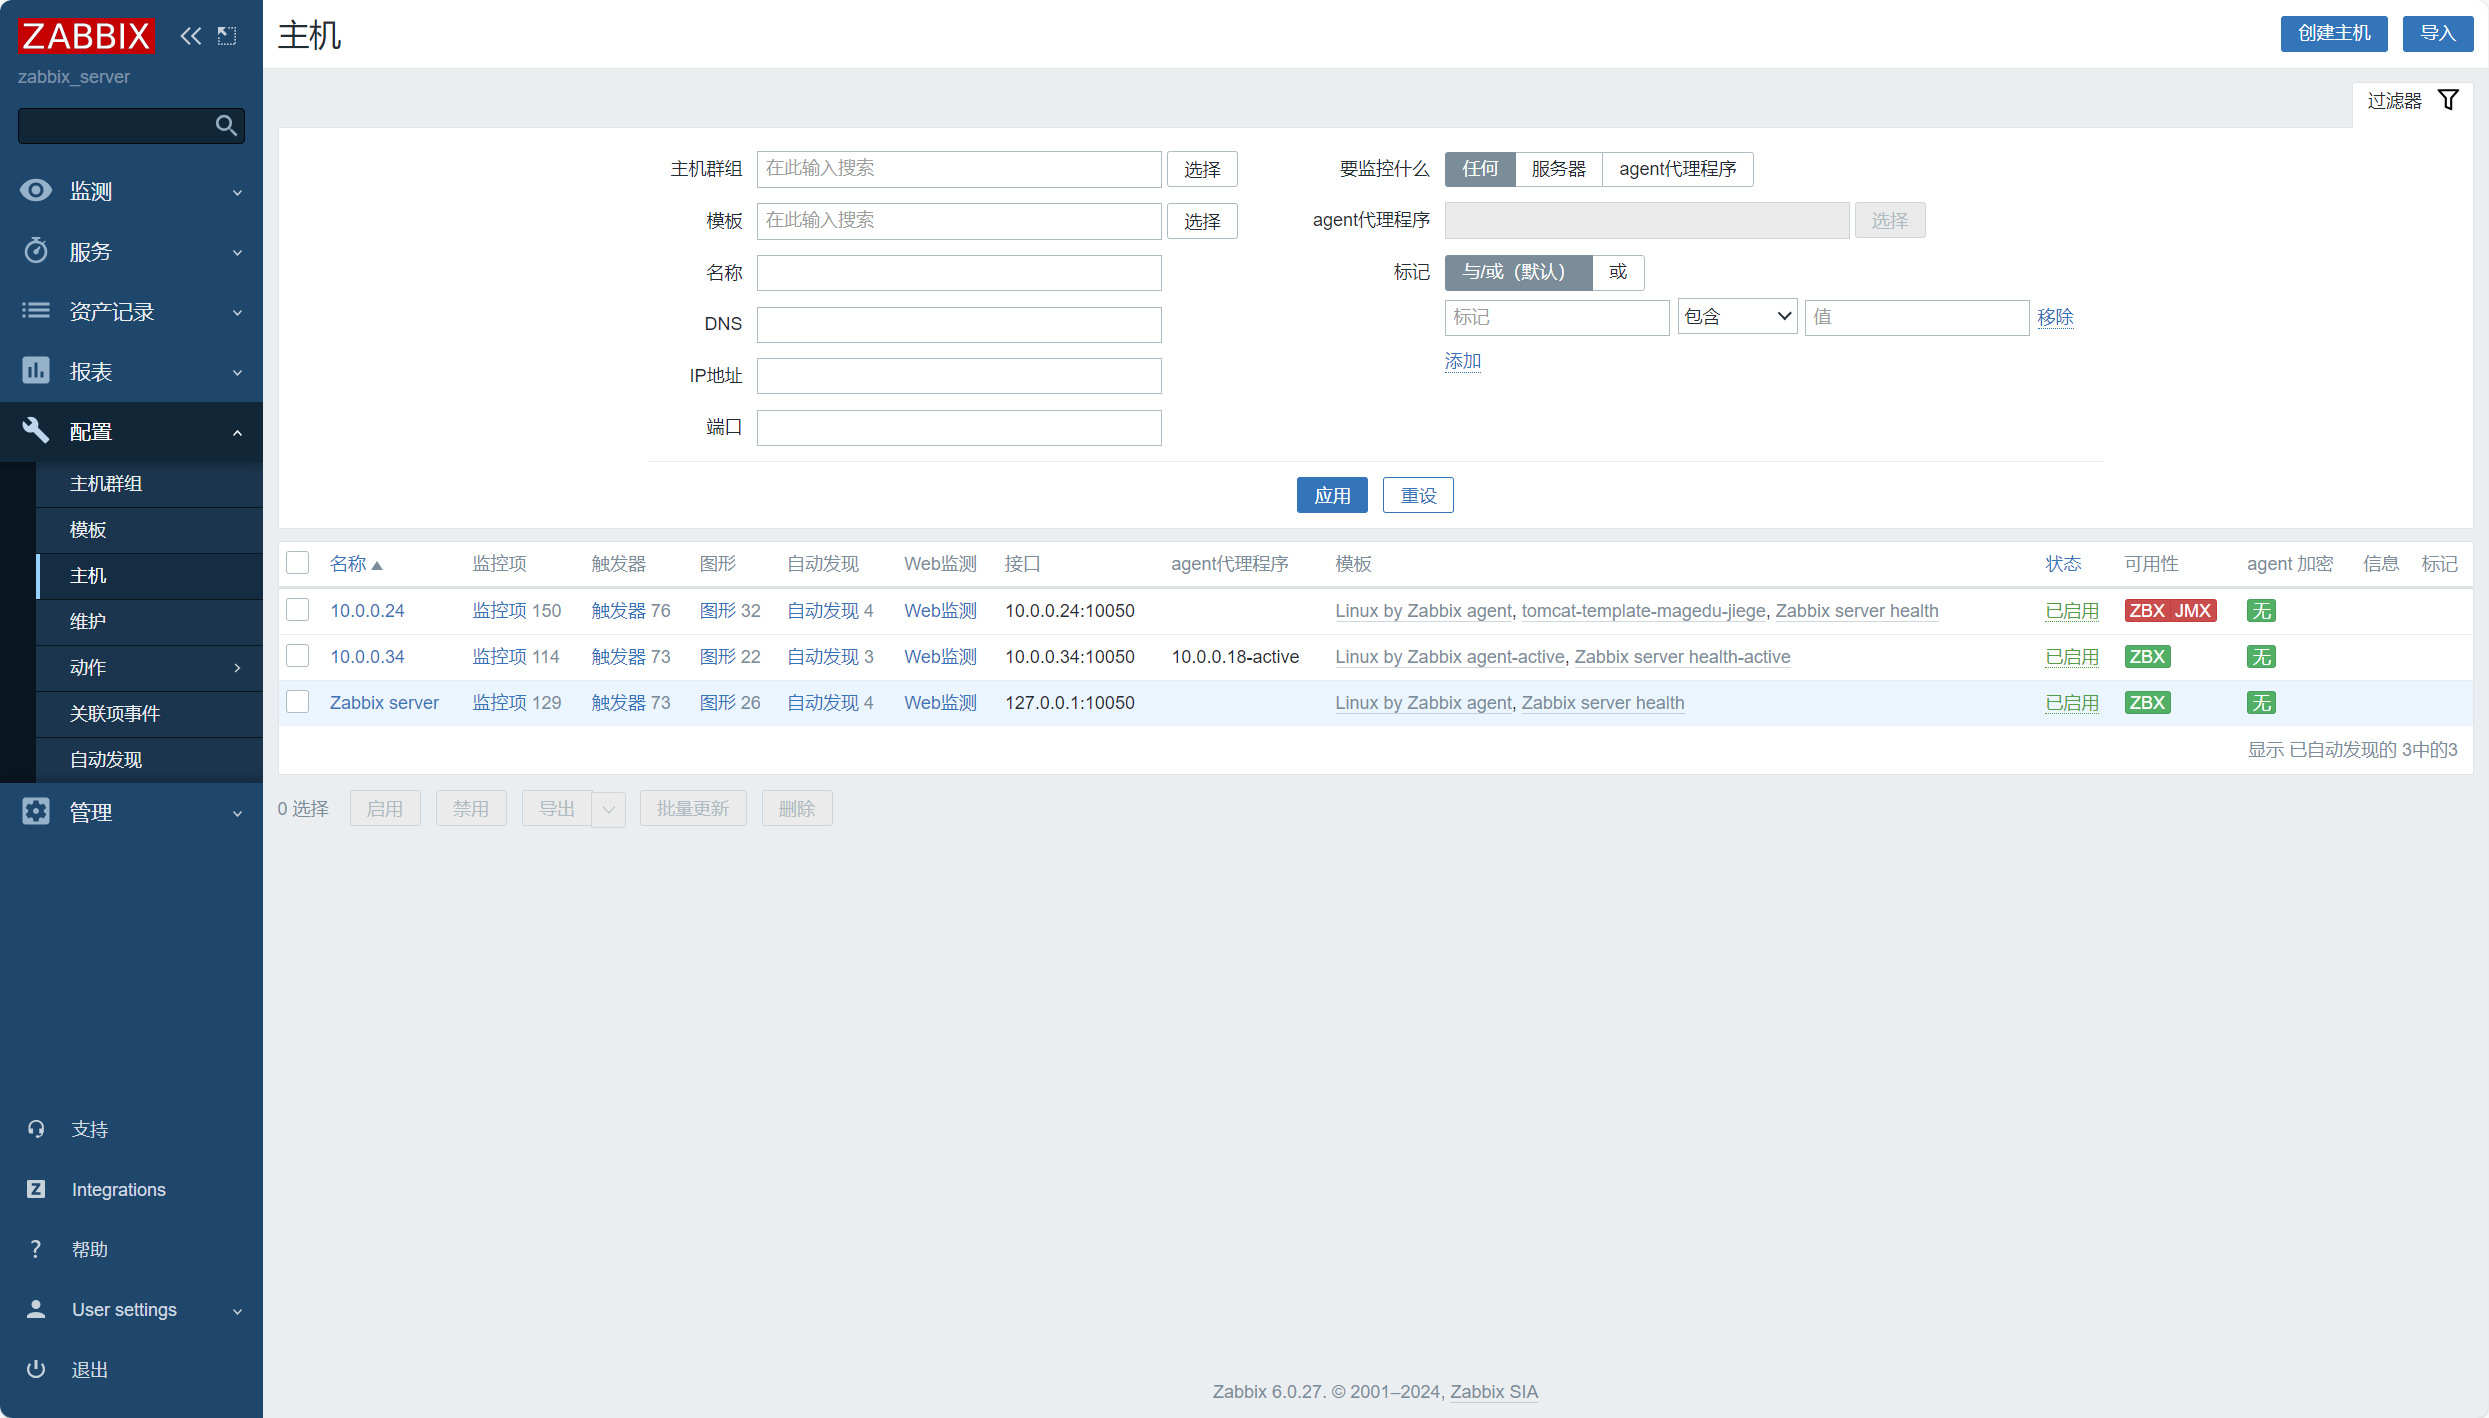
主机状态
4、总结自定义监控,监控win, nginx, 并基于短信/微信报警。
监控win:
1、到zabbix官网下载zabbix-agent的win版本客户端
下载安装包下来后,双击安装

点击下一步,配置好zabbix-server地址
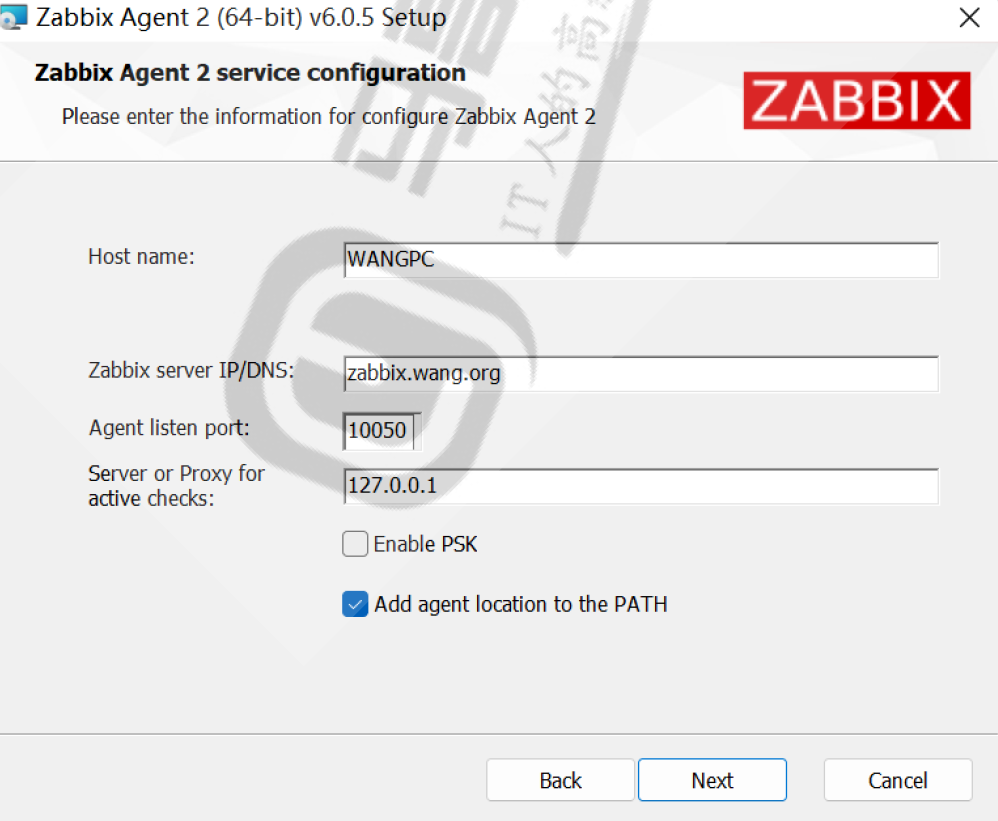
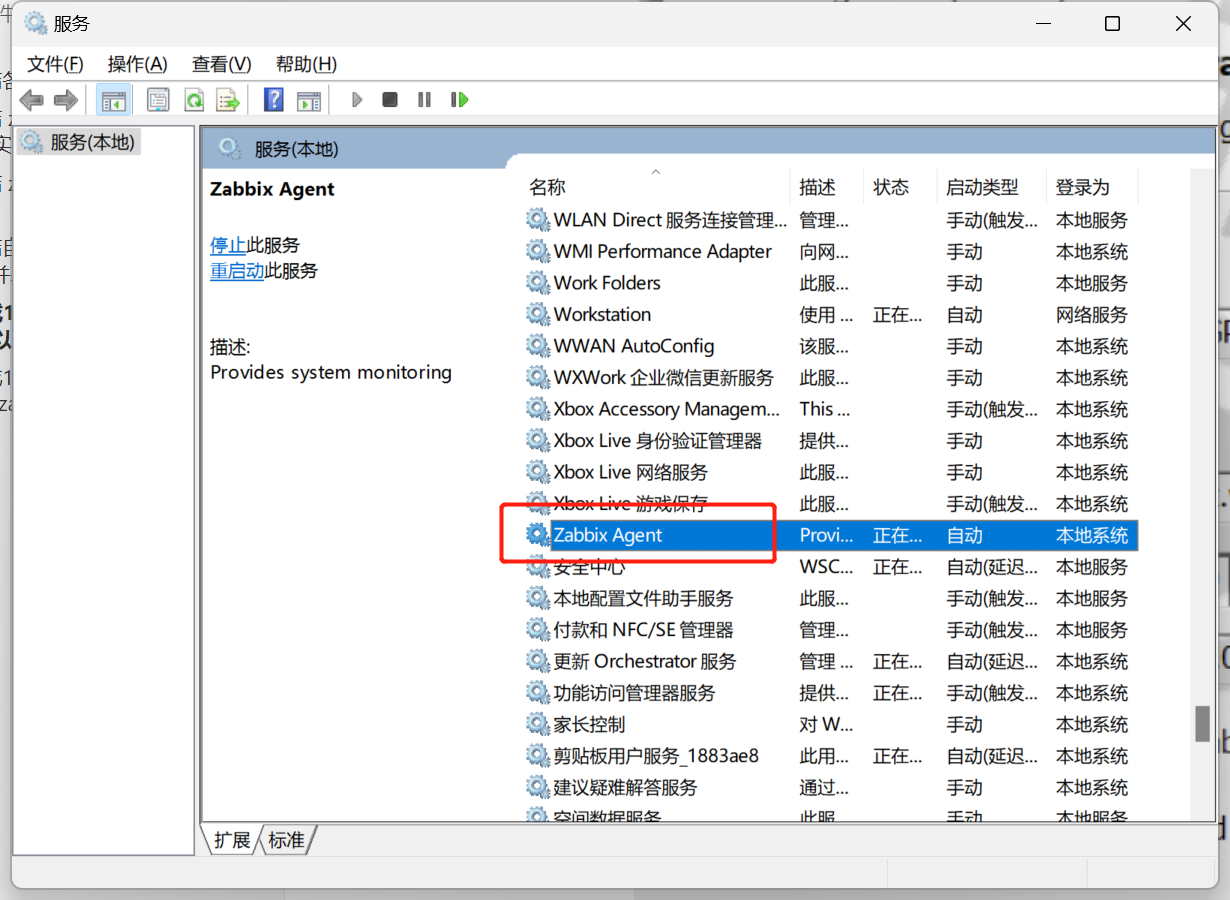
然后运行框输入services.msc在服务中可以看到一个zabbix-agent服务在运行
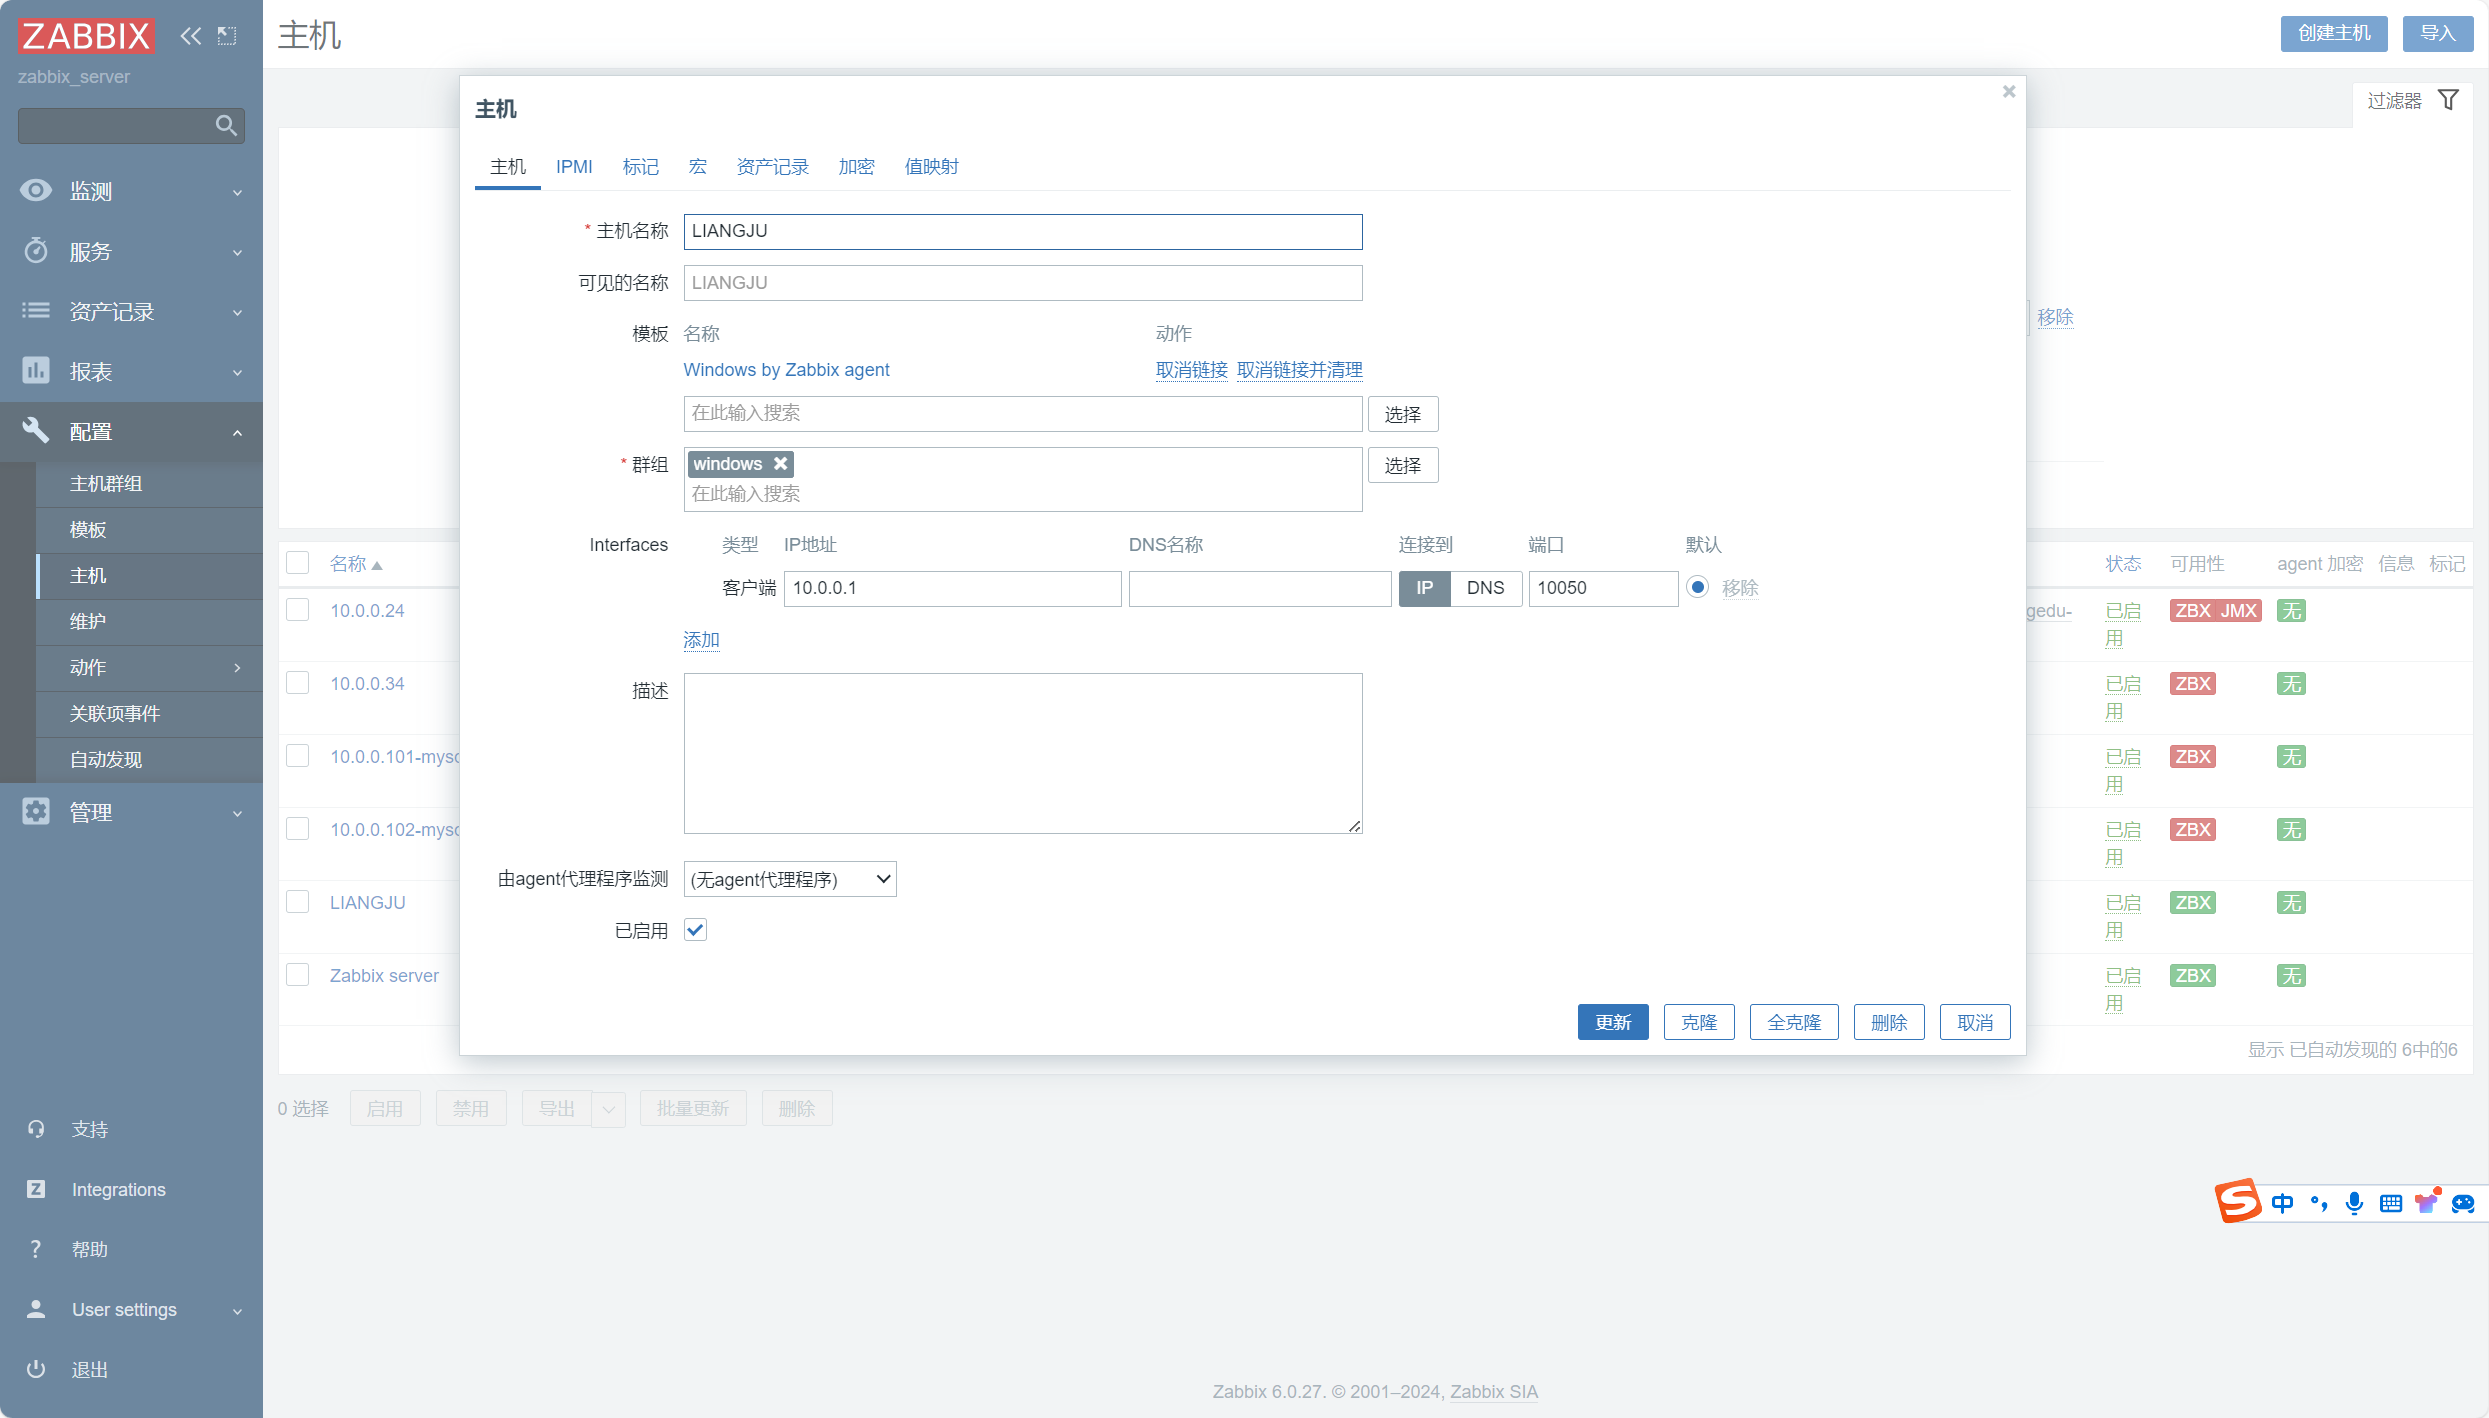
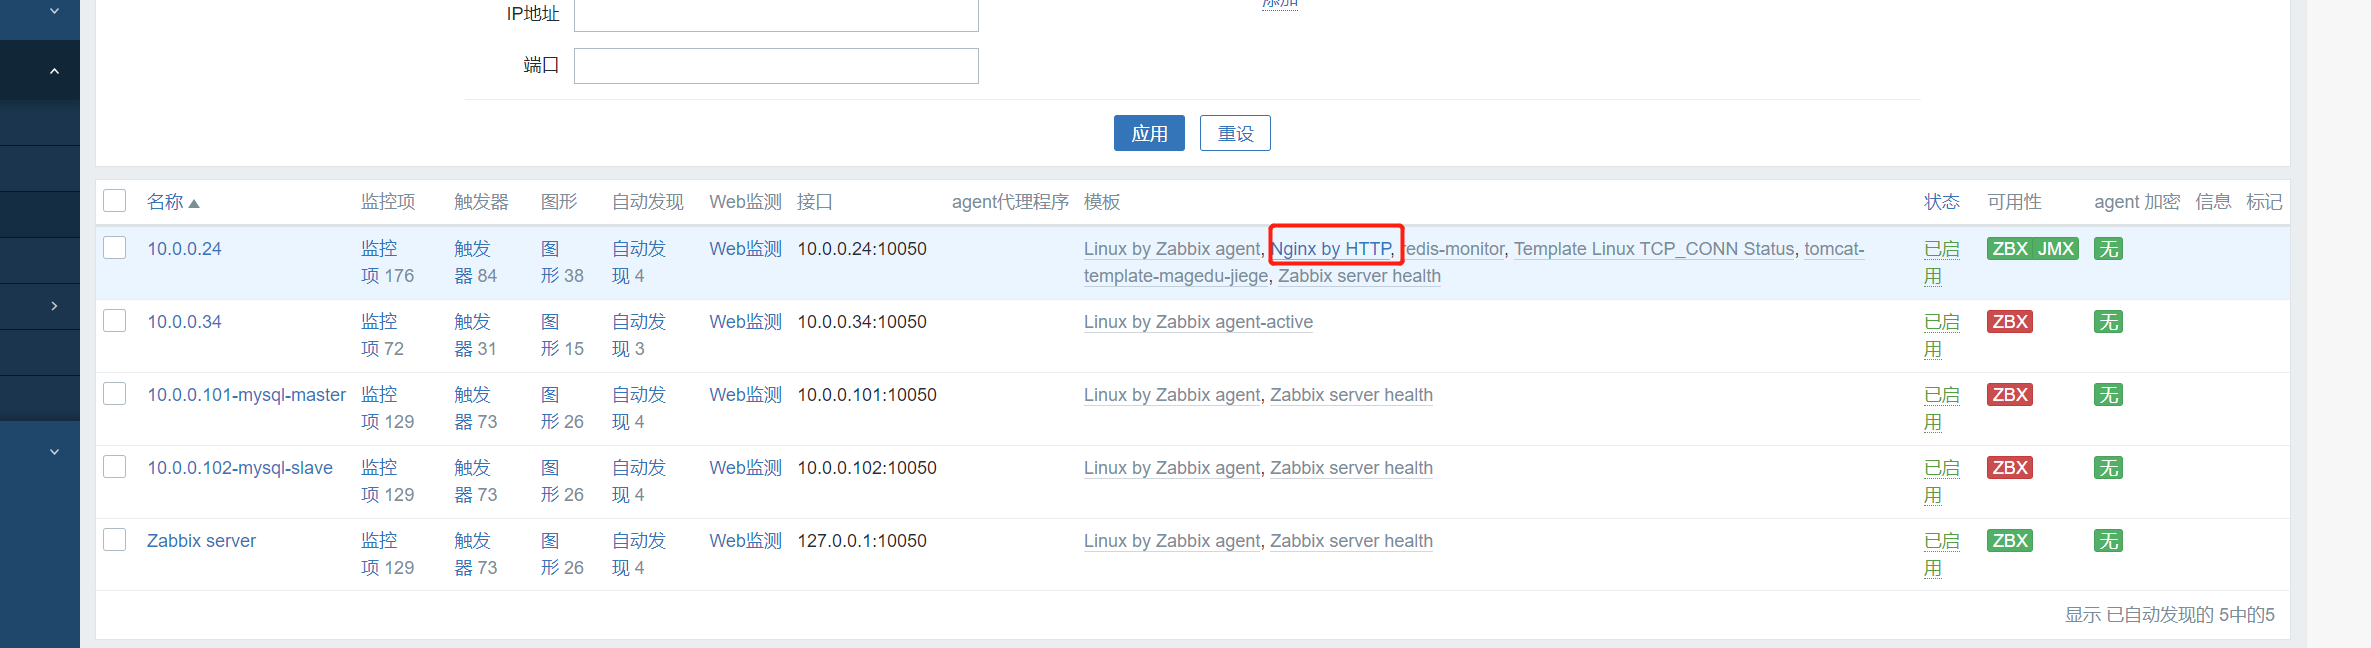
然后再zabbix-web添加win主机,选择适合win的监控模板。
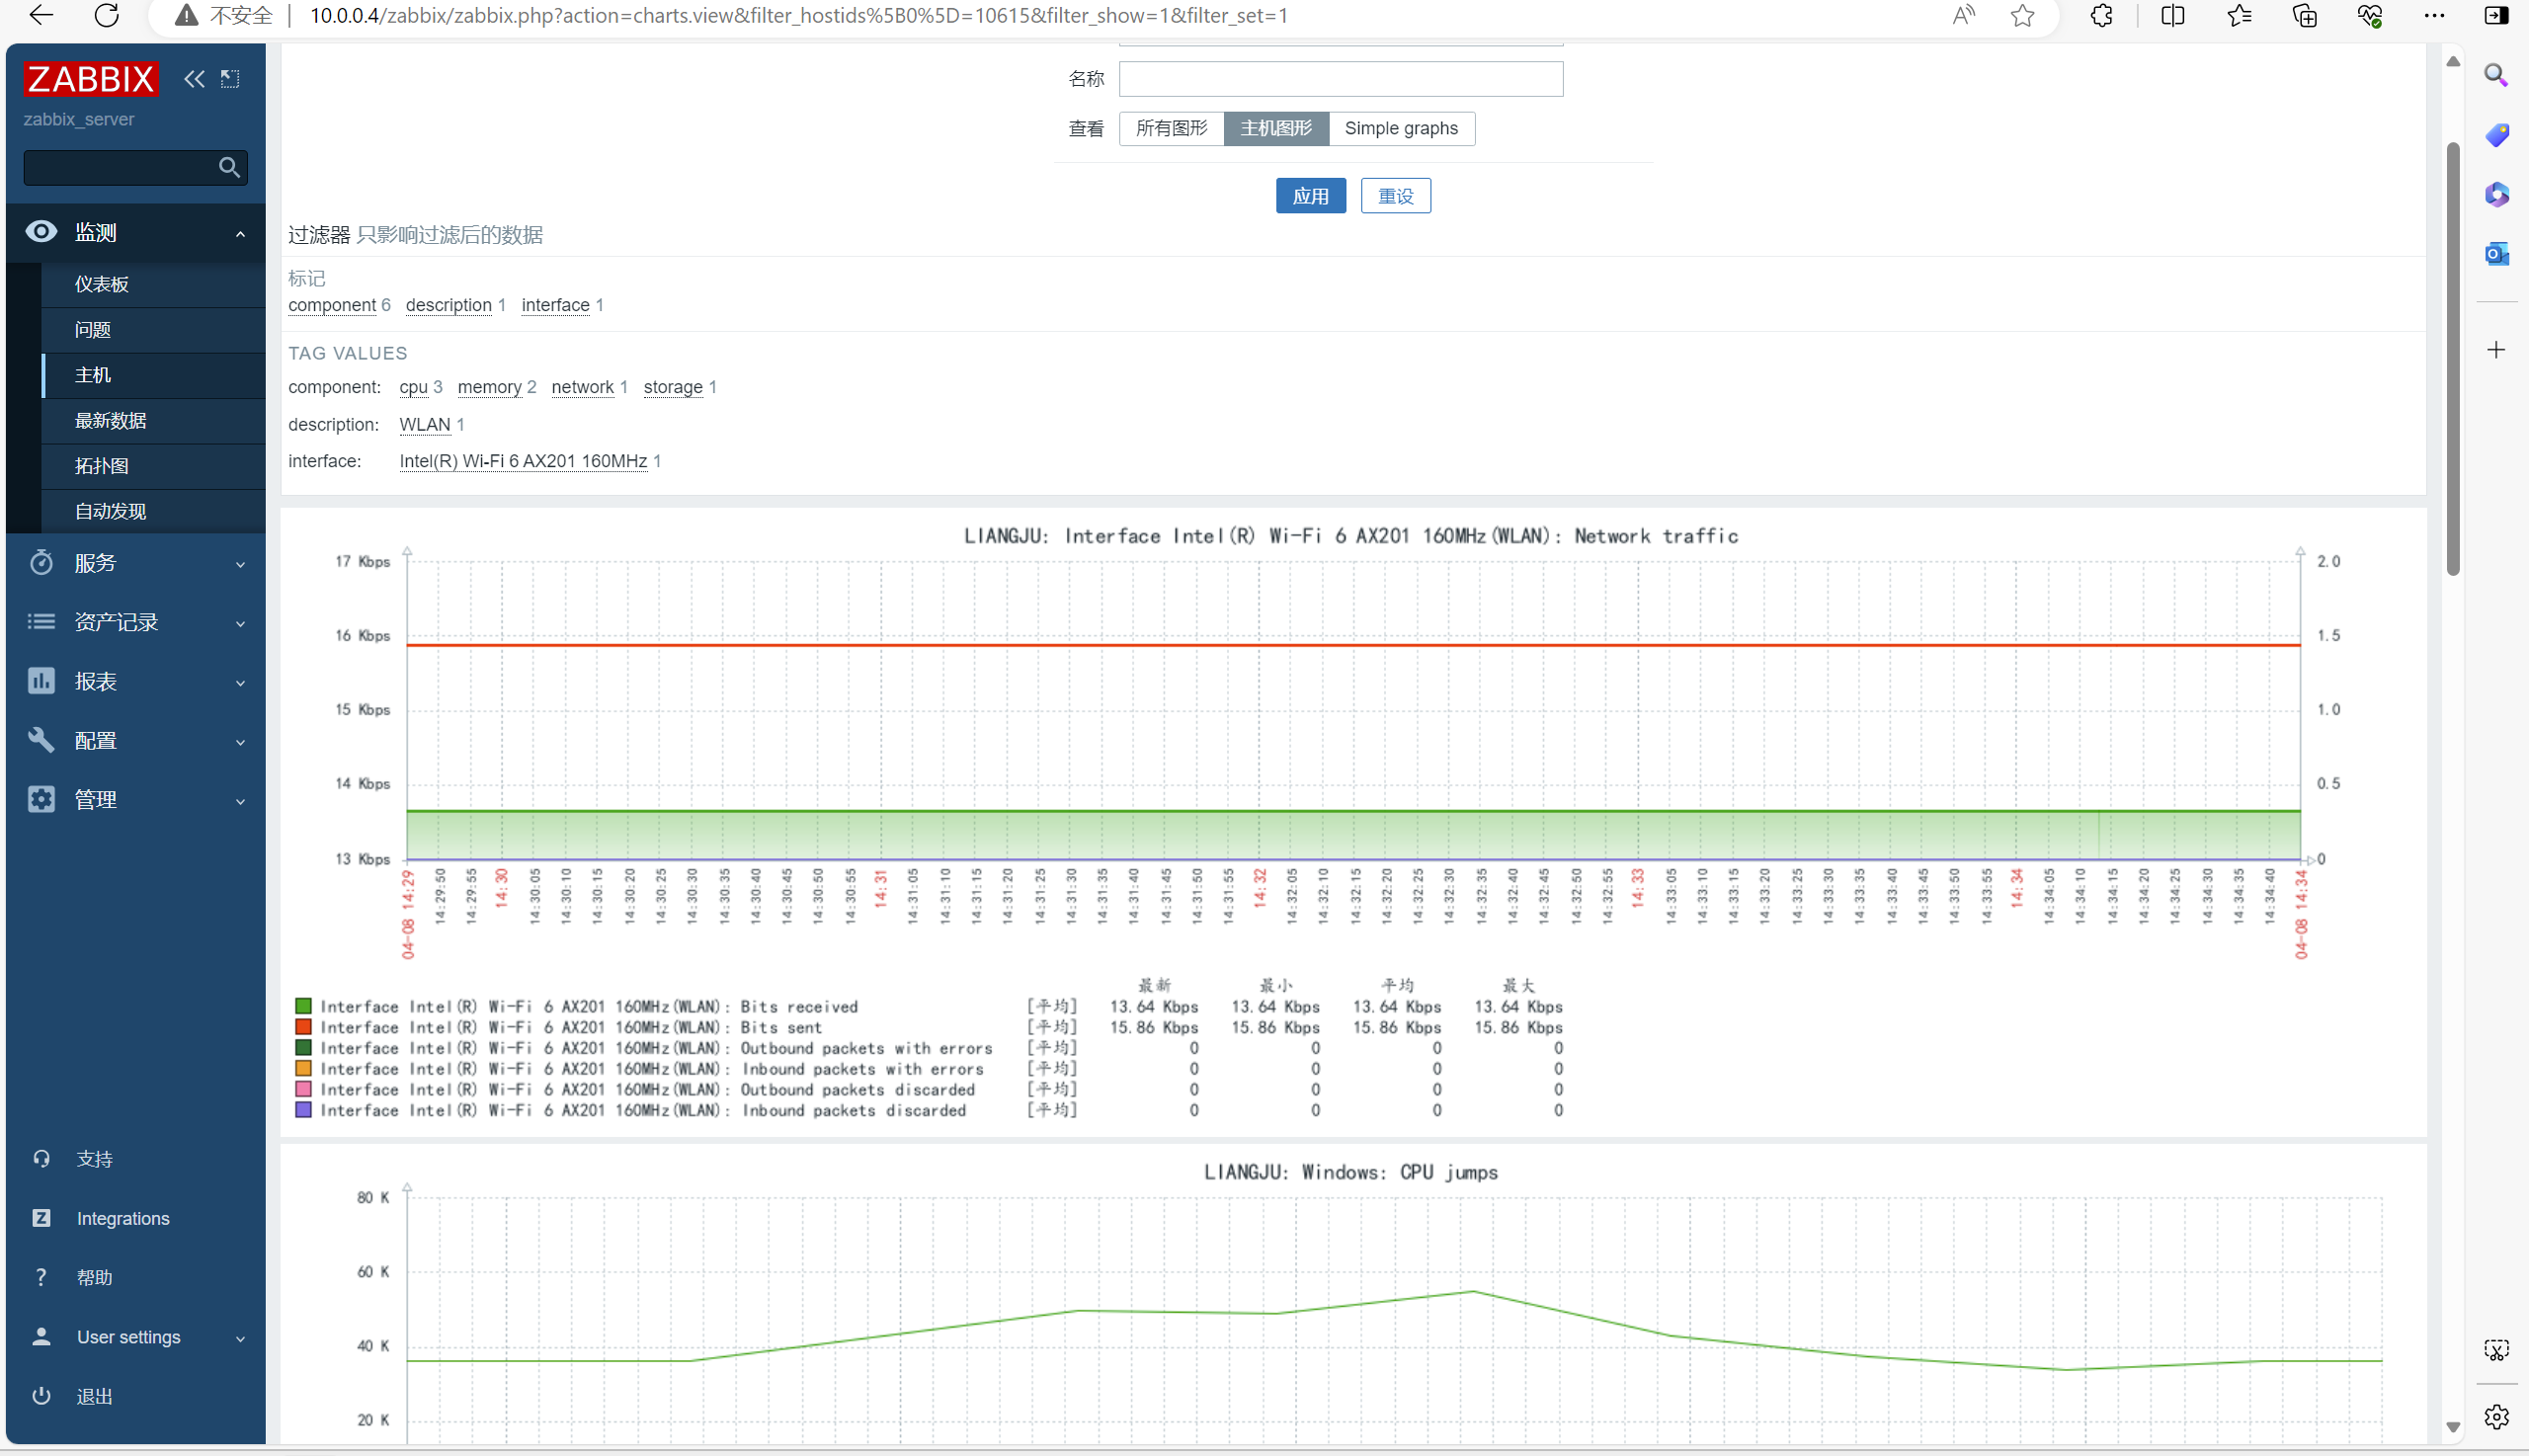
查看监控的图形数据
监控nginx
安装和配置nginx
[11:11:53 root@10 ~]#yum install nginx -y
[11:11:53 root@10 ~]#cat /etc/nginx/nginx.conf

http {
server{
        location / {
        }

	location = /status{
	stub_status;
	}

    }
}
验证:
[11:13:44 root@10 ~]#curl 127.0.0.1/status
Active connections: 1
server accepts handled requests
 4 4 4
Reading: 0 Writing: 1 Waiting: 0
添加监控的主机并关联模板
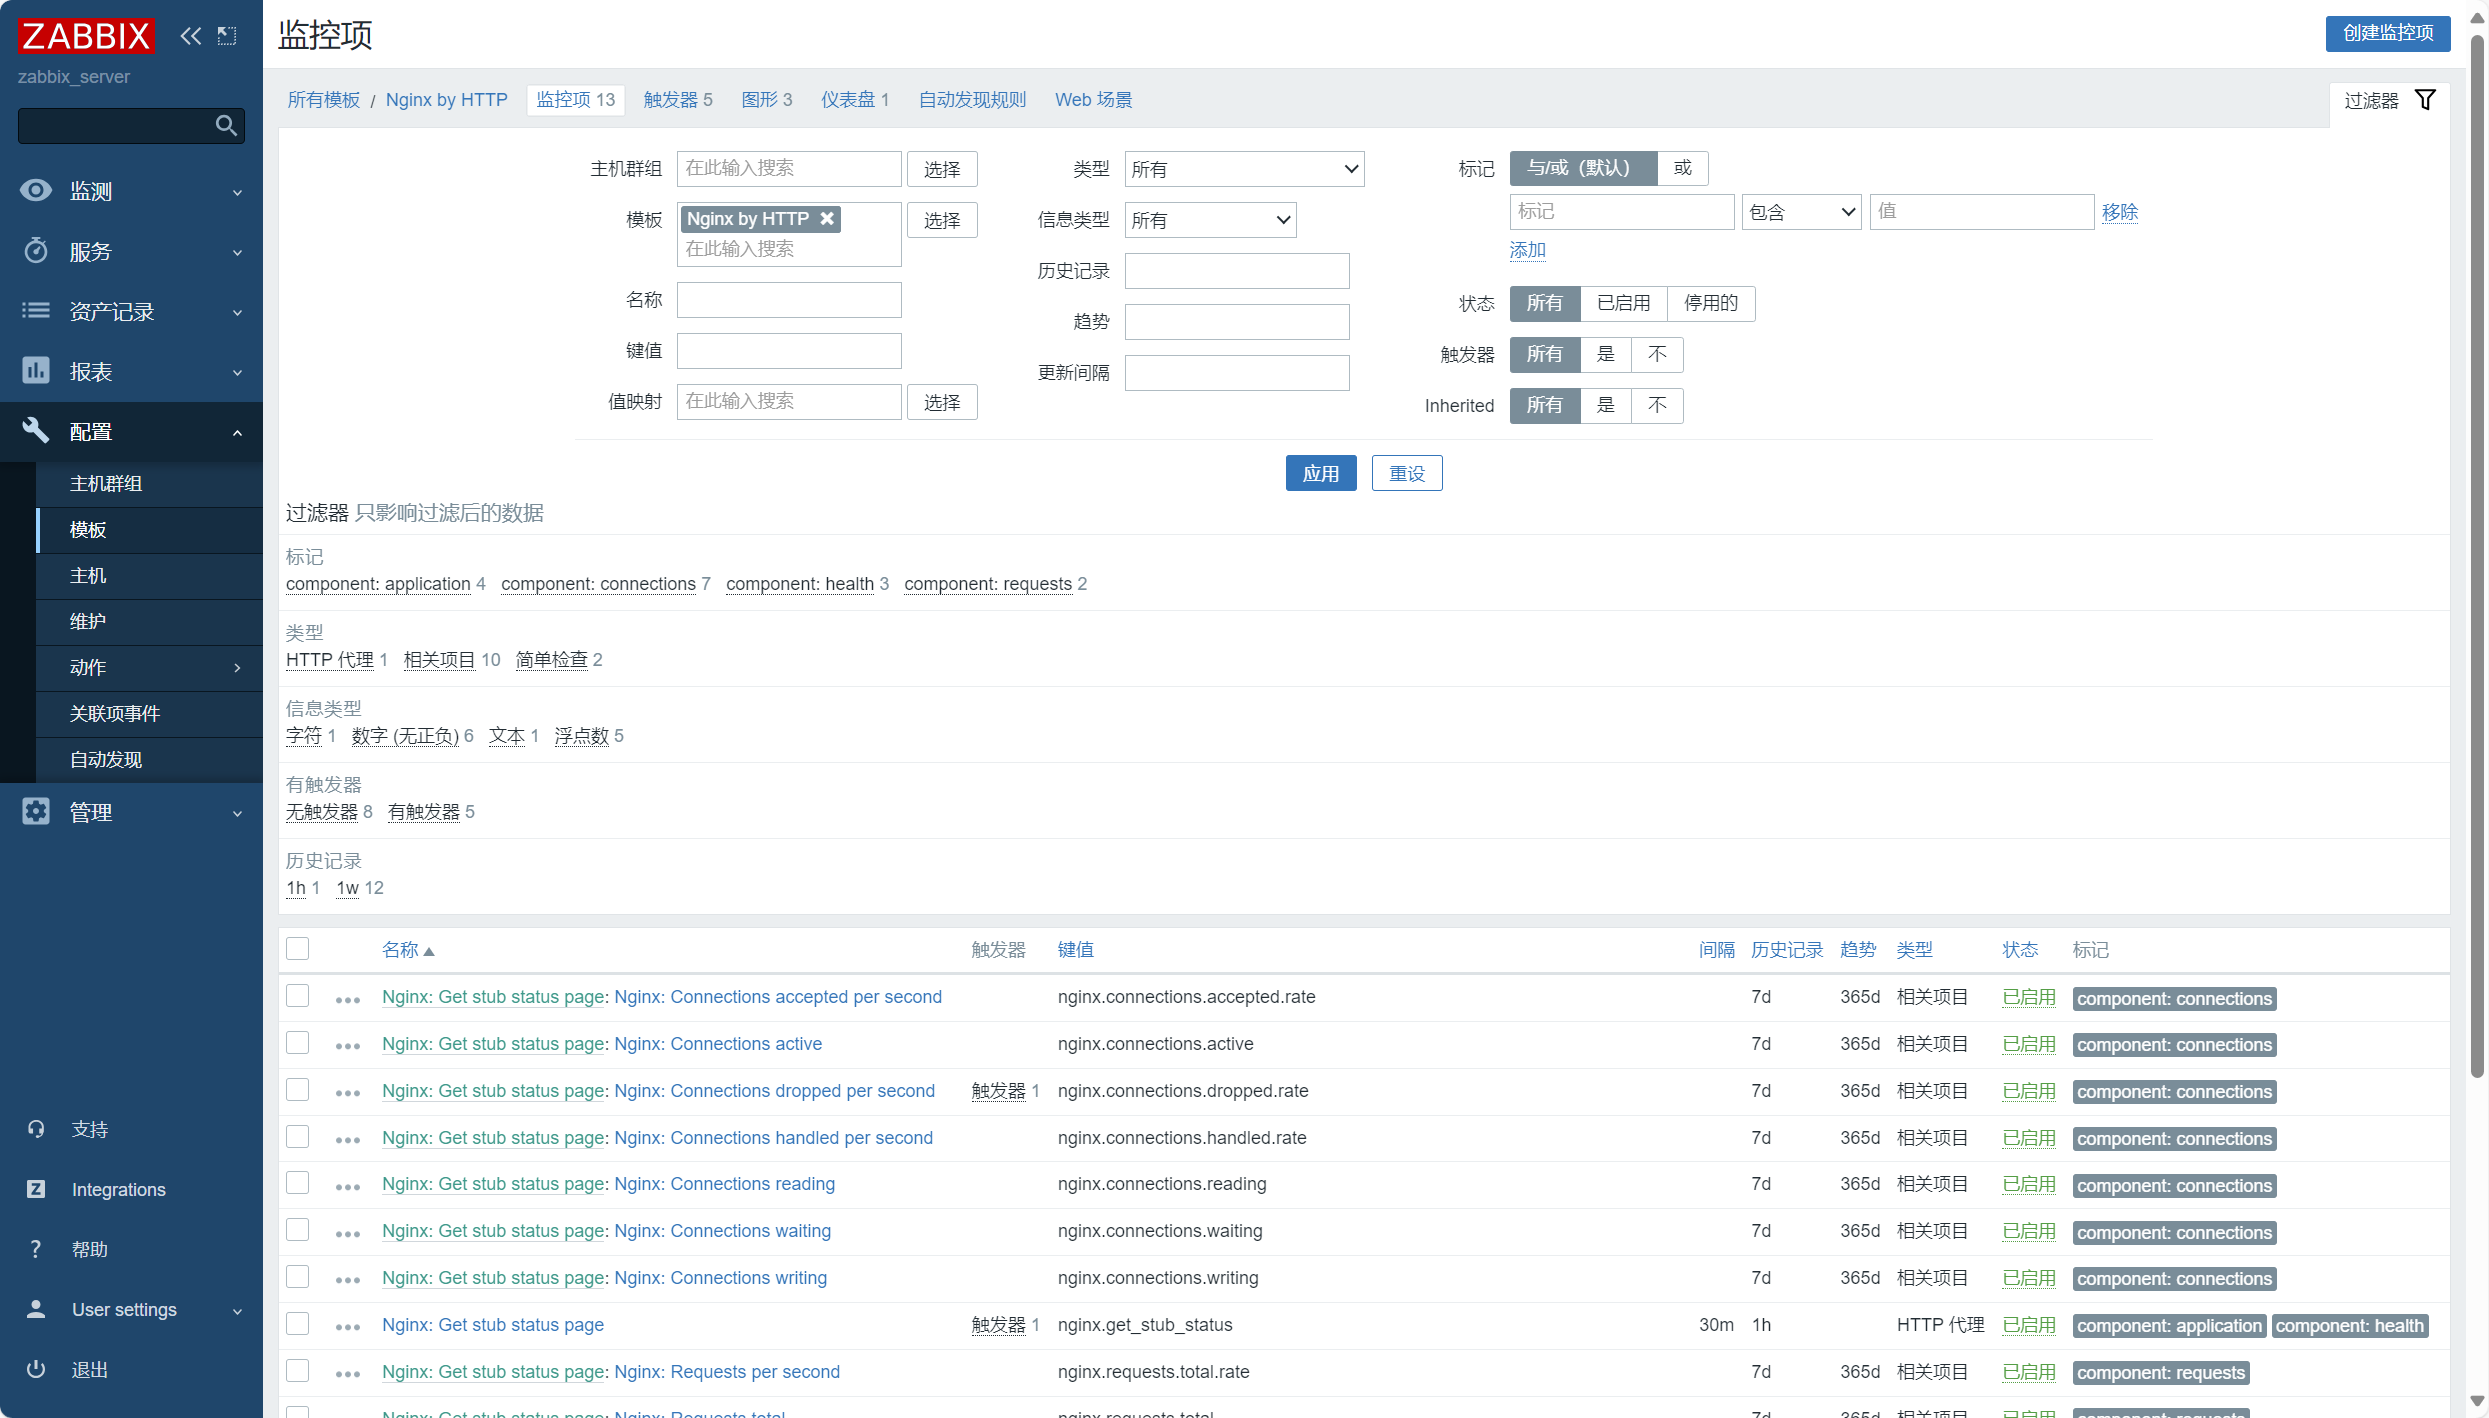
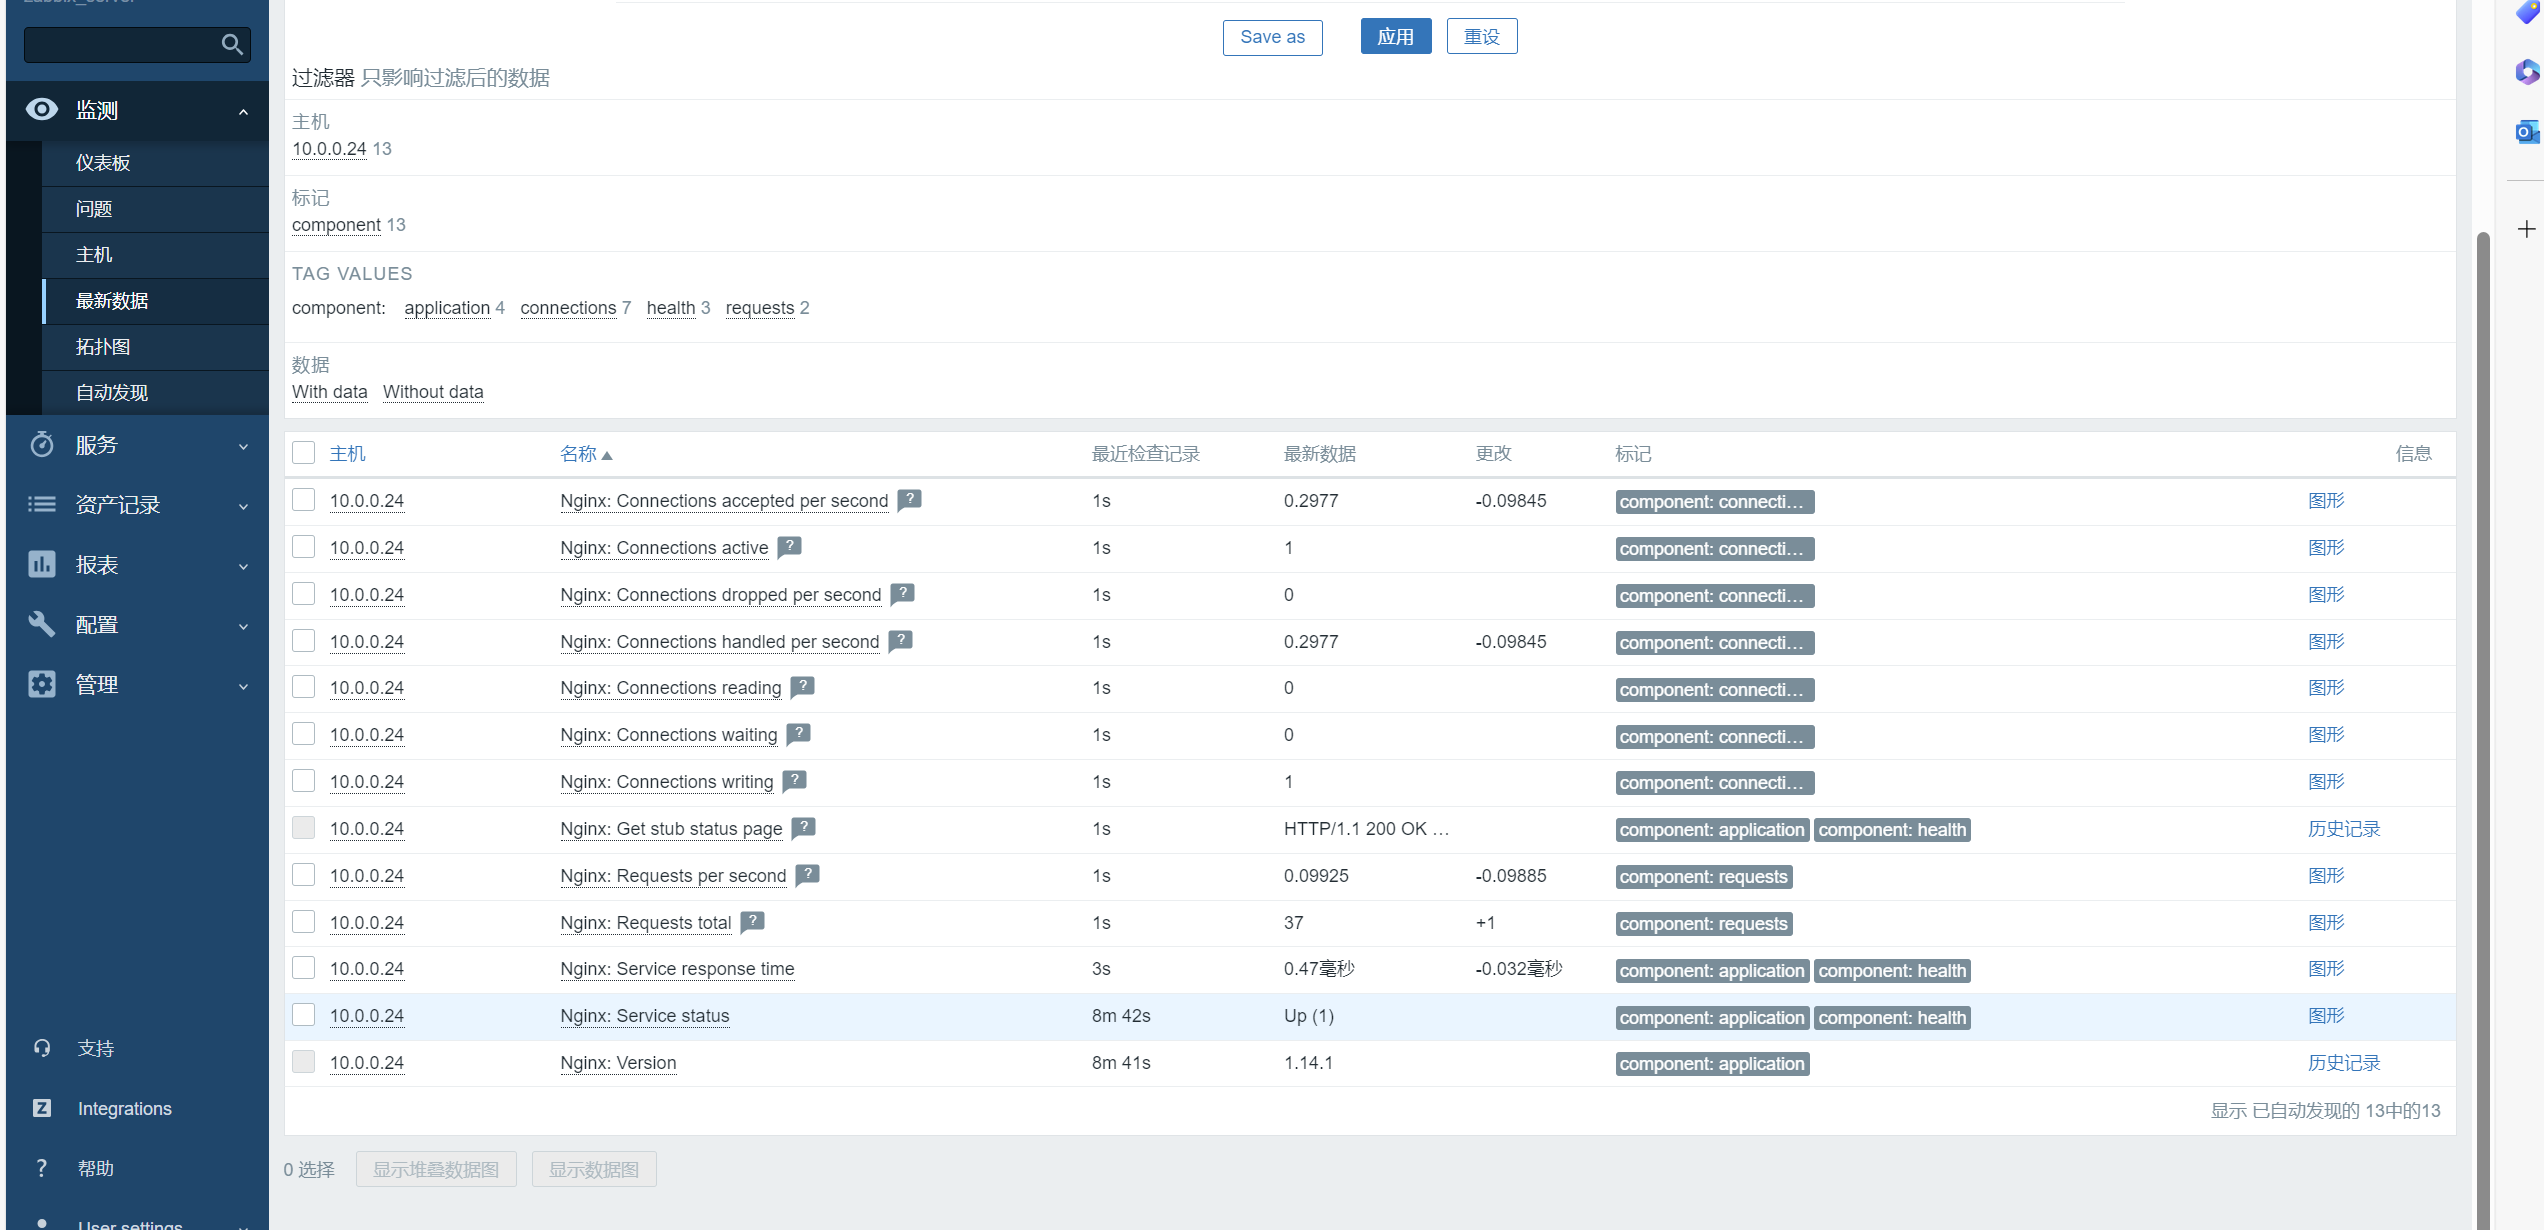
查看监控数据
5、完成1键安装zabbix agent脚本,可以用于ubuntu系统。
二进制包安装zabbix zgent6.x的 脚本
zabbix-server:10.0.0.4
#!/bin/bash

server=10.0.0.4
function sys_install(){
  grep "Kernel" /etc/issue &> /dev/null
  if [ $? -eq 0 ];then
 	   rpm -Uvh https://repo.zabbix.com/zabbix/6.4/rhel/8/x86_64/zabbix-release-6.4-1.el8.noarch.rpm
           dnf clean all
           dnf install zabbix-agent -y
	       HOST_IP=`ifconfig  ens160 | grep -w inet | awk '{print $2}'`
           sed -i "s/Hostname=Zabbix server/Hostname=${HOST_IP}/g" /etc/zabbix/zabbix_agentd.conf
	   sed -i "s/Server=127.0.0.1/Server=${server}/g" /etc/zabbix/zabbix_agentd.conf
	   systemctl enable zabbix-agent
       systemctl restart zabbix-agent
  fi

  grep "Ubuntu" /etc/issue &> /dev/null
  if [ $? -eq 0 ];then
	wget https://repo.zabbix.com/zabbix/6.4/ubuntu/pool/main/z/zabbix-release/zabbix-release_6.4-1+ubuntu20.04_all.deb
       dpkg -i zabbix-release_6.4-1+ubuntu20.04_all.deb
       apt update
       apt install zabbix-agent -y
       HOST_IP=`ifconfig  ens160 | grep -w inet | awk '{print $2}'`
       sed -i "s/Hostname=/Hostname=${HOST_IP}/g" /etc/zabbix/zabbix_agentd.conf
       sed -i "s/Server=127.0.0.1/Server=${server}/g" /etc/zabbix/zabbix_agentd.conf
       systemctl restart zabbix-agent
       systemctl enable zabbix-agent
  fi
}

main(){
  sys_install
}

main

验证:
[15:25:35 root@10 ~]#grep "^[a-Z]" /etc/zabbix/zabbix_agentd.conf
PidFile=/run/zabbix/zabbix_agentd.pid
LogFile=/var/log/zabbix/zabbix_agentd.log
LogFileSize=0
Server=10.0.0.4
ServerActive=127.0.0.1
Hostname=10.0.0.200
Include=/etc/zabbix/zabbix_agentd.d/*.conf
[15:26:33 root@10 ~]#ss -ntl
State     Recv-Q    Send-Q       Local Address:Port        Peer Address:Port   Process
LISTEN    0         128                0.0.0.0:10050            0.0.0.0:*
LISTEN    0         128                0.0.0.0:22               0.0.0.0:*
LISTEN    0         128                   [::]:10050               [::]:*
LISTEN    0         128                   [::]:22                  [::]:*
6、完成1键脚本,可以基于zabbix api添加zabbix agent到zabbix web。
通过脚本调用API快速添加:
[root@zabbix-server ~]# vi zabbix-agent-api.sh
#!/bin/bash

IP="
10.0.0.14
10.0.0.24
10.0.0.34
"

for node_ip in ${IP};do
 curl -s -X POST -H 'Content-Type:application/json' -d '
 {
     "jsonrpc": "2.0",
     "method": "host.create",
     "params": {
          "host": "'${node_ip}'",
          "name": "magedu-tomcat_'${node_ip}'",
          "proxy_hostid": "10267", 代理id
         "interfaces": [
             {
                 "type": 1,
                 "main": 1,
                 "useip": 1,
                 "ip": "'${node_ip}'",
                 "dns": "",
                 "port": "10050"
             }
         ],
         "groups": [
             {
                 "groupid": "15"   组ID
             }
         ],
         "templates": [
             {
                 "templateid": "10264"    模板ID
             }
         ]
     },
     "auth": "22c0801ef8aed78b14ee8f7848165a27",
     "id": 1
 }' http://10.0.0.4/zabbix/api_jsonrpc.php | python -m json.tool
done

 浙公网安备 33010602011771号