Promethues监控k8s项目
一.安装promethues
1.创建新的命名空间 monitor,存储prometheus相关资源
vim prometheus-namespace.yaml

apiVersion: v1
kind: Namespace
metadata:
  name: monitor


cat <<EOF > prometheus-namespace.yaml
apiVersion: v1
kind: Namespace
metadata:
  name: monitor
EOF
2.创建配置文件, 使用configmap 的形式保存
prometheus-configmap.yaml

apiVersion: v1
kind: ConfigMap
metadata:
  name: prometheus-config
  namespace: monitor
data:
  prometheus.yml: |
    global:
      scrape_interval: 15s
      evaluation_interval: 15s
    scrape_configs:
    - job_name: 'prometheus'
      static_configs:
      - targets: ['localhost:9090']

#global: 全局配置部分,包含了全局的配置参数。

#scrape_interval: 设置了 Prometheus 对目标进行抓取的时间间隔,这里设置为每 15 秒抓取一次。

#evaluation_interval: 设置了 Prometheus 对规则进行评估的时间间隔,这里设置为每 15 秒进行一次评估。

#scrape_configs: 抓取配置部分,用于定义 Prometheus 抓取的目标配置。

#- job_name: 'prometheus': 定义了一个名为 prometheus 的作业。

#static_configs: 静态配置,用于指定需要抓取的目标列表。

#- targets: ['localhost:9090']: 指定了一个目标,即 Prometheus 自身的地址 localhost:9090。这意味着 Prometheus 将定期抓取自己的指标数据。
3.Prometheus的资源文件 会创新Prometheus数据存储权限问题, 因为Prometheus内部使用nobody启动进程, 挂载数据目录后权限为root, 因此使用InitContainer 进行
vim prometheus-deployment.yaml

# 定义一个 Deployment 资源,用于部署 Prometheus 监控系统
apiVersion: apps/v1
kind: Deployment
metadata:
  # 指定 Deployment 的名称为 prometheus
  name: prometheus
  # 指定 Deployment 所属的命名空间为 monitor
  namespace: monitor
  # 为 Deployment 添加标签,标记为 app: prometheus
  labels:
    app: prometheus
spec:
  # 指定 Deployment 中 Pod 的选择器
  selector:
    matchLabels:
      app: prometheus
  # 定义 Deployment 中 Pod 的模板
  template:
    metadata:
      # 为 Pod 添加标签,标记为 app: prometheus
      labels:
        app: prometheus
    spec:
      # 指定 Pod 使用的服务账户为 prometheus
      serviceAccountName: prometheus
      # 指定 Pod 部署到具有 app: prometheus 标签的节点上
      nodeSelector:
        app: prometheus
      # 定义初始化容器,用于修改挂载到 Pod 中的目录权限
      initContainers:
      - name: "change-permission-of-directory"
        image: busybox
        # 指定初始化容器执行的命令
        command: ["/bin/sh"]
        args: ["-c", "chown -R 65534:65534 /prometheus"]
        # 设置初始化容器的安全上下文,允许特权模式运行
        securityContext:
          privileged: true
        # 挂载 Pod 中的目录到初始化容器中进行权限修改
        volumeMounts:
        - mountPath: "/etc/prometheus"
          name: config-volume
        - mountPath: "/prometheus"
          name: data
      # 定义主容器,即 Prometheus 容器
      containers:
      - image: prom/prometheus:v2.19.2
        name: prometheus
        # 指定 Prometheus 容器的启动参数
        args:
        - "--config.file=/etc/prometheus/prometheus.yml"
        - "--storage.tsdb.path=/prometheus"  # 指定 tsdb 数据路径
        - "--web.enable-lifecycle"  # 支持热更新
        - "--web.console.libraries=/usr/share/prometheus/console_libraries"
        - "--web.console.templates=/usr/share/prometheus/consoles"
        # 暴露 Prometheus 容器的端口
        ports:
        - containerPort: 9090
          name: http
        # 挂载 Pod 中的目录到 Prometheus 容器中
        volumeMounts:
        - mountPath: "/etc/prometheus"
          name: config-volume
        - mountPath: "/prometheus"
          name: data
        # 设置 Prometheus 容器的资源请求和限制
        resources:
          requests:
            cpu: 100m
            memory: 512Mi
          limits:
            cpu: 100m
            memory: 512Mi
      # 定义 Pod 使用的卷
      volumes:
      - name: data
        hostPath:
          path: /data/prometheus/
      - configMap:
          name: prometheus-config
        name: config-volume
4.RBAC允许prometheus调用k8s api做服务发现进行抓取指标
vim prometheus-rbac.yaml

# 创建一个名为 prometheus 的服务账户,指定其所属的命名空间为 monitor。
apiVersion: v1
kind: ServiceAccount
metadata:
  name: prometheus
  namespace: monitor

---
# 创建一个名为 prometheus 的集群角色,用于定义 Prometheus 相关资源的访问权限。
apiVersion: rbac.authorization.k8s.io/v1
kind: ClusterRole
metadata:
  name: prometheus
# 规则部分定义了可以访问的资源和操作。
rules:
# 允许获取、列出和监视节点、服务、端点、Pod 和节点代理资源。
- apiGroups:
  - ""
  resources:
  - nodes
  - services
  - endpoints
  - pods
  - nodes/proxy
  verbs:
  - get
  - list
  - watch
# 允许获取、列出和监视扩展 API 组的 Ingress 资源。
- apiGroups:
  - "extensions"
  resources:
    - ingresses
  verbs:
  - get
  - list
  - watch
# 允许获取节点指标和 ConfigMap 资源。
- apiGroups:
  - ""
  resources:
  - configmaps
  - nodes/metrics
  verbs:
  - get
# 允许访问非资源 URL /metrics。
- nonResourceURLs:
  - /metrics
  verbs:
  - get

---
# 创建一个名为 prometheus 的集群角色绑定,将 prometheus 角色绑定到 prometheus 服务账户上。
apiVersion: rbac.authorization.k8s.io/v1beta1
kind: ClusterRoleBinding
metadata:
  name: prometheus
# roleRef 指定要绑定的角色信息。
roleRef:
  apiGroup: rbac.authorization.k8s.io
  kind: ClusterRole
  name: prometheus
# subjects 定义了被绑定的对象,这里是 prometheus 服务账户。
subjects:
- kind: ServiceAccount
  name: prometheus
  namespace: monitor
5.提供Service
prometheus-svc.yaml

apiVersion: v1
kind: Service
metadata:
  name: prometheus
  namespace: monitor
  labels:
    app: prometheus
spec:
  selector:
    app: prometheus
  type: NodePort
  ports:
    - name: web
      port: 9090
      targetPort: http
6.部署对应版本的helm
| Helm 版本 |
支持的 Kubernetes 版本 |
| 3.12.x |
1.27.x - 1.24.x |
| 3.11.x |
1.26.x - 1.23.x |
| 3.10.x |
1.25.x - 1.22.x |
| 3.9.x |
1.24.x - 1.21.x |
| 3.8.x |
1.23.x - 1.20.x |
| 3.7.x |
1.22.x - 1.19.x |
| 3.6.x |
1.21.x - 1.18.x |
| 3.5.x |
1.20.x - 1.17.x |
| 3.4.x |
1.19.x - 1.16.x |
| 3.3.x |
1.18.x - 1.15.x |
| 3.2.x |
1.18.x - 1.15.x |
| 3.1.x |
1.17.x - 1.14.x |
| 3.0.x |
1.16.x - 1.13.x |
| 2.16.x |
1.16.x - 1.15.x |
| 2.15.x |
1.15.x - 1.14.x |
| 2.14.x |
1.14.x - 1.13.x |
| 2.13.x |
1.13.x - 1.12.x |
| 2.12.x |
1.12.x - 1.11.x |
| 2.11.x |
1.11.x - 1.10.x |
| 2.10.x |
1.10.x - 1.9.x |
| 2.9.x |
1.10.x - 1.9.x |
| 2.8.x |
1.9.x - 1.8.x |
| 2.7.x |
1.8.x - 1.7.x |
| 2.6.x |
1.7.x - 1.6.x |
| 2.5.x |
1.6.x - 1.5.x |
| 2.4.x |
1.6.x - 1.5.x |
| 2.3.x |
1.5.x - 1.4.x |
| 2.2.x |
1.5.x - 1.4.x |
| 2.1.x |
1.5.x - 1.4.x |
| 2.0.x |
1.4.x - 1.3.x |
wget https://get.helm.sh/helm-v3.4.2-linux-amd64.tar.gz
tar xf
cd linux-amd64/
mv helm /usr/local/bin/
echo $PATH
echo 'export PATH="/usr/local/bin:$PATH"' >> ~/.bashrc
source ~/.bashrc
helm --help
7.部署ingress
helm repo add ingress-nginx  https://kubernetes.github.io/ingress-nginx
helm search repo ingress-nginx -l
helm pull ingress-nginx/ingress-nginx  --version 4.0.19
8.查看指标
    curl <http://10.244.1.132:9090/metrics>

    tsdb(Time Series Database)

    其中#号开头的两行分别为:

    * HELP 开头说明该行为指标的帮助信息, 通常结束指标的含义,
    * TYPE 执行命令指标的类型

      * counter 计数器
      * guage 测量器
      * histogram 柱状图
      * summary 采样点分位图统计

    其中为# 开头的每一行表示当前采集到的一个监控样本

    * promhttp_metric_handler_requests_total表明了当前指标的名称
    * 大括号中的标签则反映了当前样本的一些特征和维度
    * 浮点数则是该监控样本的具体值。

    $ kubectl -n kube-system get po -owide|grep coredns
    coredns-58cc8c89f4-nshx2             1/1     Running   6          22d   10.244.0.20
    coredns-58cc8c89f4-t9h2r             1/1     Running   7          22d   10.244.0.21

    $ curl 10.244.0.20:9153/metrics
9.修改target配置,监控coreDNS
vim prometheus-configmap.yaml

...添加
    - job_name: 'coredns'
      static_configs:
      - targets: ['10.96.0.10:9153']

$ kubectl apply -f prometheus-configmap.yaml

# 重建pod生效
$ kubectl -n monitor delete po prometheus-dcb499cbf-fxttx
10.监控 kube-apiserver
$ kubectl get svc
NAME         TYPE        CLUSTER-IP   EXTERNAL-IP   PORT(S)   AGE
kubernetes   ClusterIP   10.96.0.1    <none>        443/TCP   23d


$ cat prometheus-configmap.yaml
...
    - job_name: 'kubernetes-apiserver'
      static_configs:
      - targets: ['10.96.0.1']
      scheme: https
      tls_config:
        ca_file: /var/run/secrets/kubernetes.io/serviceaccount/ca.crt
        insecure_skip_verify: true
      bearer_token_file: /var/run/secrets/kubernetes.io/serviceaccount/token
11.监控集群节点基础指标node_exporter
node_exporter [https://github.com/prometheus/node_exporter](https://github.com/prometheus/node_exporter)

分析

* 每个节点都添加节点的容忍配置
* 挂载需要监控, 因此可以使用Daemonset类型管理node_export
* 挂载宿主机中的系统文件信息

node-export.yaml

apiVersion: apps/v1
kind: DaemonSet
metadata:
  name: node-exporter                  # 定义 DaemonSet 的名称为 node-exporter
  namespace: monitor                  # 将 DaemonSet 部署到 monitor 命名空间中
  labels:                             # 为 DaemonSet 添加标签,标签名为 app,值为 node-exporter
    app: node-exporter
spec:                                # 定义 DaemonSet 的规格
  selector:                          # 定义如何选择将要控制的 Pod
    matchLabels:                     # 使用标签选择器选择与之匹配的 Pod
      app: node-exporter
  template:                          # 定义创建 Pod 所用的模板
    metadata:                        # 定义 Pod 的元数据
      labels:                        # 为 Pod 添加标签,标签名为 app,值为 node-exporter
        app: node-exporter
    spec:                            # 定义 Pod 的规格
      hostPID: true                  # 允许 Pod 使用宿主机的 PID 命名空间
      hostIPC: true                  # 允许 Pod 使用宿主机的 IPC 命名空间
      hostNetwork: true              # 使用宿主机的网络命名空间
      nodeSelector:                  # 选择在哪些节点上部署 Pod
        kubernetes.io/os: linux     # 选择运行 Linux 操作系统的节点
      containers:                    # 定义 Pod 中的容器列表
      - name: node-exporter          # 容器的名称为 node-exporter
        image: prom/node-exporter:v1.0.1  # 使用 prom/node-exporter:v1.0.1 镜像
        args:                        # 定义容器启动时的命令行参数
        - --web.listen-address=$(HOSTIP):9100  # 指定 Node Exporter 监听的地址和端口
        - --path.procfs=/host/proc  # 指定主机 proc 文件系统的路径
        - --path.sysfs=/host/sys    # 指定主机 sys 文件系统的路径
        - --path.rootfs=/host/root  # 指定主机 root 文件系统的路径
        - --collector.filesystem.ignored-mount-points=^/(dev|proc|sys|var/lib/docker/.+)($|/)  # 定义忽略的挂载点
        - --collector.filesystem.ignored-fs-types=^(autofs|binfmt_misc|cgroup|configfs|debugfs|devpts|devtmpfs|fusectl|hugetlbfs|mqueue|overlay|proc|procfs|pstore|rpc_pipefs|securityfs|sysfs|tracefs)$  # 定义忽略的文件系统类型
        ports:                       # 定义容器暴露的端口
        - containerPort: 9100        # 容器监听的端口号为 9100
        env:                         # 定义容器的环境变量
        - name: HOSTIP               # 环境变量的名称为 HOSTIP
          valueFrom:                 # 环境变量的值来源于
            fieldRef:                # 字段引用
              fieldPath: status.hostIP  # Pod 的主机 IP 地址
        resources:                   # 定义容器的资源限制和请求
          requests:                  # 容器的资源请求
            cpu: 150m                # 请求 150 毫核的 CPU
            memory: 180Mi            # 请求 180 MiB 的内存
          limits:                    # 容器的资源限制
            cpu: 150m                # 限制 150 毫核的 CPU
            memory: 180Mi            # 限制 180 MiB 的内存
        securityContext:             # 定义容器的安全上下文
          runAsNonRoot: true         # 以非 root 用户身份运行容器
          runAsUser: 65534           # 指定容器运行的用户 ID
        volumeMounts:                # 定义容器挂载的卷列表
        - name: proc                 # 卷的名称为 proc
          mountPath: /host/proc      # 挂载到容器的 /host/proc 路径
        - name: sys                  # 卷的名称为 sys
          mountPath: /host/sys       # 挂载到容器的 /host/sys 路径
        - name: root                 # 卷的名称为 root
          mountPath: /host/root      # 挂载到容器的 /host/root 路径
          mountPropagation: HostToContainer  # 指定挂载传播方式为从主机到容器
          readOnly: true             # 指定卷为只读
      tolerations:                   # 定义 Pod 的容忍策略
      - operator: "Exists"           # 定义存在性容忍策略,允许该 Pod 在带有任何污点的节点上运行
      volumes:                       # 定义 Pod 使用的卷列表
      - name: proc                   # 卷的名称为 proc
        hostPath:                    # 主机路径卷配置
          path: /proc                # 主机路径为 /proc
      - name: dev                    # 卷的名称为 dev
        hostPath:                    # 主机路径卷配置
          path: /dev                 # 主机路径为 /dev
      - name: sys                    # 卷的名称为 sys
        hostPath:                    # 主机路径卷配置
          path: /sys                 # 主机路径为 /sys
      - name: root                   # 卷的名称为 root
        hostPath:                    # 主机路径卷配置
          path: /                    # 主机路径为 /

$ kubectl create -f node-exporter.yaml

$ kubectl -n monitor get po
12.Prometheus的服务发现与Relabeling
之前已经给Prometheus配置了RBAC,有读取node的权限,因此Prometheus可以去调用Kubernetes API获取node信息,所以Prometheus通过与 Kubernetes API 集成,提供了内置的服务发现分别是:`Node`、`Service`、`Pod`、`Endpoints`、`Ingress`
查看 Target 的Label列,可以发现, 每个target 对应会有很多 Before Relabeing 的标签, 这些_开头的label 是系统内部使用, 不会存储到样本的数据里, 但是, 我们再查看数据的时候, 可以发现, 每个数据都有两个默认的label
```yaml
prometheus_notifications_dropped_total{instance="localhost:9090",job="prometheus"}
```
instance 的值其实则取自于 ****address** **
这种发送在采集样本数据之前的, 对Ttarget实例的标签进行重写的机制在Prometheus被称为Relabeling
因此, 利用relabeing 的能力, 只需要将__**address__替换成node_exporter的服务地址即可**
- job_name: 'kubernetes-sd-node-exporter'
kubernetes_sd_configs:
- role: node
relabel_configs:
- source_labels: [__address__]
regex: '(.*):10250'
replacement: '${1}:9100'
target_label: __address__
action: replace
#当你在 Prometheus 的配置中使用 __address__ 标签时,Prometheus 会在运行时自动将该标签替换为实际的目标地址。在 Kubernetes 环境下,当 Prometheus 使用 Kubernetes 服务发现机制来发现 Node Exporter 实例时,__address__ 标签会被替换为 Node Exporter 的服务地址,这样 Prometheus 就知道要从哪里获取指标数据了。
#换句话说,你不需要手动修改配置文件中的 __address__ 标签,因为 Prometheus 会自动处理这一部分。只需确保 Prometheus 的配置正确地使用了 Kubernetes 服务发现,并配置了正确的目标标签,Prometheus 就能够自动获取到 Node Exporter 的服务地址,从而正确地采集指标数据。
再次更新Prometheus 服务之后, 查看targets列表及node-exporter提供的指标
13.cadvisor 监控指标的采集
`cAdvisor` 的指标访问路径为 `https://10.96.0.1/api/v1/nodes/<node_name>/proxy/metrics`
#kubectl get svc 的地址

- job_name: 'kubernetes-sd-cadvisor'
      kubernetes_sd_configs:
        - role: node
      scheme: https
      tls_config:
        ca_file: /var/run/secrets/kubernetes.io/serviceaccount/ca.crt
        insecure_skip_verify: true
      bearer_token_file: /var/run/secrets/kubernetes.io/serviceaccount/token
      relabel_configs:
      - target_label: __address__
        replacement: 10.96.0.1
      - source_labels: [__meta_kubernetes_node_name]
        regex: (.+)
        target_label: __metrics_path__
        replacement: /api/v1/nodes/${1}/proxy/metrics/cadvisor

cadvisor 监控 pod
14.集群Service 服务的监控指标采集
- job_name: 'kubernetes-sd-endpoints'
      kubernetes_sd_configs:
      - role: endpoints
      relabel_configs:
      - source_labels: [__meta_kubernetes_service_annotation_prometheus_io_scrape]
        action: keep
        regex: true
      - source_labels: [__meta_kubernetes_service_annotation_prometheus_io_path]
        action: replace
        target_label: __metrics_path__
        regex: (.+)
      - source_labels: [__address__, __meta_kubernetes_service_annotation_prometheus_io_port]
        action: replace
        target_label: __address__
        regex: ([^:]+)(?::\\d+)?;(\\d+)
        replacement: $1:$2
      - source_labels: [__meta_kubernetes_namespace]
        action: replace
        target_label: kubernetes_namespace
      - source_labels: [__meta_kubernetes_service_name]
        action: replace
        target_label: kubernetes_name
      - source_labels: [__meta_kubernetes_pod_name]
        action: replace
        target_label: kubernetes_pod_name

那么就可以实现target的Before Relabeling 中若存在`__keep_this_service__`,且值为`true`
的话,则会加入到kubernetes-endpoints这个target中,否则就会被删除。
15.kube-state-metrics 监控
已经有了cadvisor,容器运行的指标已经可以获取到,但是下面这种情况却无能为力:

* 调度了多少个replicas , 现在可用的有几个
* 多少个Pod 是running/stopped/terminated状态?
* Pod 重启了多少次

而这些则是kube-state-metrics提供的内容,它基于client-go开发,轮询Kubernetes API,并将Kubernetes的结构化信息转换为metrics。因此,需要借助于`kube-state-metrics`
来实现

部署: [https://github.com/kubernetes/kube-state-metrics#kubernetes-deployment](https://github.com/kubernetes/kube-state-metrics#kubernetes-deployment)


$ wget <https://github.com/kubernetes/kube-state-metrics/archive/v1.9.7.tar.gz>

$ tar zxf v1.9.7.tar.gz
$ cp -r  kube-state-metrics-1.9.7/examples/standard/ .

$ ll standard/
total 20
-rw-r--r-- 1 root root  377 Jul 24 06:12 cluster-role-binding.yaml
-rw-r--r-- 1 root root 1651 Jul 24 06:12 cluster-role.yaml
-rw-r--r-- 1 root root 1069 Jul 24 06:12 deployment.yaml
-rw-r--r-- 1 root root  193 Jul 24 06:12 service-account.yaml
-rw-r--r-- 1 root root  406 Jul 24 06:12 service.yaml

# 替换namespace为monitor
$ sed -i 's/namespace: kube-system/namespace: monitor/g' standard/*

$ kubectl create -f standard/
clusterrolebinding.rbac.authorization.k8s.io/kube-state-metrics created
clusterrole.rbac.authorization.k8s.io/kube-state-metrics created
deployment.apps/kube-state-metrics created
serviceaccount/kube-state-metrics created
service/kube-state-metrics created

如何添加到Prometheus 监控target 中
$ cat standard/service.yaml
apiVersion: v1
kind: Service
metadata:
  annotations:
    prometheus.io/scrape: "true"
    prometheus.io/port: "8080"
  labels:
    app.kubernetes.io/name: kube-state-metrics
    app.kubernetes.io/version: v1.9.7
  name: kube-state-metrics
  namespace: monitor
spec:
  clusterIP: None
  ports:
  - name: http-metrics
    port: 8080
    targetPort: http-metrics
  - name: telemetry
    port: 8081
    targetPort: telemetry
  selector:
    app.kubernetes.io/name: kube-state-metrics

$ kubectl apply -f standard/service.yaml
二.Grafana
可视化面板, 功能齐全的度量仪表盘和图形编辑器

<aside>
💢 注意

* 使用最新版本的镜像 [https://github.com/grafana/grafana](https://github.com/grafana/grafana)

</aside>

* 通过环境变量设置管理员账户密码

  * GF_SECURITY_ADMIN_USER
  * GF_SECURITY_ADMIN_PASSWORD
* 通过设置securityContext的方式让grafana进程使用root启动
* 数据挂载到本地
* 配置ingress暴露访问入口

$ cat grafana-all.yaml
apiVersion: apps/v1
kind: Deployment
metadata:
  name: grafana
  namespace: monitor
spec:
  selector:
    matchLabels:
      app: grafana
  template:
    metadata:
      labels:
        app: grafana
    spec:
      volumes:
      - name: storage
        hostPath:
          path: /data/grafana/
      nodeSelector:
        app: prometheus
      securityContext:
        runAsUser: 0
      containers:
      - name: grafana
        image: grafana/grafana:7.1.1
        imagePullPolicy: IfNotPresent
        ports:
        - containerPort: 3000
          name: grafana
        env:
        - name: GF_SECURITY_ADMIN_USER
          value: admin
        - name: GF_SECURITY_ADMIN_PASSWORD
          value: admin
        readinessProbe:
          failureThreshold: 10
          httpGet:
            path: /api/health
            port: 3000
            scheme: HTTP
          initialDelaySeconds: 60
          periodSeconds: 10
          successThreshold: 1
          timeoutSeconds: 30
        livenessProbe:
          failureThreshold: 3
          httpGet:
            path: /api/health
            port: 3000
            scheme: HTTP
          periodSeconds: 10
          successThreshold: 1
          timeoutSeconds: 1
        resources:
          limits:
            cpu: 150m
            memory: 512Mi
          requests:
            cpu: 150m
            memory: 512Mi
        volumeMounts:
        - mountPath: /var/lib/grafana
          name: storage
---
apiVersion: v1
kind: Service
metadata:
  name: grafana
  namespace: monitor
spec:
  type: ClusterIP
  ports:
    - port: 3000
  selector:
    app: grafana

---
apiVersion: extensions/v1beta1
kind: Ingress
metadata:
  name: grafana
  namespace: monitor
spec:
  rules:
  - host: grafana.luffy.com
    http:
      paths:
      - path: /
        backend:
          serviceName: grafana
          servicePort: 3000

配置数据源:
* URL:http://prometheus:9090

如何丰富Grafana监控面板:

* 导入dashboard
* 安装相应的插件
* 自定义监控面板

### 导入Dashboard的配置
dashboard: [https://grafana.com/grafana/dashboards](https://grafana.com/grafana/dashboards)

* Node Exporter [https://grafana.com/grafana/dashboards/8919](https://grafana.com/grafana/dashboards/8919)
* Prometheus: [https://grafana.com/grafana/dashboards/8588](https://grafana.com/grafana/dashboards/8588)

## DevOpsProdigy KubeGraf 插件的使用

* [grafana-kubernetes-app](https://grafana.com/grafana/plugins/grafana-kubernetes-app)
* [devopsprodigy-kubegraf-app](https://grafana.com/grafana/plugins/devopsprodigy-kubegraf-app)

[DevOpsProdigy KubeGraf](https://grafana.com/grafana/plugins/devopsprodigy-kubegraf-app)  是一个非常优秀的 Grafana Kubernetes 插件, 是Grafana官方的kubernetes 的插件的升级版本, 该插件可以来可视化和分析 Kubernetes 集群的性能,通过各种图形直观的展示了kubernetes 集群的主要服务的指标和特征, 可以用于检查应用成的的生命周期和错误日志


# 进入grafana容器内部执行安装
$ kubectl -n monitor exec -ti grafana-594f447d6c-jmjsw bash
bash-5.0# grafana-cli plugins install devopsprodigy-kubegraf-app 1.4.1
installing devopsprodigy-kubegraf-app @ 1.4.1
from: <https://grafana.com/api/plugins/devopsprodigy-kubegraf-app/versions/1.4.1/download>
into: /var/lib/grafana/plugins

✔ Installed devopsprodigy-kubegraf-app successfully

Restart grafana after installing plugins . <service grafana-server restart>

bash-5.0# grafana-cli plugins install grafana-piechart-panel
installing grafana-piechart-panel @ 1.5.0
from: <https://grafana.com/api/plugins/grafana-piechart-panel/versions/1.5.0/download>
into: /var/lib/grafana/plugins

✔ Installed grafana-piechart-panel successfully

Restart grafana after installing plugins . <service grafana-server restart>

# 也可以下载离线包进行安装

# 重建pod生效
$ kubectl -n monitor delete po grafana-594f447d6c-jmjsw
登录grafana界面,Configuration -> Plugins 中找到安装的插


登录grafana界面,Configuration -> Plugins 中找到安装的插件,点击插件进入插件详情页面,点击 [Enable]按钮启用插件,点击 `Set up your first k8s-cluster` 创建一个新的 Kubernetes 集群:

* Name:luffy-k8s
* URL:[https://kubernetes.default:443](https://kubernetes.default:443)
* Access:使用默认的Server(default)
* Skip TLS Verify:勾选,跳过证书合法性校验
* Auth:勾选TLS Client Auth以及With CA Cert,勾选后会下面有三块证书内容需要填写,内容均来自`~/.kube/config`文件,需要对文件中的内容做一次base64 解码

  * CA Cert:使用config文件中的`certificate-authority-data`对应的内容
  * Client Cert:使用config文件中的`client-certificate-data`对应的内容
  * Client Key:使用config文件中的`client-key-data`对应的内容
三.Alertmanager
Alertmanager 是一个独立的告警模块

* 接收Prometheus 等客户端发来的告警
* 通过分组、删除重复等处理, 将他们通过路由发送给正确的接收器
* 告警方式可以按照不同的规则发送给不同的模块负责人, Alertmanager支持Email, Slack,等告警方式, 也可以通过webhook接入钉钉等国内IM工具。

从上图可得知设置警报和通知的主要步骤是:

* 安装和配置 Alertmanager
* 配置Prometheus与Alertmanager对话
* 在Prometheus中创建警报规则
1.安装alertmanager并配置告警规则
1.1 alertmanager-config.yml配置发送者/接收者/发送告警周期
$ cat alertmanager-config.yml

[root@lc-master-1 yaml]# cat ../alertmanger/alertmanager-config.yml
apiVersion: v1
data:
  config.yml: |
    global:
      # 当alertmanager持续多长时间未接收到告警后标记告警状态为 resolved
      resolve_timeout: 2m
      # 配置邮件发送信息
      smtp_smarthost: 'smtp.163.com:25'
      smtp_from: 'lc3271116@163.com'
      smtp_auth_username: 'lc3271116@163.com'
      smtp_auth_password: 'PJIKJQNZJJWDOLTA'
      smtp_require_tls: false
    # 所有报警信息进入后的根路由,用来设置报警的分发策略
    route:
      # 接收到的报警信息里面有许多alertname=NodeLoadHigh 这样的标签的报警信息将会批量被聚合到一个分组里面
      group_by: ['alertname']
      # 当一个新的报警分组被创建后,需要等待至少 group_wait 时间来初始化通知,如果在等待时间内当前group接收到了新的告警,这些告警将会合并为一个通知向receiver发送
      group_wait: 30s

      # 表示X分钟内不在firing状态,就表示故障已恢复
      group_interval: 10m
      # 如果一个报警信息已经发送成功了,等待 repeat_interval 时间来重新发送
      repeat_interval: 1h

      # 默认的receiver:如果一个报警没有被一个route匹配,则发送给默认的接收器
      receiver: 'web'

      # 上面所有的属性都由所有子路由继承,并且可以在每个子路由上进行覆盖。
    # 配置告警接收者的信息
    receivers:
    - name: 'web'
      #email_configs:
      webhook_configs:
      - url: 'http://192.168.0.71:8080/prometheusalert?type=fs&tpl=prometheus-fs&fsurl=https://open.feishu.cn/open-apis/bot/v2/hook/d29cbdee-aeb5-4b80-a6b4-868b830d1ab9'
      #- to: '3275594770@qq.com'
        send_resolved: true  # 接受告警恢复的通知
kind: ConfigMap
metadata:
  name: alertmanager
  namespace: monitor


global: 这个部分包含了全局配置参数,例如全局的抓取间隔(scrape_interval)和评估间隔(evaluation_interval)等。

route: 这个部分定义了警报路由配置,用于指定如何处理接收到的警报信息。在这里,可以设置警报分组、处理延迟、重复发送间隔等。

receivers: 这个部分定义了接收警报的接收器(receivers),即警报通知应该发送到哪些目标。可以配置不同的接收器,例如电子邮件、飞书等,以便根据需要选择合适的通知方式。
1.2 部署alertmanager
[root@lc-master-1 yaml]# cat ../alertmanger/alertmanager-all.yaml
apiVersion: apps/v1
kind: Deployment
metadata:
  name: alertmanager
  namespace: monitor
  labels:
    app: alertmanager
spec:
  selector:
    matchLabels:
      app: alertmanager
  template:
    metadata:
      labels:
        app: alertmanager
    spec:
      volumes:
      - name: config
        configMap:
          name: alertmanager
      containers:
      - name: alertmanager
        image: prom/alertmanager:v0.21.0
        imagePullPolicy: IfNotPresent
        args:
        - "--config.file=/etc/alertmanager/config.yml"
        - "--log.level=debug"
        ports:
        - containerPort: 9093
          name: http
        volumeMounts:
        - mountPath: "/etc/alertmanager"
          name: config
        resources:
          requests:
            cpu: 100m
            memory: 256Mi
          limits:
            cpu: 100m
            memory: 256Mi
---
apiVersion: v1
kind: Service
metadata:
  name: alertmanager
  namespace: monitor
spec:
  type: NodePort
  ports:
    - port: 9093
  selector:
    app: alertmanager

#---
#apiVersion: extensions/v1beta1
#kind: Ingress
#metadata:
#  name: alertmanager
#  namespace: monitor
#spec:
#  rules:
#  - host: alertmanager.luffy.com
#    http:
#      paths:
#      - path: /
#        backend:
#          serviceName: alertmanager
#          servicePort: 9093
1.3 配置 Prometheus 与 Alertmanger 对话
[root@lc-master-1 yaml]# cat prometheus-configmap.yaml
....
data:
  prometheus.yml: |
    global:
      scrape_interval: 15s
      evaluation_interval: 15s
    alerting:
      alertmanagers:
      - static_configs:
        - targets:
          - 10.10.143.58:9093  #此处IP是alertmanager的svc加端口
    # Load rules once and periodically evaluate them according to the global  'evaluation_interval'.
    rule_files:
      - /etc/prometheus/alert_rules.yml
      # - "first_rules.yml"
      # - "second_rules.yml"

    scrape_configs:
    - job_name: 'prometheus'
      static_configs:
      - targets: ['localhost:9090']

...
kubectl apply -f prometheus-configmap.yaml

[root@lc-master-1 yaml]# kubectl get pods -o wide  -n monitor
prometheus-6c7b58dd85-lpmn7           1/1     Running   0          17h     10.11.215.226   lc-worker-1   <none>           <none>

# 现在已经有监控数据了,因此使用prometheus提供的reload的接口,进行服务重启
$ curl -X POST 10.11.215.226
1.4 配置告警规则
[root@lc-master-1 yaml]# cat  prometheus-configmap.yaml
apiVersion: v1
kind: ConfigMap
metadata:
  name: prometheus-config
  namespace: monitor
data:
  prometheus.yml: |
    global:
      scrape_interval: 15s
      evaluation_interval: 15s
    alerting:
      alertmanagers:
      - static_configs:
        - targets:
          - 10.10.143.58:9093
    # Load rules once and periodically evaluate them according to the global  'evaluation_interval'.
    rule_files:
      - /etc/prometheus/alert_rules.yml
      # - "first_rules.yml"
      # - "second_rules.yml"

    scrape_configs:
    - job_name: 'prometheus'
      static_configs:
      - targets: ['localhost:9090']

    - job_name: 'coredns'
      static_configs:
      - targets: ['10.11.221.199:9153']

    - job_name: 'kubernetes-apiserver'
      static_configs:
      - targets: ['10.10.0.1']
      scheme: https
      tls_config:
        ca_file: /var/run/secrets/kubernetes.io/serviceaccount/ca.crt
        insecure_skip_verify: true
      bearer_token_file: /var/run/secrets/kubernetes.io/serviceaccount/token

    - job_name: 'kubernetes-sd-node-exporter'
      kubernetes_sd_configs:
        - role: node
      relabel_configs:
      - source_labels: [__address__]
        regex: '(.*):10250'
        replacement: '${1}:9100'
        target_label: __address__
        action: replace

    - job_name: 'kubernetes-sd-cadvisor'
      kubernetes_sd_configs:
        - role: node
      scheme: https
      tls_config:
        ca_file: /var/run/secrets/kubernetes.io/serviceaccount/ca.crt
        insecure_skip_verify: true
      bearer_token_file: /var/run/secrets/kubernetes.io/serviceaccount/token
      relabel_configs:
      - target_label: __address__
        replacement: 10.10.0.1
      - source_labels: [__meta_kubernetes_node_name]
        regex: (.+)
        target_label: __metrics_path__
        replacement: /api/v1/nodes/${1}/proxy/metrics/cadvisor

    - job_name: 'kubernetes-sd-endpoints'
      kubernetes_sd_configs:
      - role: endpoints
      relabel_configs:
      - source_labels: [__meta_kubernetes_service_annotation_prometheus_io_scrape]
        action: keep
        regex: true
      - source_labels: [__meta_kubernetes_service_annotation_prometheus_io_path]
        action: replace
        target_label: __metrics_path__
        regex: (.+)
      - source_labels: [__address__, __meta_kubernetes_service_annotation_prometheus_io_port]
        action: replace
        target_label: __address__
        regex: ([^:]+)(?::\\d+)?;(\\d+)
        replacement: $1:$2
      - source_labels: [__meta_kubernetes_namespace]
        action: replace
        target_label: kubernetes_namespace
      - source_labels: [__meta_kubernetes_service_name]
        action: replace
        target_label: kubernetes_name
      - source_labels: [__meta_kubernetes_pod_name]
        action: replace
        target_label: kubernetes_pod_name
      - source_labels: [__meta_kubernetes_node_address_InternalIP]
        action: replace
        target_label: kubernetes_node_ip

  alert_rules.yml: |
    groups:
    - name: node_metrics
      rules:
      - alert: Node Exporter 宕机
        expr: up{instance="lc-master-1", job="kubernetes-sd-node-exporter"} == 0
        for: 15m
        labels:
          severity: critical
        annotations:
          summary: "{{ $labels.instance }} 已经停止运行超过 15m!"
      - alert: Pod!不健康
        expr: min_over_time(sum by (namespace, pod) (kube_pod_status_phase{phase=~"Pending|Unknown|Failed"})[15m:1m]) > 0
        for: 15m
        labels:
          severity: critical
        annotations:
          summary: Kubernetes Pod not healthy (instance {{ $labels.instance }})
          description: "Pod已处于非监控状态超过15分钟.\n VALUE = {{ $value }}\n LABELS = {{ $labels }}"
      - alert: 节点未就绪!
        expr: kube_node_status_condition{condition="Ready",status="true"} == 0
        for: 10m
        labels:
          severity: critical
        annotations:
          summary: Kubernetes Node ready (instance {{ $labels.instance }})
          description: " 节点 {{ $labels.node }} 处于超过10m未准备就绪的状态\\n  VALUE = {{ $value }}\\n  LABELS = {{ $labels }}"
      - alert: Kubernetes内存压力
        expr: kube_node_status_condition{condition="MemoryPressure",status="true"} == 1
        for: 2m
        labels:
          severity: critical
        annotations:
          summary: Kubernetes memory pressure (instance {{ $labels.instance }})
          description: "{{ $labels.node }} 节点存在内存压力\\n  VALUE = {{ $value }}\\n  LABELS = {{ $labels }}"
      - alert: Kubernetes磁盘压力
        expr: kube_node_status_condition{condition="DiskPressure",status="true"} == 1
        for: 2m
        labels:
          severity: critical
        annotations:
          summary: Kubernetes disk pressure (instance {{ $labels.instance }})
          description: "{{ $labels.node }} 节点存在磁盘压力\\n  VALUE = {{ $value }}\\n  LABELS = {{ $labels }}"
      - alert: Kubernetes磁盘空间不足
        expr: kube_node_status_condition{condition="OutOfDisk",status="true"} == 1
        for: 2m
        labels:
          severity: critical
        annotations:
          summary: Kubernetes out of disk (instance {{ $labels.instance }})
          description: "{{ $labels.node }} 节点存在磁盘空间不足\\n  VALUE = {{ $value }}\\n  LABELS = {{ $labels }}"
      - alert: Kubernetes节点资源容量的极限
        expr: sum by (node) ((kube_pod_status_phase{phase="Running"} == 1) + on(uid) group_left(node) (0 * kube_pod_info{pod_template_hash=""})) / sum by (node) (kube_node_status_allocatable{resource="pods"}) * 100 > 90
        for: 2m
        labels:
          severity: warning
        annotations:
          summary: Kubernetes out of capacity (instance {{ $labels.instance }})
          description: "{{ $labels.node }} 节点的资源容量已经用尽\\n  VALUE = {{ $value }}\\n  LABELS = {{ $labels }}"
    - name: node-cpu
      rules:
      - record: instance:node_cpus:count
        expr: count without (cpu, mode) (node_cpu_seconds_total{mode="idle"})
      - record: instance_cpu:node_cpu_seconds_not_idle:rate1m
        expr: sum without (mode) (1 - rate(node_cpu_seconds_total{mode="idle"}[1m]))
      - record: instance:node_cpu_utilization:ratio
        expr: avg without (cpu) (instance_cpu:node_cpu_seconds_not_idle:rate1m)

      - alert: cpu使用率大于80%
        expr: instance:node_cpu_utilization:ratio * 100 > 80
        for: 5m
        labels:
          severity: critical
          level: 3
        annotations:
          summary: "cpu使用率大于80%"
          description: "主机 {{ $labels.hostname }} 的cpu使用率为 {{ $value | humanize }}"
      - alert: cpu使用率大于90%
        expr: instance:node_cpu_utilization:ratio * 100 > 90
        for: 2m
        labels:
          severity: emergency
          level: 4
        annotations:
          summary: "cpu使用率大于90%"
          description: "主机 {{ $labels.hostname }} 的cpu使用率为 {{ $value | humanize }}"


告警规则的几个要素

* [group.name](http://group.name): 告警分组的名称, 一个组可以配置一类告警规则, 比如都是物理节点相关的告警
* alert: 告警规则名称
* expr: 是用于进行报警规则 Pro没QL 查询语句, expr 通常是布尔表达式, 可以让Prometheus 根据计算的指标值做true or false的判断,
* for: 评估等待时间,用于表示只有当触发条件持续一段时间后发送告警, 在等待期间新产生的告警状态为 pending, 屏蔽掉瞬时的问题,把焦点放在真正有持续影响的问题上
* labels: 自定义标签, 允许用户指定额外的标签列表, 把他们附加在告警上, 可以用于后面的做路由判断, 通知到不同的终端, 通常被用于添加告警级别的标签
* annotations: 指定了另一组标签,它们不被当做告警实例的身份标识,它们经常用于存储一些额外的信息,用于报警信息的展示之类的
配置规则中, 支持末班的方式, 其中
* {{$labels}} 可以获取当前指标的所有标签,支持{{$labels.instance}}或者{{$labels.job}}这种形式
* {{ $value }}可以获取当前计算出的指标值
更新配置并软重启, 查看Prometheus 报警规则
一个报警信息在声明周期内的3种状态
* `inactive`: 表示当前报警信息处于非活动状态, 即不满足报警条件
* `pending`; 表示在设置的法制时间范围内被激活了, 即满足报警条件, 但是还在观察期内
* • `firing`: 表示超过设置的阈值时间被激活了,即满足报警条件,且报警触发时间超过了观察期,会发送到Alertmanager端
对于已经 `pending`或者 `firing`的告警,Prometheus 也会将它们存储到时间序列`ALERTS{}` 中。当然我们也可以通过表达式去查询告警实例
```yaml
ALERTS{}
```
查看Alertmanager日志:
说明告警已经推送到Alertmanager端了,但是邮箱登录的时候报错,这是因为邮箱默认没有开启第三方客户端登录。因此需要登录163邮箱设置SMTP服务允许客户端登录
## 抑制和静默
前面我们知道, 告警的group(分组) 功能通过把多条告警数据聚合, 有效的减少告警的频繁发送, 除此之外, alertmanger还支持Inhibition(抑制) 和sliences(静默), 帮助我们抑制或者屏蔽告警
* Inhibition 抑制
抑制是当出现其他告警的时候,压制当前告警的通知,可以有效的防止告警风暴。
在Alertmanager配置文件中,使用inhibit_rules定义一组告警的抑制规则:
```yaml
inhibit_rules:
[ - <inhibit_rule> ... ]
```
每一条抑制规则的具体配置如下:
```yaml
target_match:
[ <labelname>: <labelvalue>, ... ]
target_match_re:
[ <labelname>: <regex>, ... ]
source_match:
[ <labelname>: <labelvalue>, ... ]
source_match_re:
[ <labelname>: <regex>, ... ]
[ equal: '[' <labelname>, ... ']' ]
```
target_match或者target_match_re规则,当有新的告警规则如果满足source_match或者定义的匹配规则,并且已发送的告警与新产生的告警中equal定义的标签完全相同,则启动抑制机制,新的告警不会发送
```yaml
- source_match:
alertname: NodeDown
severity: critical
target_match:
severity: critical
equal:
- node
```
如当集群中的某一个主机节点异常宕机导致告警NodeDown被触发,同时在告警规则中定义了告警级别severity=critical。由于主机异常宕机,该主机上部署的所有服务,中间件会不可用并触发报警。根据抑制规则的定义,如果有新的告警级别为severity=critical,并且告警中标签node的值与NodeDown告警的相同,则说明新的告警是由NodeDown导致的,则启动抑制机制停止向接收器发送通知
实现如果 NodeMemoryUsage 报警触发,则抑制NodeLoad指标规则引起的报警。
inhibit_rules:
- source_match:
alertname: NodeMemoryUsage
severity: critical
target_match:
severity: normal
equal:
- instance
* Silences: 静默
简单直接的在指定时段关闭告警。静默通过匹配器(Matcher)来配置,类似于路由树。警告进入系统的时候会检查它是否匹配某条静默规则,如果是则该警告的通知将忽略。 静默规则在Alertmanager的 Web 界面里配置。
2.监控规则参考
https://samber.github.io/awesome-prometheus-alerts/rules#kubernetes
四.监控项⭐
| 监控项 |
|
|
| cpu>80/90 |
|
|
| Node exporter宕机 |
|
|
| Pod不健康 |
|
|
| 节点未就绪 |
|
|
| Kubernetes磁盘压力 |
|
|
| Kubernetes磁盘空间不足 |
|
|
| Kubernetes节点资源容量的极限 |
|
|
| 网络IO-监控 |
|
|
| 存储IO-监控 |
|
|
[root@lc-master-1 yaml]# cat prometheus-configmap.yaml
apiVersion: v1
kind: ConfigMap
metadata:
  name: prometheus-config
  namespace: monitor
data:
  prometheus.yml: |
    global:
      scrape_interval: 15s
      evaluation_interval: 15s
    alerting:
      alertmanagers:
      - static_configs:
        - targets:
          - 10.10.143.58:9093
    # Load rules once and periodically evaluate them according to the global  'evaluation_interval'.
    rule_files:
      - /etc/prometheus/alert_rules.yml
      # - "first_rules.yml"
      # - "second_rules.yml"

    scrape_configs:
    - job_name: 'prometheus'
      static_configs:
      - targets: ['localhost:9090']

    - job_name: 'coredns'
      static_configs:
      - targets: ['10.11.221.199:9153']

    - job_name: 'kubernetes-apiserver'
      static_configs:
      - targets: ['10.10.0.1']
      scheme: https
      tls_config:
        ca_file: /var/run/secrets/kubernetes.io/serviceaccount/ca.crt
        insecure_skip_verify: true
      bearer_token_file: /var/run/secrets/kubernetes.io/serviceaccount/token

    - job_name: 'kubernetes-sd-node-exporter'
      kubernetes_sd_configs:
        - role: node
      relabel_configs:
      - source_labels: [__address__]
        regex: '(.*):10250'
        replacement: '${1}:9100'
        target_label: __address__
        action: replace
      - source_labels: [__meta_kubernetes_node_address_InternalIP]
        action: replace
        target_label: kubernetes_node_ip

    - job_name: 'kubernetes-sd-cadvisor'
      kubernetes_sd_configs:
        - role: node
      scheme: https
      tls_config:
        ca_file: /var/run/secrets/kubernetes.io/serviceaccount/ca.crt
        insecure_skip_verify: true
      bearer_token_file: /var/run/secrets/kubernetes.io/serviceaccount/token
      relabel_configs:
      - target_label: __address__
        replacement: 10.10.0.1
      - source_labels: [__meta_kubernetes_node_name]
        regex: (.+)
        target_label: __metrics_path__
        replacement: /api/v1/nodes/${1}/proxy/metrics/cadvisor
      - source_labels: [__meta_kubernetes_node_address_InternalIP]
        action: replace
        target_label: kubernetes_node_ip


    - job_name: 'kubernetes-sd-endpoints'
      kubernetes_sd_configs:
      - role: endpoints
      relabel_configs:
      - source_labels: [__meta_kubernetes_service_annotation_prometheus_io_scrape]
        action: keep
        regex: true
      - source_labels: [__meta_kubernetes_service_annotation_prometheus_io_path]
        action: replace
        target_label: __metrics_path__
        regex: (.+)
      - source_labels: [__address__, __meta_kubernetes_service_annotation_prometheus_io_port]
        action: replace
        target_label: __address__
        regex: ([^:]+)(?::\\d+)?;(\\d+)
        replacement: $1:$2
      - source_labels: [__meta_kubernetes_namespace]
        action: replace
        target_label: kubernetes_namespace
      - source_labels: [__meta_kubernetes_service_name]
        action: replace
        target_label: kubernetes_name
      - source_labels: [__meta_kubernetes_pod_name]
        action: replace
        target_label: kubernetes_pod_name
      - source_labels: [__meta_kubernetes_pod_host_ip]
        action: replace
        target_label: kubernetes_node_ip

  alert_rules.yml: |
    groups:
    - name: node_metrics
      rules:
      - alert: Node Exporter 宕机
        expr: up{job="kubernetes-sd-node-exporter"} == 0
        for: 10m
        labels:
          severity: critical
        annotations:
          summary: "{{ $labels.instance }} 已经停止运行超过 10m!"

      - alert: Pod!不健康
        expr: min_over_time(sum by (namespace, pod,kubernetes_node_ip) (kube_pod_status_phase{phase=~"Pending|Unknown|Failed"})[10m:1m]) > 0
        for: 10m
        labels:
          severity: critical
        annotations:
          summary: Kubernetes Pod not healthy (instance {{ $labels.instance }})
          description: "Pod已处于非健康状态超过10分钟.\n VALUE = {{ $value }}\n LABELS = {{ $labels }}"

      - alert: 节点未就绪!
        expr: kube_node_status_condition{condition="Ready",status="true"} == 0
        for: 1m
        labels:
          severity: critical
        annotations:
          summary: Kubernetes Node ready (instance {{ $labels.instance }})
          description: " 节点 {{ $labels.node }} 处于超过1m未准备就绪的状态\\n  VALUE = {{ $value }}\\n  LABELS = {{ $labels }}"

      - alert: Kubernetes内存压力
        expr: kube_node_status_condition{condition="MemoryPressure",status="true"} == 1
        for: 2m
        labels:
          severity: critical
        annotations:
          summary: Kubernetes memory pressure (instance {{ $labels.instance }})
          description: "{{ $labels.node }} 节点存在内存压力\\n  VALUE = {{ $value }}\\n  LABELS = {{ $labels }}"

      - alert: Kubernetes磁盘压力
        expr: kube_node_status_condition{condition="DiskPressure",status="true"} == 1
        for: 2m
        labels:
          severity: critical
        annotations:
          summary: Kubernetes disk pressure (instance {{ $labels.instance }})
          description: "{{ $labels.node }} 节点存在磁盘压力\\n  VALUE = {{ $value }}\\n  LABELS = {{ $labels }}"

      - alert: Kubernetes磁盘空间不足
        expr: kube_node_status_condition{condition="OutOfDisk",status="true"} == 1
        for: 2m
        labels:
          severity: critical
        annotations:
          summary: Kubernetes out of disk (instance {{ $labels.instance }})
          description: "{{ $labels.node }} 节点存在磁盘空间不足\\n  VALUE = {{ $value }}\\n  LABELS = {{ $labels }}"
      - alert: Kubernetes节点资源容量的极限
        expr: sum by (node) ((kube_pod_status_phase{phase="Running"} == 1) + on(uid) group_left(node) (0 * kube_pod_info{pod_template_hash=""})) / sum by (node) (kube_node_status_allocatable{resource="pods"}) * 100 > 90
        for: 2m
        labels:
          severity: warning
        annotations:
          summary: Kubernetes out of capacity (instance {{ $labels.instance }})
          description: "{{ $labels.node }} 节点的资源容量已经用尽\\n  VALUE = {{ $value }}\\n  LABELS = {{ $labels }}"
    - name: node-cpu
      rules:
      - record: instance:node_cpus:count
        expr: count without (cpu, mode) (node_cpu_seconds_total{mode="idle"})
      - record: instance_cpu:node_cpu_seconds_not_idle:rate1m
        expr: sum without (mode) (1 - rate(node_cpu_seconds_total{mode="idle"}[1m]))
      - record: instance:node_cpu_utilization:ratio
        expr: avg without (cpu) (instance_cpu:node_cpu_seconds_not_idle:rate1m)

      - alert: cpu使用率大于80%
        expr: instance:node_cpu_utilization:ratio * 100 > 80
        for: 5m
        labels:
          severity: critical
          level: 3
        annotations:
          summary: "cpu使用率大于80%"
          description: "主机 {{ $labels.hostname }} 的cpu使用率为 {{ $value | humanize }}"
      - alert: cpu使用率大于90%
        expr: instance:node_cpu_utilization:ratio * 100 > 90
        for: 2m
        labels:
          severity: emergency
          level: 4
        annotations:
          summary: "cpu使用率大于90%"
          description: "主机 {{ $labels.hostname }} 的cpu使用率为 {{ $value | humanize }}"
五.Promethuesalter告警管理平台
1.二进制安装promethuesalter配置并启动
下载Promethuesalter
wget https://github.com/feiyu563/PrometheusAlert/releases/download/v4.9/linux.zip
unzip linux.zip
mv  linux  prometheusAlert


[root@lc-master-1 ~]# systemctl cat  prometheusalert.service
# /usr/lib/systemd/system/prometheusalert.service
[Service]
ExecStart=/usr/local/prometheusAlert/PrometheusAlert
WorkingDirectory=/usr/local/prometheusAlert
Restart=always
[Install]
WantedBy=multi-user.target
[Unit]
Description=Prometheus Alerting Service
After=network.target

systemctl daemon-reload
systemctl restart promethues.services

chmod 755 /usr/local/prometheusAlert/PrometheusAlert
2.访问ip+8080端口
配置告警模板
{{ $var := .externalURL}}{{ range $k,$v:=.alerts }}
{{if eq $v.status "resolved"}}
测试环境Prometheus 恢复通知
🟡【告警名称】{{$v.labels.alertname}}
🚨【告警级别】{{ $v.labels.severity}}
✅【告警状态】{{$v.status}}
🧭【开始时间】{{GetCSTtime $v.startsAt}}
🧭【结束时间】{{GetCSTtime $v.endsAt}}
🏷️【命名空间】 {{$v.labels.namespace}}
👁🗨【Pod 名称】 {{$v.labels.pod}}
🏁【 节点 IP 】{{ $v.labels.kubernetes_node_ip}}
📡【实例名称】 {{$v.labels.instance}} {{$v.labels.job}}
{{$v.labels.deployment}} {{$v.labels.statefulset}}
📝【告警详情】 {{ $v.annotations.message }}{{ $v.annotations.description}};{{$v.annotations.summary}}
{{else}}
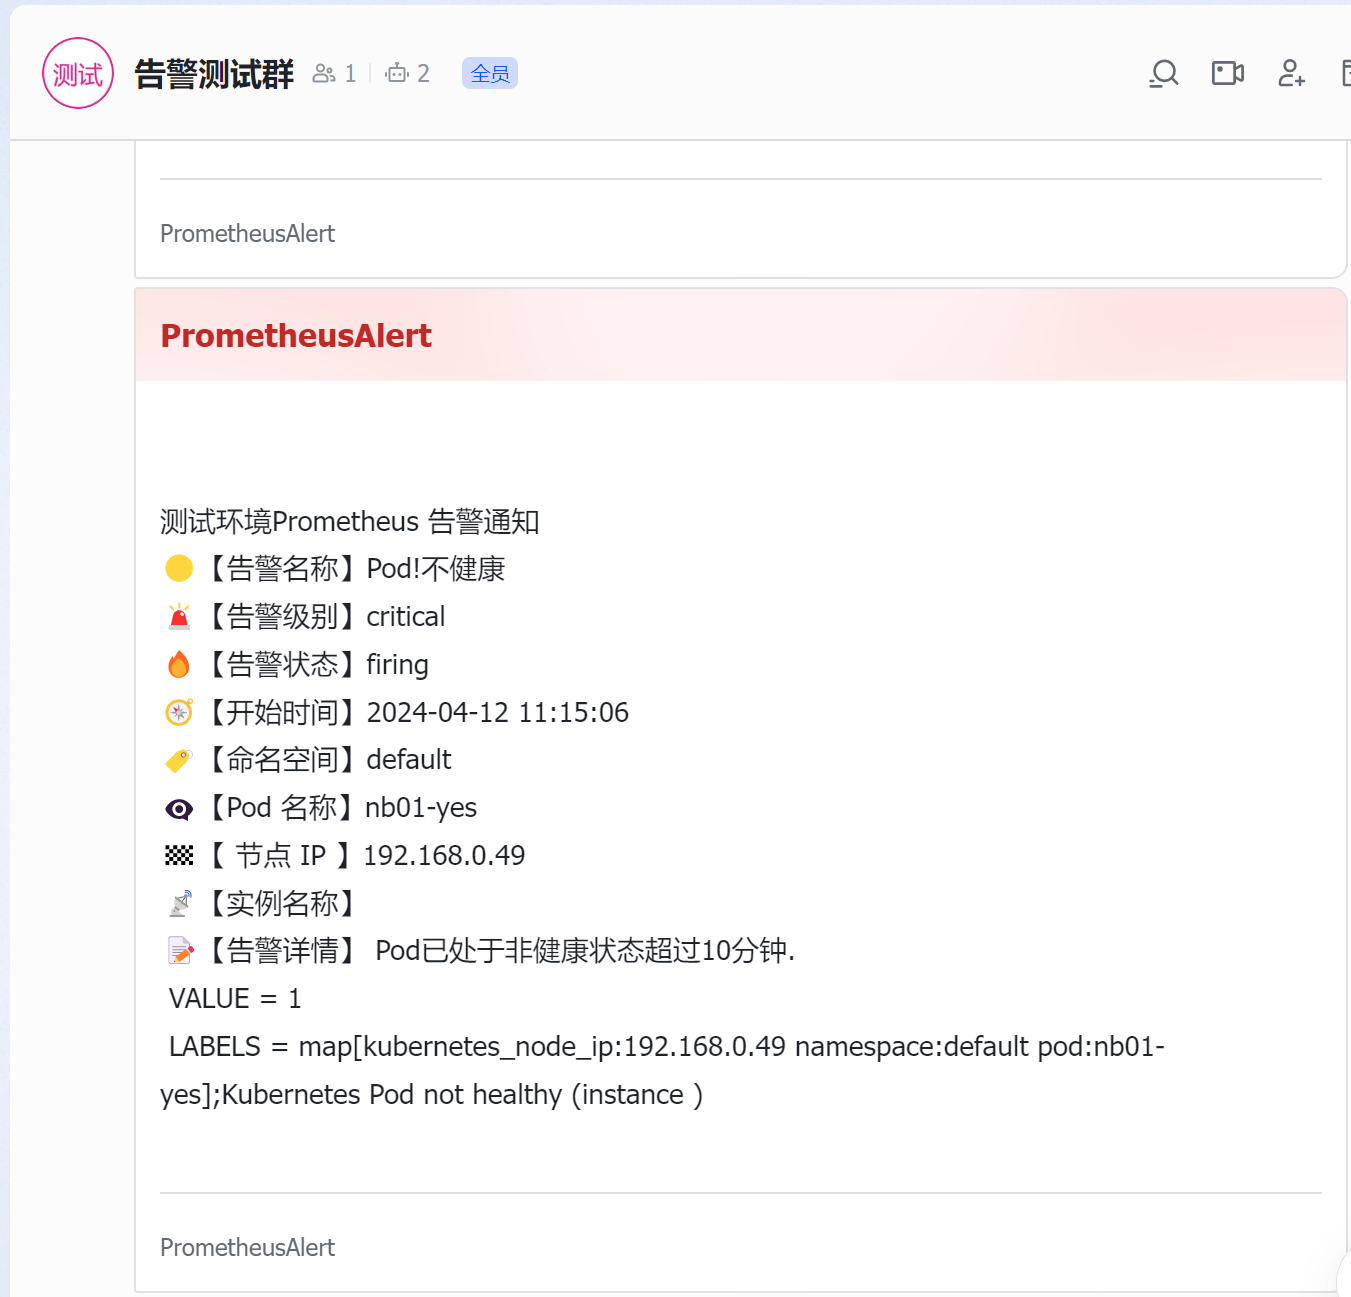
测试环境Prometheus 告警通知
🟡【告警名称】{{$v.labels.alertname}}
🚨【告警级别】{{ $v.labels.severity}}
🔥【告警状态】{{$v.status}}
🧭【开始时间】{{GetCSTtime $v.startsAt}}
🏷️【命名空间】{{$v.labels.namespace}}
👁🗨【Pod 名称】{{$v.labels.pod}}
🏁【 节点 IP 】{{ $v.labels.kubernetes_node_ip}}
📡【实例名称】{{$v.labels.instance}} {{$v.labels.job}} {{$v.labels.deployment}} {{$v.labels.statefulset}}
📝【告警详情】 {{$v.annotations.message }}{{ $v.annotations.description}};{{$v.annotations.summary}}
{{end}}
{{ end }}
3.告警测试最终结果
![]()


 浙公网安备 33010602011771号