

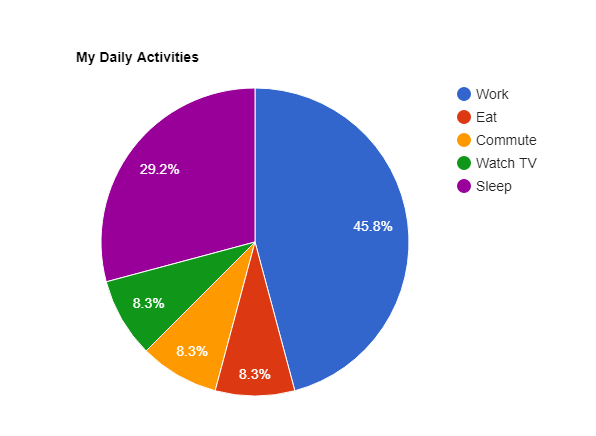
 1 <html>
 2   <head>
 3     <script type="text/javascript" src="https://www.gstatic.com/charts/loader.js"></script>
 4     <script type="text/javascript">
 5       google.charts.load('current', {'packages':['corechart']});
 6       google.charts.setOnLoadCallback(drawChart);
 7
 8       function drawChart() {
 9
10         var data = google.visualization.arrayToDataTable([
11           ['Task', 'Hours per Day'],
12           ['Work',     11],
13           ['Eat',      2],
14           ['Commute',  2],
15           ['Watch TV', 2],
16           ['Sleep',    7]
17         ]);
18
19         var options = {
20           title: 'My Daily Activities'
21         };
22
23         var chart = new google.visualization.PieChart(document.getElementById('piechart'));
24
25         chart.draw(data, options);
26       }
27     </script>
28   </head>
29   <body>
30     <div id="piechart" style="width: 900px; height: 500px;"></div>
31   </body>
32 </html>
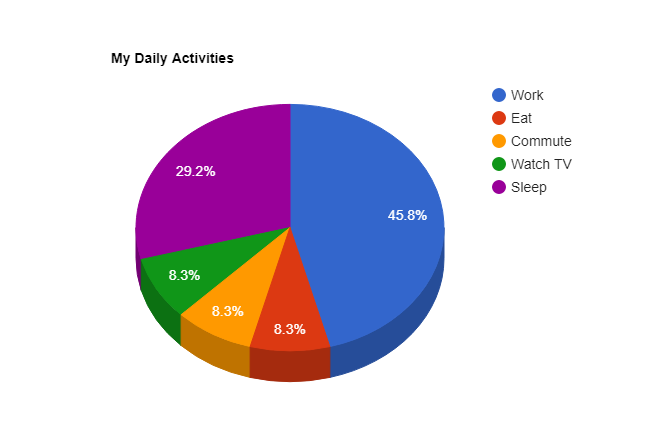
 1 <html>
 2   <head>
 3     <script type="text/javascript" src="https://www.gstatic.com/charts/loader.js"></script>
 4     <script type="text/javascript">
 5       google.charts.load("current", {packages:["corechart"]});
 6       google.charts.setOnLoadCallback(drawChart);
 7       function drawChart() {
 8         var data = google.visualization.arrayToDataTable([
 9           ['Task', 'Hours per Day'],
10           ['Work',     11],
11           ['Eat',      2],
12           ['Commute',  2],
13           ['Watch TV', 2],
14           ['Sleep',    7]
15         ]);
16
17         var options = {
18           title: 'My Daily Activities',
19           is3D: true,
20         };
21
22         var chart = new google.visualization.PieChart(document.getElementById('piechart_3d'));
23         chart.draw(data, options);
24       }
25     </script>
26   </head>
27   <body>
28     <div id="piechart_3d" style="width: 900px; height: 500px;"></div>
29   </body>
30 </html>
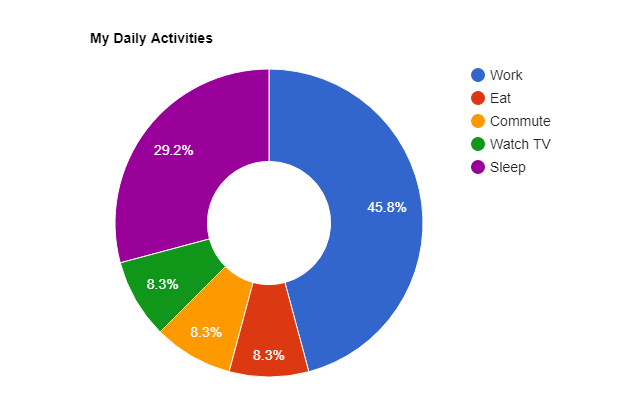
 1 <html>
 2   <head>
 3     <script type="text/javascript" src="https://www.gstatic.com/charts/loader.js"></script>
 4     <script type="text/javascript">
 5       google.charts.load("current", {packages:["corechart"]});
 6       google.charts.setOnLoadCallback(drawChart);
 7       function drawChart() {
 8         var data = google.visualization.arrayToDataTable([
 9           ['Task', 'Hours per Day'],
10           ['Work',     11],
11           ['Eat',      2],
12           ['Commute',  2],
13           ['Watch TV', 2],
14           ['Sleep',    7]
15         ]);
16
17         var options = {
18           title: 'My Daily Activities',
19           pieHole: 0.4,
20         };
21
22         var chart = new google.visualization.PieChart(document.getElementById('donutchart'));
23         chart.draw(data, options);
24       }
25     </script>
26   </head>
27   <body>
28     <div id="donutchart" style="width: 900px; height: 500px;"></div>
29   </body>
30 </html>

 浙公网安备 33010602011771号