
React-leaflet在ant-design pro中的基本使用
react-leaflet的github地址:https://github.com/PaulLeCam/react-leaflet
react-leaflet-markercluster点聚合github地址 :https://github.com/YUzhva/react-leaflet-markercluster
本篇案例github地址:https://github.com/GugaLiz/ant-design-react-ProDemo
一、react-leaflet显示多个marker点并显示多行popup
1.注意点:安装leaflet。 命令:npm install leaflet
![]()
2.装好环境以后这里有两个难点,①marker图标重新引入。②popup多行显示。
因为之前有踩过vue结合leaflet的坑、所以第一个问题这次跟vue里面重新引用图标一样解决了。第二个问题其实也不难、就是要灵活一点去试吧。因为官方文档没有写这种情况,只是很简单的示例。我先着重贴一下解决方案的代码、后面有整体代码结合理解。最后有我自己整理的github链接可以方便在实际开发中参考。
效果:
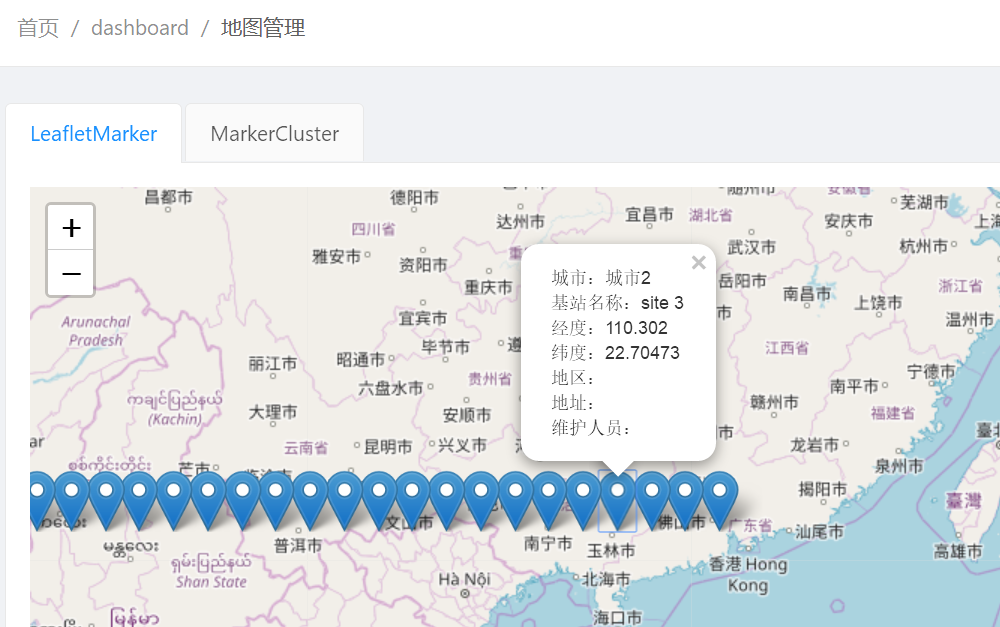
①。解决marker图标重新引入,第一import Leaflet,第二把leaflet模块中的markers文件夹复制到src路径下的asset静态资源文件夹中,第三重新引入图标。
②。解决第二问题,第一把每一个marker需要多行显示的popup的每一行都做成一个obj,这样在第二步进行处理的时候就可以分开与样式融合到一起。第二步处理popup
//处理popup的内容
整体代码参上:


import React, { PureComponent, Fragment } from 'react';
import { render } from 'react-dom';

import { connect } from 'dva';
import { Row, Col, Card, Tooltip, Menu, Dropdown, Icon, Button,Layout } from 'antd';

import styles from './MapTest.less';

import L from 'leaflet';
import { Map, TileLayer,Marker,Popup } from 'react-leaflet';

import "leaflet/dist/leaflet.css";

const {Content} = Layout;

//把图标重新引入
delete L.Icon.Default.prototype._getIconUrl
L.Icon.Default.imagePath = ''
L.Icon.Default.mergeOptions({
      iconRetinaUrl: require('../../assets/markers/marker-icon-2x.png'),
       iconUrl: require('../../assets/markers/marker-icon.png'),
      shadowUrl: require('../../assets/markers/marker-shadow.png')
})


//处理每一个marker的显示
const PopupMarker = ({ children,position }) => {
const items = children.map((item) => (<span key={item.key}>{item.string}<br /></span>))

return  <Marker position={position}>
  <Popup><div>
  {items}
  </div></Popup>
</Marker>

}
//处理markerlist
const MarkersList = ({markers}) => {
  const items = markers.map(({ key,...props}) => (
    <PopupMarker key={key} {...props} />
  ))
  return <div>{items}</div>
}

export default class SiteMap extends PureComponent {

  render() {

    const position = [22.7047, 113.302];  //中心点

    //模拟数据
   const dataList = [];
   for (let i = 0; i < 46; i += 1) {
     dataList.push({
       id: i,
       Province: '',
       Name: `site ${i}`,
       Lat: 22.7047 + `${i}`,
       Lng: 113.302 - `${i}`,
       currentValue: Math.floor(Math.random() * 1000),
       status: Math.floor(Math.random() * 10) % 2,
       purchaseDate: new Date(`2017-07-${Math.floor(i / 2) + 1}`),
       create_time: new Date(`2017-07-${Math.floor(i / 2) + 1}`),
       progress: Math.ceil(Math.random() * 100),
       Province: Math.floor(Math.random() * 10) % 2 ? '省份1' : '省份2',
       City: Math.floor(Math.random() * 10) % 2 ? '城市1' : '城市2',
     });
   }
    let cellPoints = [];

    dataList.map(item => {
      let lng = Number.parseFloat(item.Lng);
      let lat = Number.parseFloat(item.Lat);
      let name = item.Name;
      let city = item.City || '';
      let district = item.District || '';
      let address = item.Address || '';
      let maintainer = item.Maintainer || '';
      let popupContent = [{key:city,string:`城市:${city}`},
      {key:name,string:`基站名称:${name}`},
      {key:lng,string:`经度:${lng}`},
      {key:lat,string:`纬度:${lat}`},
      {key:district,string:`地区:${district}`},
      {key:address,string:`地址:${address}`},
      {key:maintainer,string:`维护人员:${maintainer}`},
    ]
      cellPoints.push({key:name,position:[lat, lng],children:popupContent});
    });

    const style= {
      width: '100%',
      height: '600px',
    }

    return (
            <Content>
            <div className="ant-card-bordered" style={style}>

            <Map center={position} zoom={13} style={{width: '100%', height: '100%'}}>
                <TileLayer
                url="https://{s}.tile.openstreetmap.org/{z}/{x}/{y}.png"
                />

                <MarkersList markers={cellPoints} />

                </Map>
            </div>
            </Content>
    );
  }
}
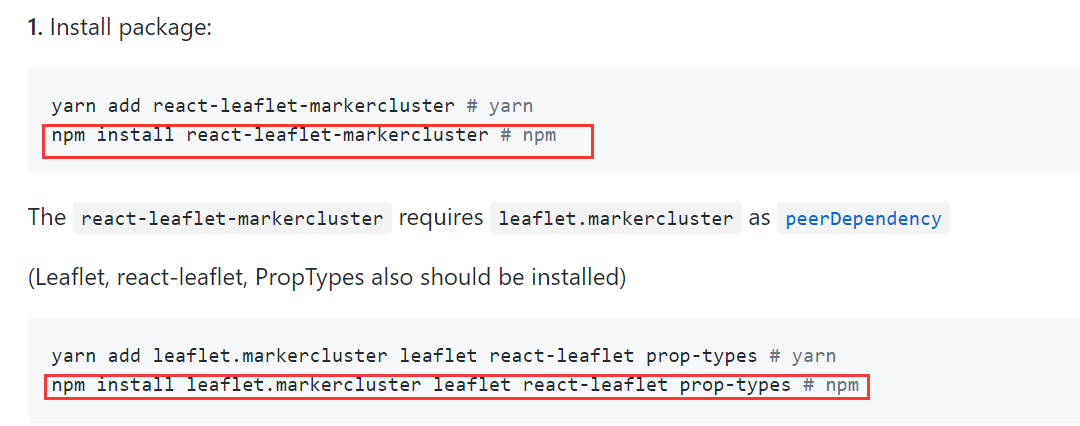
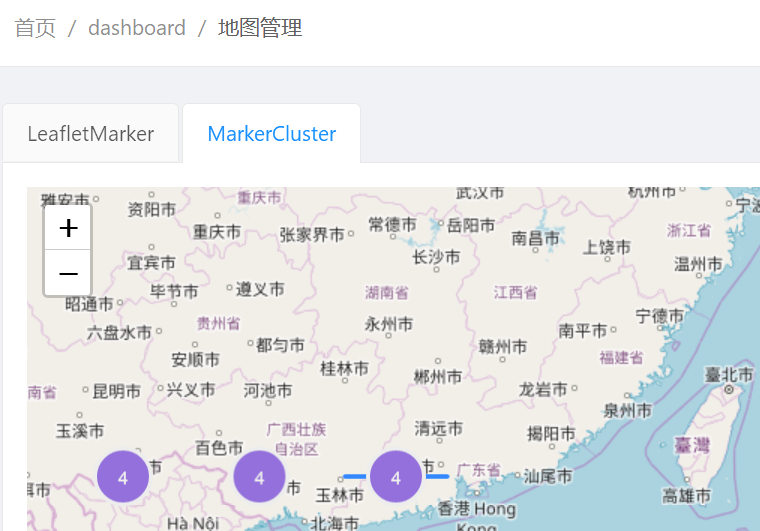
二、使用react-leaflet-markercluster点聚合显示坐标点。
1.注意点:按照github上使用方法安装好。 命令:
npm install react-leaflet-markercluster
npm install leaflet.markercluster leaflet react-leaflet prop-types
2.确保两个都安装上就可以使用了、文档还蛮全的也是案例型、容易使用。我这里也只是简单引用点聚合。我这里的方式是先定义marker样式,然后引用,注意这里要在less文件里写好聚合点样式噢。
import React, { PureComponent, Fragment } from 'react';
import { render } from 'react-dom';

import { connect } from 'dva';
import { Row, Col, Card, Tooltip, Menu, Dropdown, Icon, Button,Layout } from 'antd';

import styles from './MapTest.less';

import L from 'leaflet';
import { Map, TileLayer } from 'react-leaflet';
import MarkerClusterGroup from 'react-leaflet-markercluster';

import "leaflet/dist/leaflet.css";

const {Content} = Layout;

//把图标重新引入
delete L.Icon.Default.prototype._getIconUrl
L.Icon.Default.imagePath = ''
L.Icon.Default.mergeOptions({
      iconRetinaUrl: require('../../assets/markers/marker-icon-2x.png'),
       iconUrl: require('../../assets/markers/marker-icon.png'),
      shadowUrl: require('../../assets/markers/marker-shadow.png')
})

// @connect(({ site, loading }) => ({
//   site,
//   loading: loading.models.site,
// }))
export default class SiteMap extends PureComponent {
  // componentDidMount() {
  //   const { dispatch } = this.props;
  //   dispatch({
  //     type: 'site/fetch',
  //   });
  // }
  render() {
  //  const { site:{data}, loading } = this.props;

    const position = [22.7047, 113.302];

    //const dataList = { data }.data.list;
    const dataList = [];
    for (let i = 0; i < 46; i += 1) {
      dataList.push({
        id: i,
        Province: '',
        Name: `site ${i}`,
        Lat: 22.7047 + `${i}`,
        Lng: 113.302 - `${i}`,
        currentValue: Math.floor(Math.random() * 1000),
        status: Math.floor(Math.random() * 10) % 2,
        purchaseDate: new Date(`2017-07-${Math.floor(i / 2) + 1}`),
        create_time: new Date(`2017-07-${Math.floor(i / 2) + 1}`),
        progress: Math.ceil(Math.random() * 100),
        Province: Math.floor(Math.random() * 10) % 2 ? '省份1' : '省份2',
        City: Math.floor(Math.random() * 10) % 2 ? '城市1' : '城市2',
      });
    }
    let cellPoints = [];

    const sytlep = {
      width:'100%',
    }

    dataList.map(item => {
      let lng = Number.parseFloat(item.Lng);
      let lat = Number.parseFloat(item.Lat);
      let name = item.Name;
      let city = item.City || '';
      let district = item.District || '';
      let Address = item.Address || '';
      let maintainer = item.Maintainer || '';
      let popupDiv = `<div style={stylep}>
      <span>城市:${city}</span>
      <br />
      <span>基站名称:${name}</span>
      <br />
      <span>经度:${lng}</span>
      <br />
      <span>纬度:${lat}</span>
      <br />
      <span>地区:${district}</span>
      <br />
      <span>地址:${Address}</span>
      <br />
      <span>维护人员:${maintainer}</span>
      <br />
      </div>`
      cellPoints.push({position:[lat, lng],popup:popupDiv});
    });

    const style= {
      width: '100%',
      height: '600px',
    }

    //定义聚合点样式
    const createClusterCustomIcon = function (cluster) {
      return L.divIcon({
        html: `<span>${cluster.getChildCount()}</span>`,
        className: styles.markercustom,
        iconSize: L.point(40, 40, true)
      });
    };

    return (
            <Content>
            <div className="ant-card-bordered" style={style}>

            <Map className={styles.markercluster} center={position} zoom={13} style={{width: '100%', height: '100%'}}>
                <TileLayer
                url="https://{s}.tile.openstreetmap.org/{z}/{x}/{y}.png"
                />

                <MarkerClusterGroup
                spiderfyDistanceMultiplier={2}
                iconCreateFunction={createClusterCustomIcon}
                markers={cellPoints}
                />

                </Map>
            </div>
            </Content>
    );
  }
}
总结:
这里要注意记得把marker的图片文件夹放入src/assets里面,不然会跑不起来的。
两种用法文档都有比较详细的代码可以参考。如果出不来效果多研究研究。
具体项目中的使用可以参考我的github的demo,会持续更新丰富。

 浙公网安备 33010602011771号