
ELK【elasticsearch,kibana,logstash】安装部署
1,准备linux虚拟机环境(CentOS 7)本次安装用的是ELK7.2.0的版本(版本一定要一致)
2,先在linux安装java环境
//查找安装列表
yum -y list java*
//安装
yum install java-1.8.0-openjdk.x86_64
//完成安装后验证
java -version
3,安装elasticsearch-7.2.0
将elasticsearch-7.2.0-linux-x86_64.tar.gz 解压到linux安装的目录下
3.1,这里需要新建一个es启动账户,安全策略es不允许root启动
//关闭防火墙
systemctl stop firewalld.service
//禁止防火墙开机启动
systemctl disable firewalld.service
//添加用户
useradd es -g es -p es
//给用户添加目录的启动权限
chown -R es:es /data/es/elasticsearch-6.8.0
//切换到es账户
su es
3.2,修改elasticsearch配置文件,elasticsearch/config/jvm.options

配置elasticsearch启动的最大最小内存,测试默认为1G ,他推荐的是4G ,这里根据具体的业务需求配置大小
3.3,配置elasticsearch/config/elasticsearch.yml
node.name: node-1 //单节点名称
network.host: 0.0.0.0 //配置外网可访问
http.port: 9200         //默认端口号
cluster.initial_master_nodes: node-1 //主节点名称
3.4,启动错误
[1]: max file descriptors [4096] for elasticsearch process is too low, increase to at least [65536]
[2]: max number of threads [3818] for user [es] is too low, increase to at least [4096]
这里需要修改linux系统允许的最多文件,最大进程的许可
在 /etc/security/limits.conf 追加系统配置
//* 标识所有的系统用户有效
* hard nofile 655360
* soft nofile 131072
* hard nproc 4096
* hard nproc 2048
[3]: max virtual memory areas vm.max_map_count [65530] is too low, increase to at least [262144]
在/etc/sysctl.conf追加 授权使用更大的内存
vm.max_map_count=655360
fs.file-max=655360
3.5 切换到elasticsearch/bin文件夹下。使用es账户启动
//直接运行
sh ./elasticsearch
//后台运行
nohup ./elasticsearch &
3.6 验证安装成功
在浏览器访问http://IP:9200/
{
  "name" : "node-1",
  "cluster_name" : "elasticsearch",
  "cluster_uuid" : "a4_P0BS9TpuAZ1RslXEATQ",
  "version" : {
    "number" : "7.2.0",
    "build_flavor" : "default",
    "build_type" : "tar",
    "build_hash" : "508c38a",
    "build_date" : "2019-06-20T15:54:18.811730Z",
    "build_snapshot" : false,
    "lucene_version" : "8.0.0",
    "minimum_wire_compatibility_version" : "6.8.0",
    "minimum_index_compatibility_version" : "6.0.0-beta1"
  },
  "tagline" : "You Know, for Search"
}
查看集群状态http://IP/_cat/health
1594953433 02:37:13 elasticsearch green 1 1 2 2 0 0 0 0 - 100.0%
4,安装kibana-7.2.0
将kibana-7.2.0-linux-x86_64.tar.gz 解压到linux安装的目录下
1,配置kibana/config/kibana.yml
//Kibana默然端口
server.port: 5601
//授权访问
server.host: "0.0.0.0"
//es地址,数据来源
elasticsearch.hosts: ["http://ip:9200"]
2,启动Kibana,进入Kibana/Bin
//直接运行
sh ./Kibana
//后台运行
nohup ./Kibana &
3,验证是否安装成功http://ip:5601

5,安装logstash-7.2.0
5.1,解压到安装目录
5.2,在config下创建启动配置文件
vi logstash-startup.config
//写入配置
input {
stdin{}
}
output {
stdout{codec=>"rubydebug"}
}
//启动测试
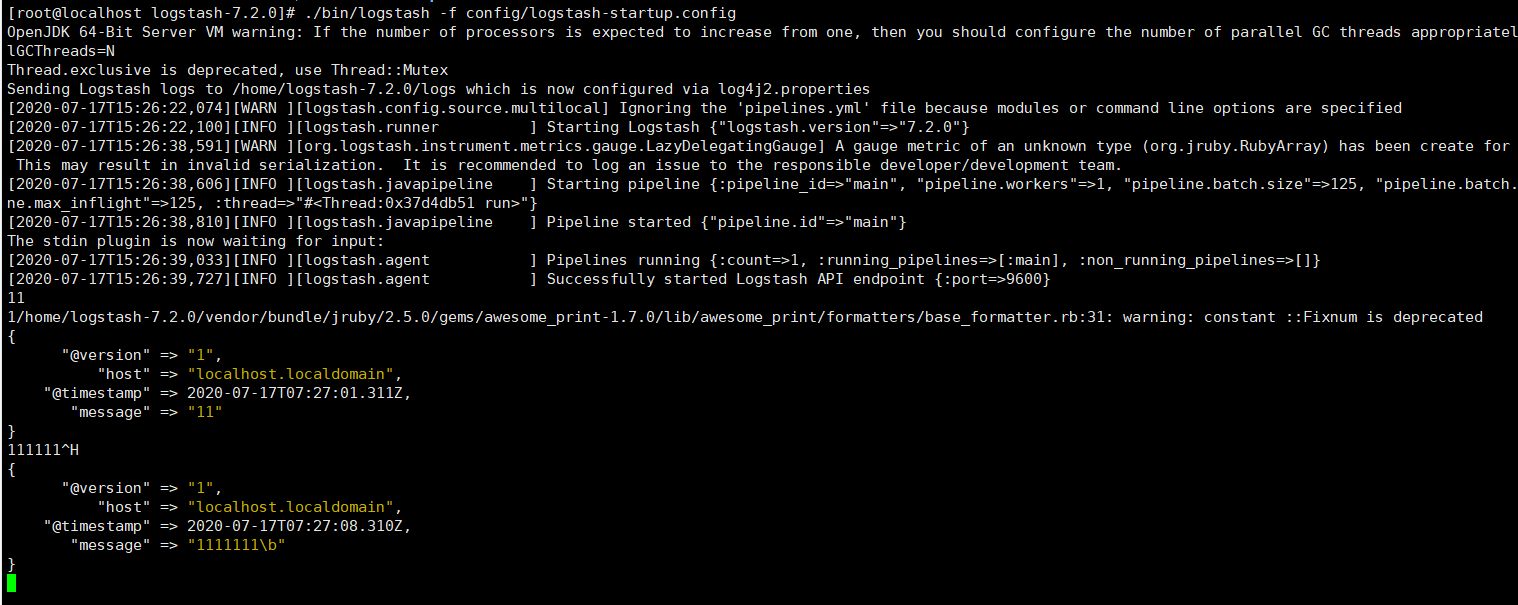
./bin/logstash -f config/logstash-startup.config
5.3,输入测试文本,经过logstash的收集处理, 成功输出给命令行
配置logstash接收来自filebeat的json数据
input {
  beats {
    #监测的端口
    port => 5044
    codec => json     # 直接将filebeat保存在message中的json字串解析出来
  }
}
filter {
  json {
    source => "message"
  }
}
output {
  elasticsearch {
    hosts => ["ip:9200"]
    codec => json{
         charset => "UTF-8"
    }
    index => "log_visit"
  }
  stdout{codec=>"rubydebug"}
}
本文来自博客园,作者:方金,转载请注明原文链接:https://www.cnblogs.com/Gold-fangjin/p/13328462.html

 浙公网安备 33010602011771号