//xaml
<Window x:Class="WpfApp11.MainWindow"
xmlns="http://schemas.microsoft.com/winfx/2006/xaml/presentation"
xmlns:x="http://schemas.microsoft.com/winfx/2006/xaml"
xmlns:d="http://schemas.microsoft.com/expression/blend/2008"
xmlns:mc="http://schemas.openxmlformats.org/markup-compatibility/2006"
xmlns:local="clr-namespace:WpfApp11"
mc:Ignorable="d"
Title="Simple Line Chart" Height="450" Width="800">
<Grid Margin="0"
x:Name="chartGrid"
ClipToBounds="True"
Background="Transparent"
SizeChanged="Grid_SizeChanged">
<Border HorizontalAlignment="Center"
VerticalAlignment="Center"
BorderBrush="Gray"
BorderThickness="1"
Background="White"
Margin="0">
<Canvas Margin="0"
x:Name="chartCanvas"
ClipToBounds="True"
Background="Transparent">
</Canvas>
</Border>
</Grid>
</Window>
//cs
using System.Text;
using System.Windows;
using System.Windows.Controls;
using System.Windows.Data;
using System.Windows.Documents;
using System.Windows.Input;
using System.Windows.Media;
using System.Windows.Media.Imaging;
using System.Windows.Navigation;
using System.Windows.Shapes;
namespace WpfApp11
{
/// <summary>
/// Interaction logic for MainWindow.xaml
/// </summary>
public partial class MainWindow : Window
{
private double xmin = 0;
private double xmax = 6.5;
private double ymin = -1.1;
private double ymax = 1.1;
private Polyline pl;
public MainWindow()
{
InitializeComponent();
}
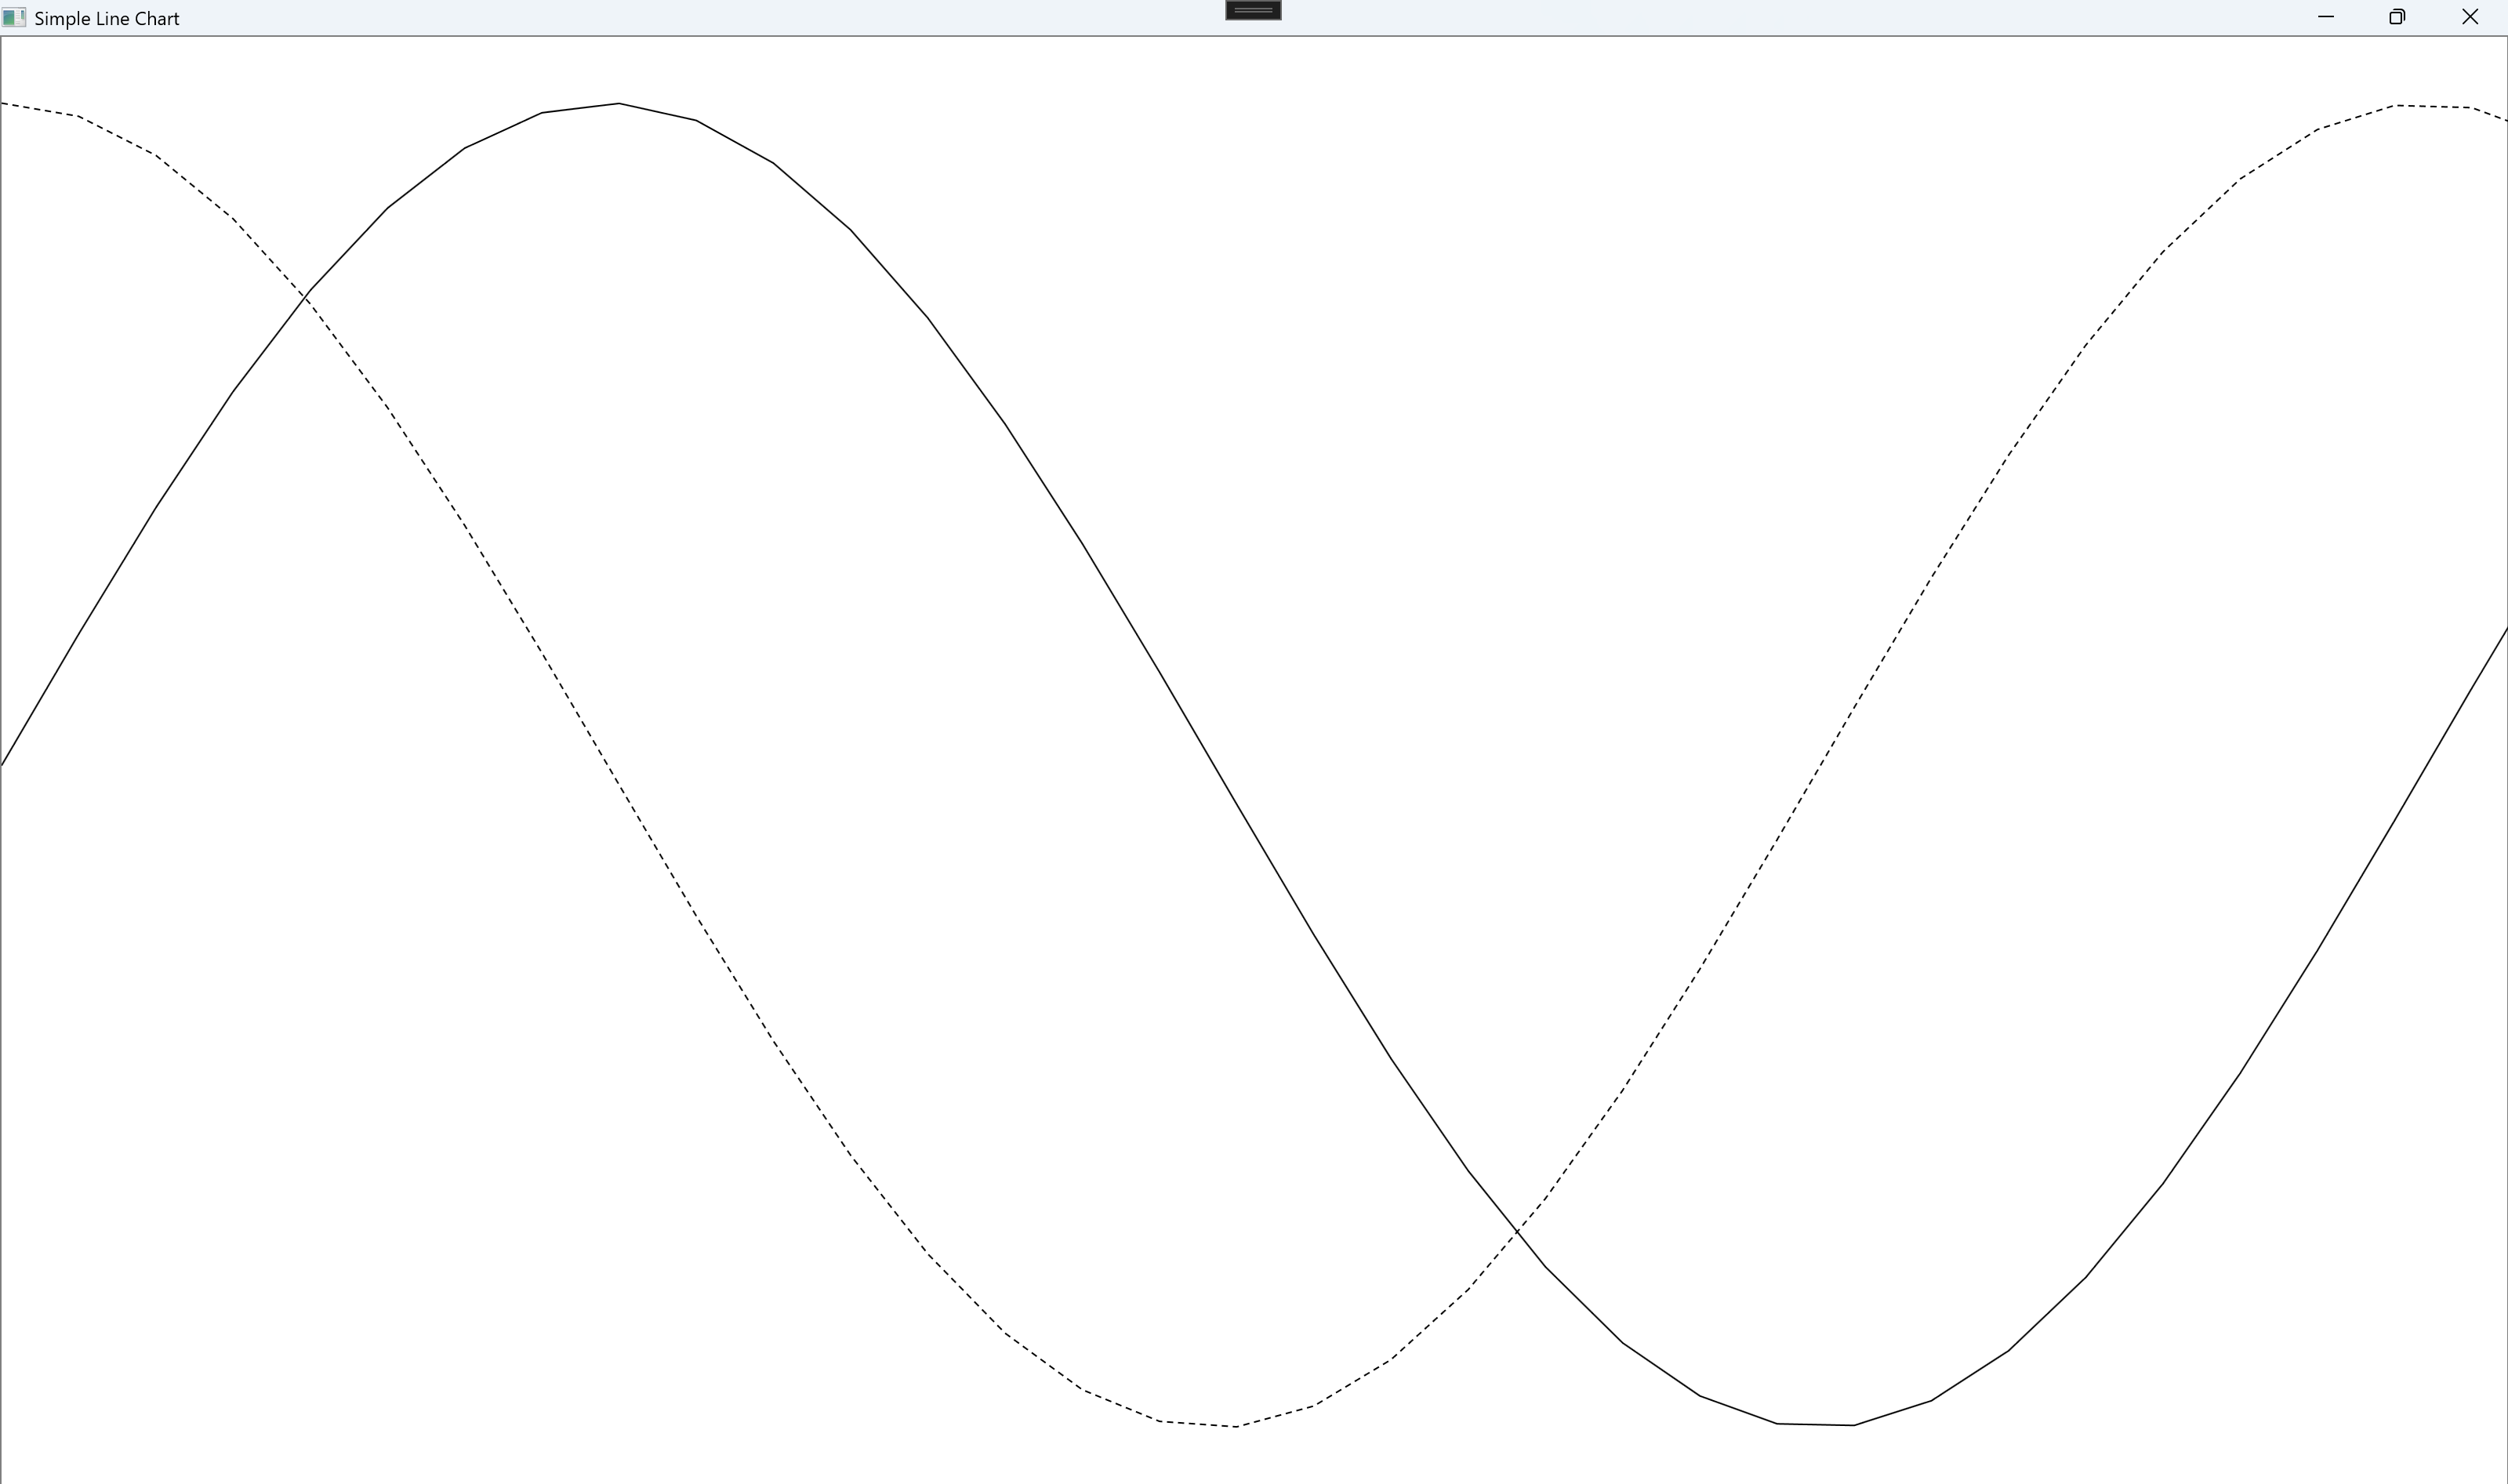
private void AddChart()
{
pl=new Polyline();
pl.Stroke=Brushes.Black;
for (int i = 0; i<70; i++)
{
double x = i/5.0;
double y = Math.Sin(x);
pl.Points.Add(NormalizePoint(new Point(x, y)));
}
chartCanvas.Children.Add(pl);
//Draw cosine curve
pl=new Polyline();
pl.Stroke=Brushes.Black;
pl.StrokeDashArray=new DoubleCollection(new double[] { 4, 3 });
for(int i=0;i<70;i++)
{
double x = i/5.0;
double y = Math.Cos(x);
pl.Points.Add(NormalizePoint(new Point(x, y)));
}
chartCanvas.Children.Add(pl);
}
private Point NormalizePoint(Point pt)
{
Point result=new Point();
result.X=(pt.X-xmin)*chartCanvas.Width/(xmax-xmin);
result.Y=chartCanvas.Height-(pt.Y-ymin)*chartCanvas.Height/(ymax-ymin);
return result;
}
private void Grid_SizeChanged(object sender, SizeChangedEventArgs e)
{
chartCanvas.Width=chartGrid.ActualWidth;
chartCanvas.Height=chartGrid.ActualHeight;
chartCanvas.Children.Clear();
AddChart();
}
}
}
![image]()

 浙公网安备 33010602011771号