install-package Microsoft.Windows.Compatibility

install-package System.Windows.Forms -version 4.0.0.0

install-package System.Data.SqlClient --version 4.9.0

install-package System.Windows.Forms.DataVisualization -version 1.0.0-prerelease.19212.2
//csproj.csproj

<Project Sdk="Microsoft.NET.Sdk">

  <PropertyGroup>
    <OutputType>WinExe</OutputType>
    <TargetFramework>net8.0-windows</TargetFramework>
    <UseWindowsForms>true</UseWindowsForms>
    <Nullable>enable</Nullable>
    <ImplicitUsings>enable</ImplicitUsings>
    <UseWPF>true</UseWPF>
  </PropertyGroup>

<ItemGroup>
    <PackageReference Include="Microsoft.Windows.Compatibility" Version="9.0.6" />
    <PackageReference Include="System.Data.SqlClient" Version="4.9.0" />
    <PackageReference Include="System.Windows.Forms" />
    <PackageReference Include="System.Windows.Forms.DataVisualization" Version="1.0.0-prerelease.19212.2" />
  </ItemGroup>
</Project>
public partial class App : System.Windows.Application
{
}
namespace System.Windows.Forms.DataVisualization.Charting
{
    public enum SeriesChartType
    {
        Point = 0,
        FastPoint = 1,
        Bubble = 2,
        Line = 3,
        Spline = 4,
        StepLine = 5,
        FastLine = 6,
        Bar = 7,
        StackedBar = 8,
        StackedBar100 = 9,
        Column = 10,
        StackedColumn = 11,
        StackedColumn100 = 12,
        Area = 13,
        SplineArea = 14,
        StackedArea = 15,
        StackedArea100 = 16,
        Pie = 17,
        Doughnut = 18,
        Stock = 19,
        Candlestick = 20,
        Range = 21,
        SplineRange = 22,
        RangeBar = 23,
        RangeColumn = 24,
        Radar = 25,
        Polar = 26,
        ErrorBar = 27,
        BoxPlot = 28,
        Renko = 29,
        ThreeLineBreak = 30,
        Kagi = 31,
        PointAndFigure = 32,
        Funnel = 33,
        Pyramid = 34
    }
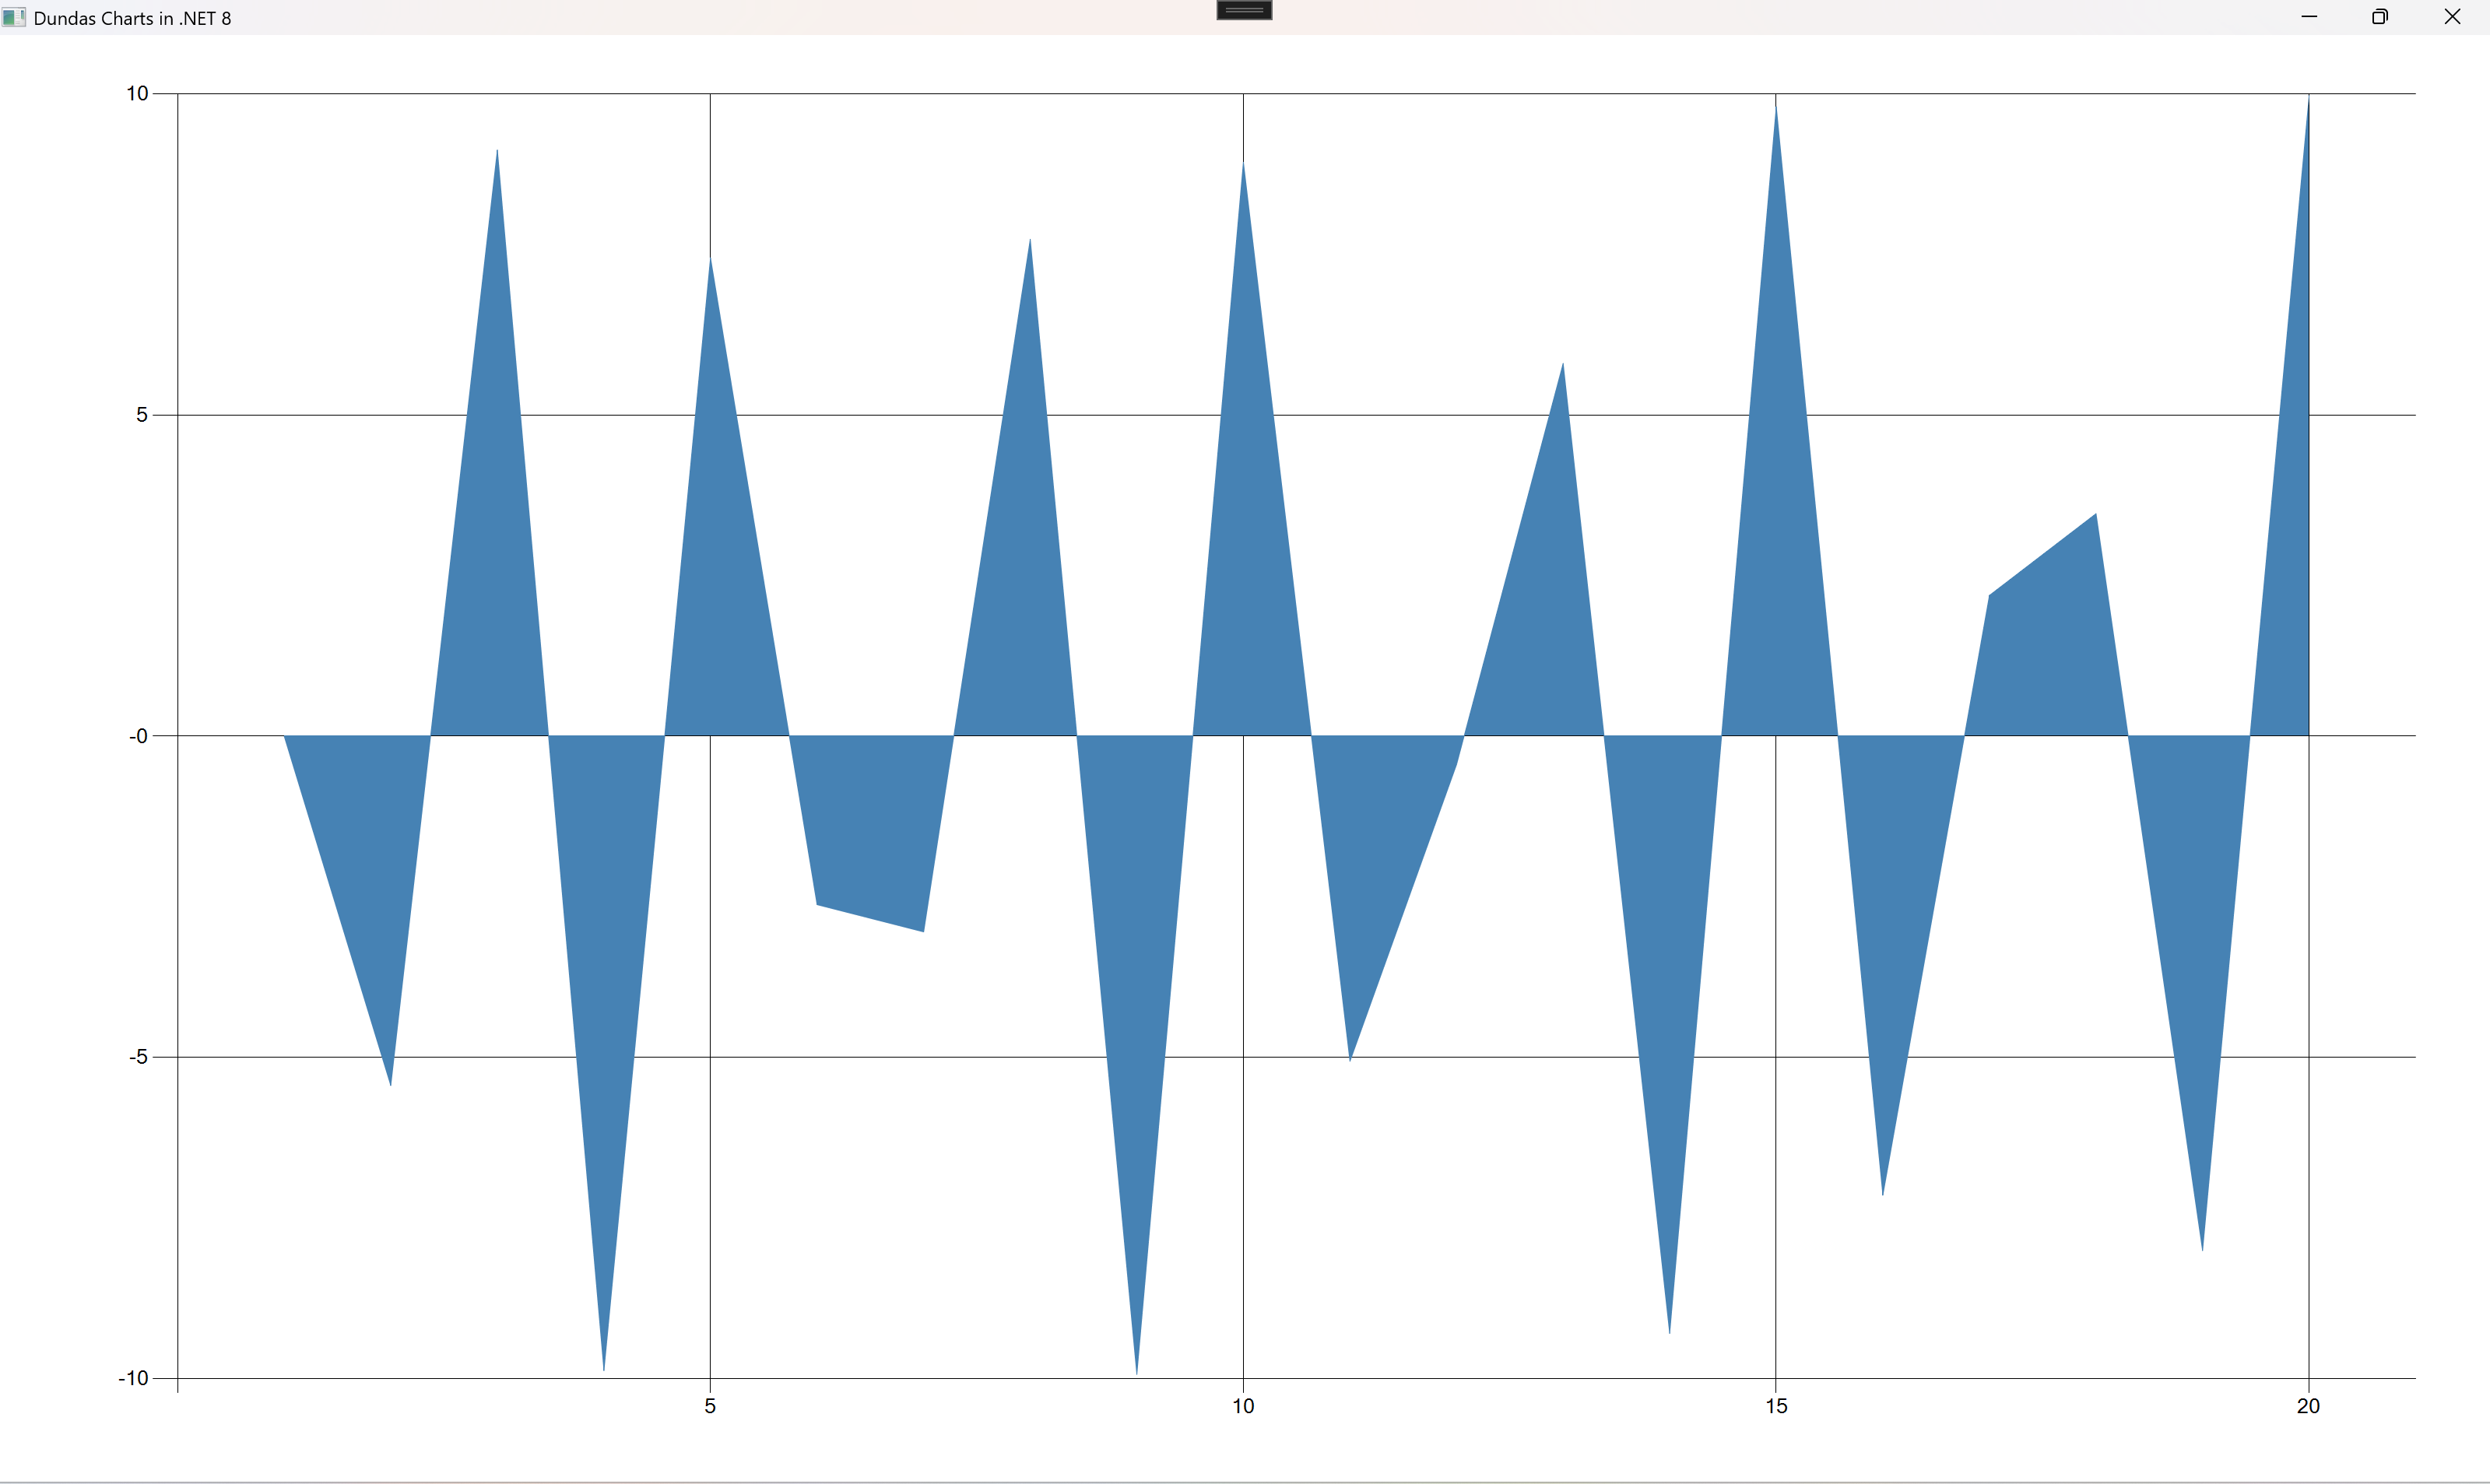
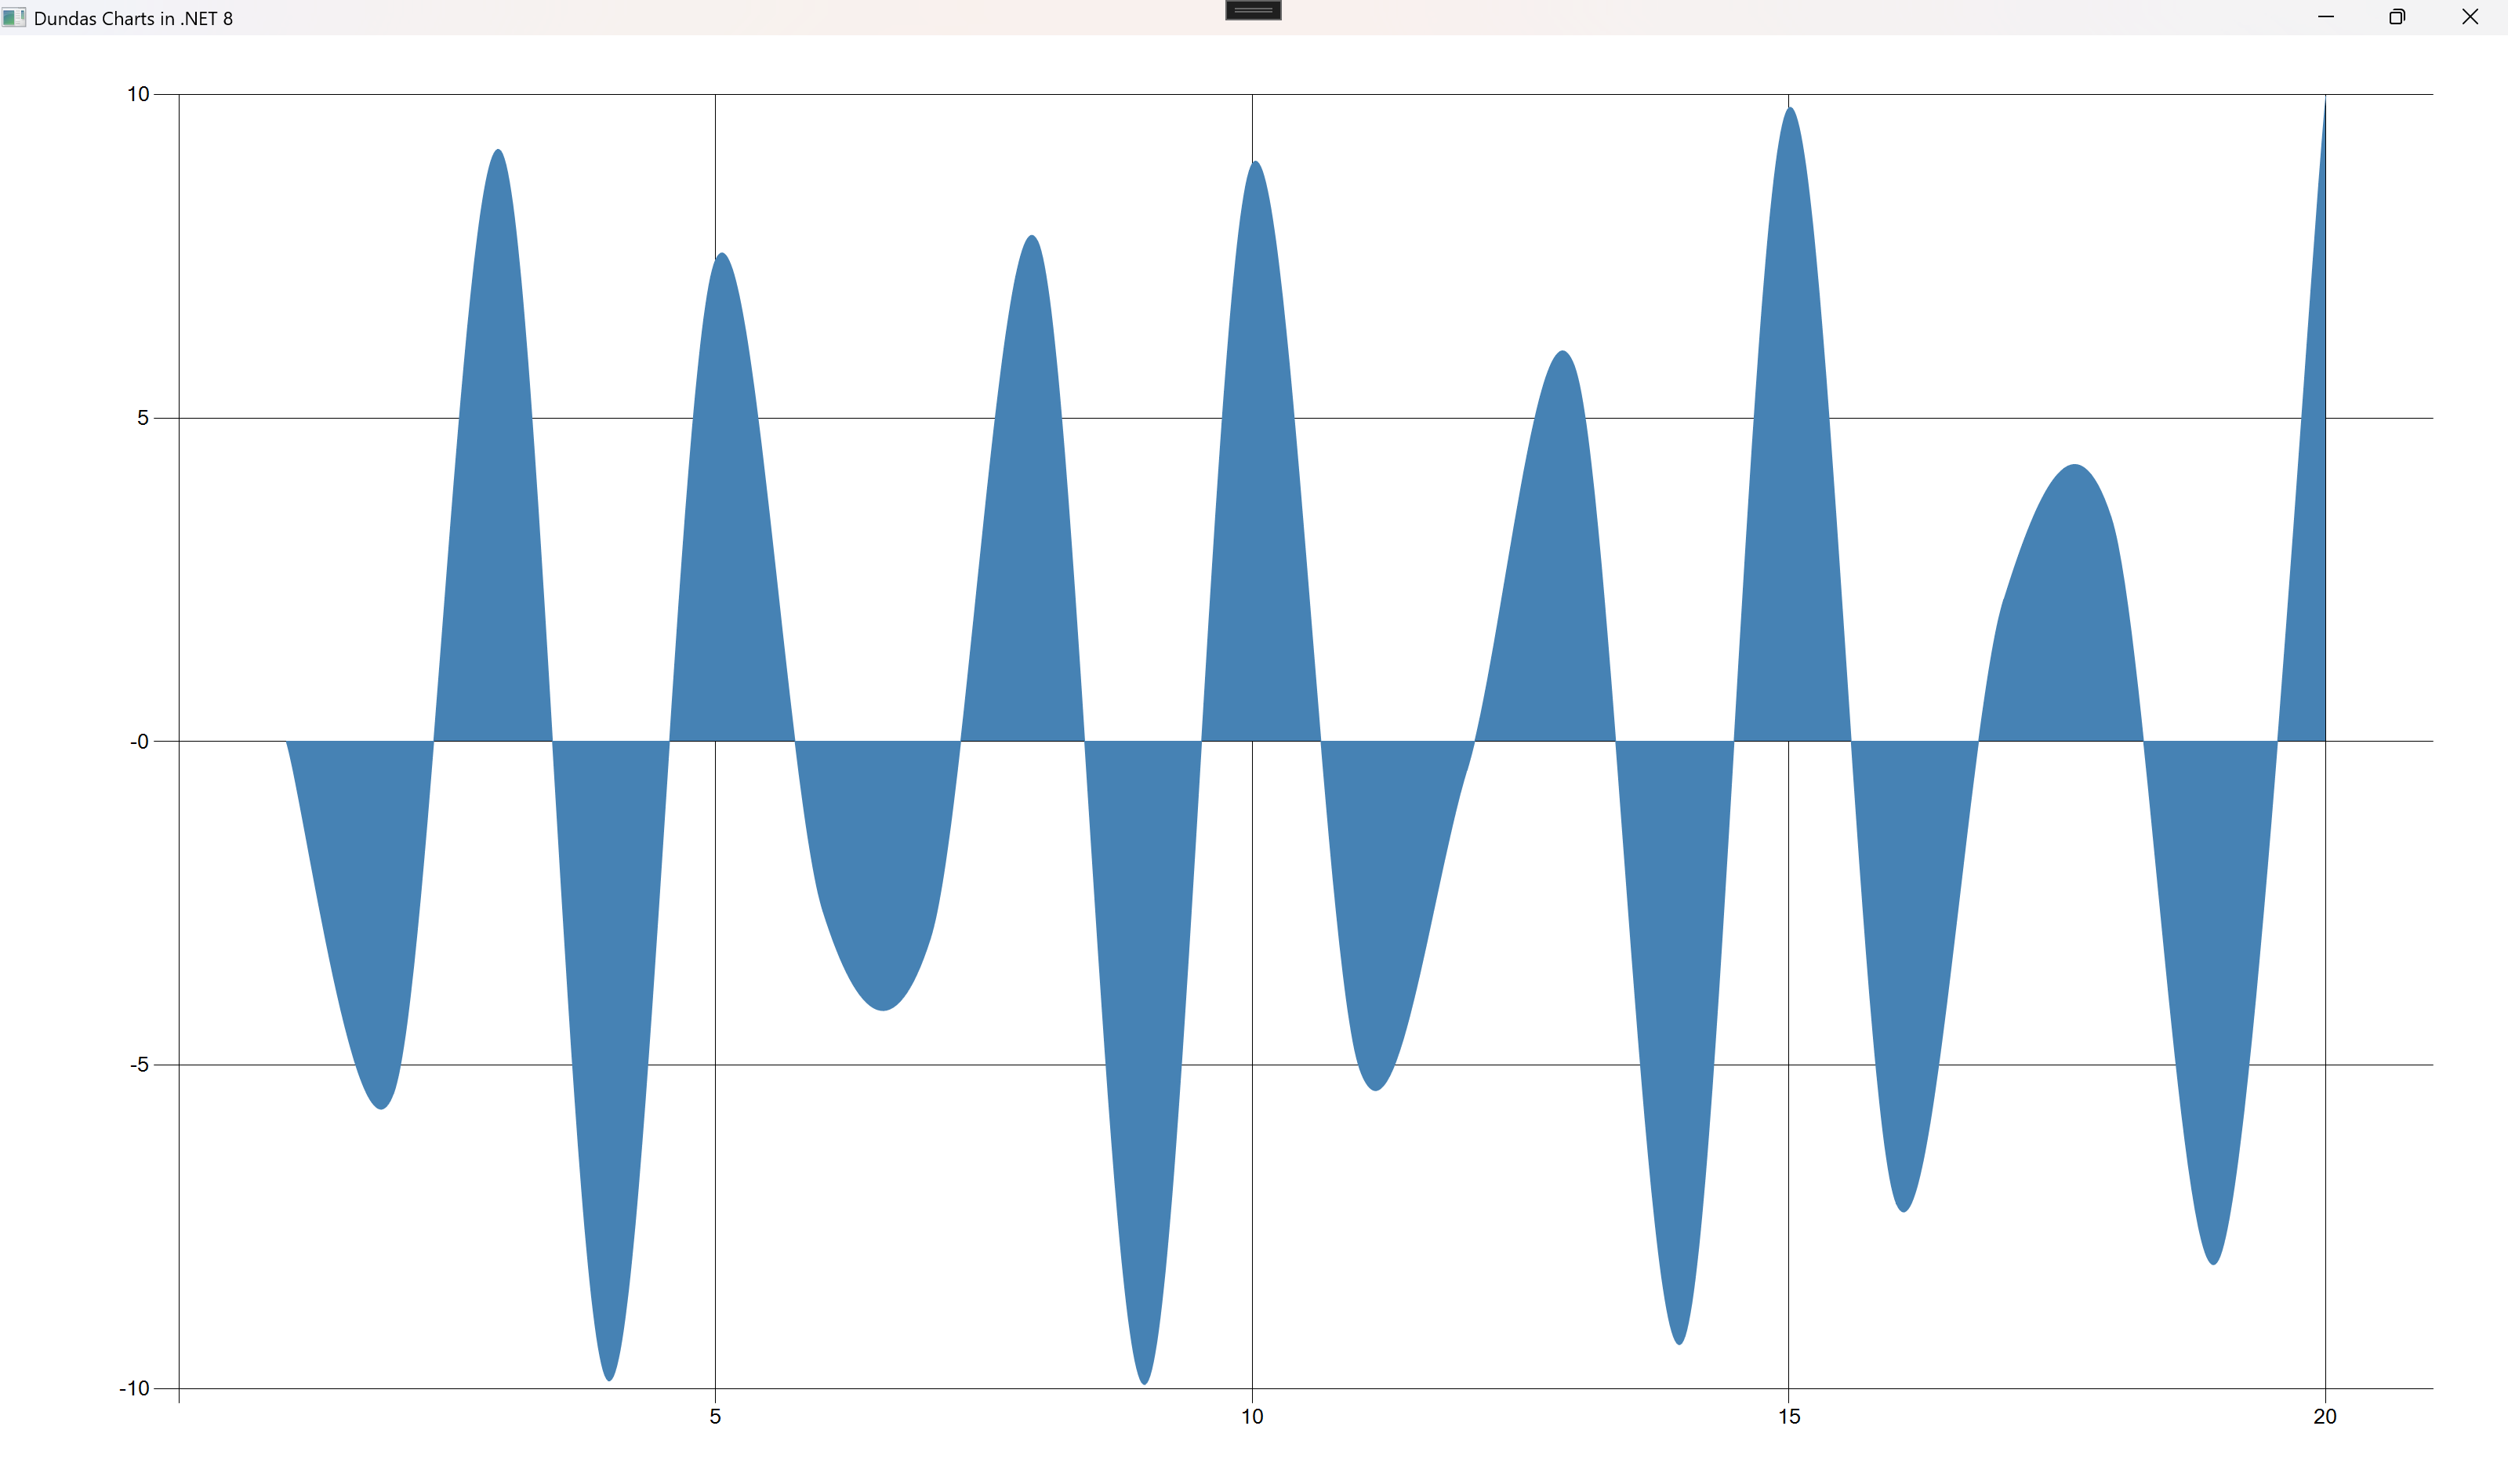
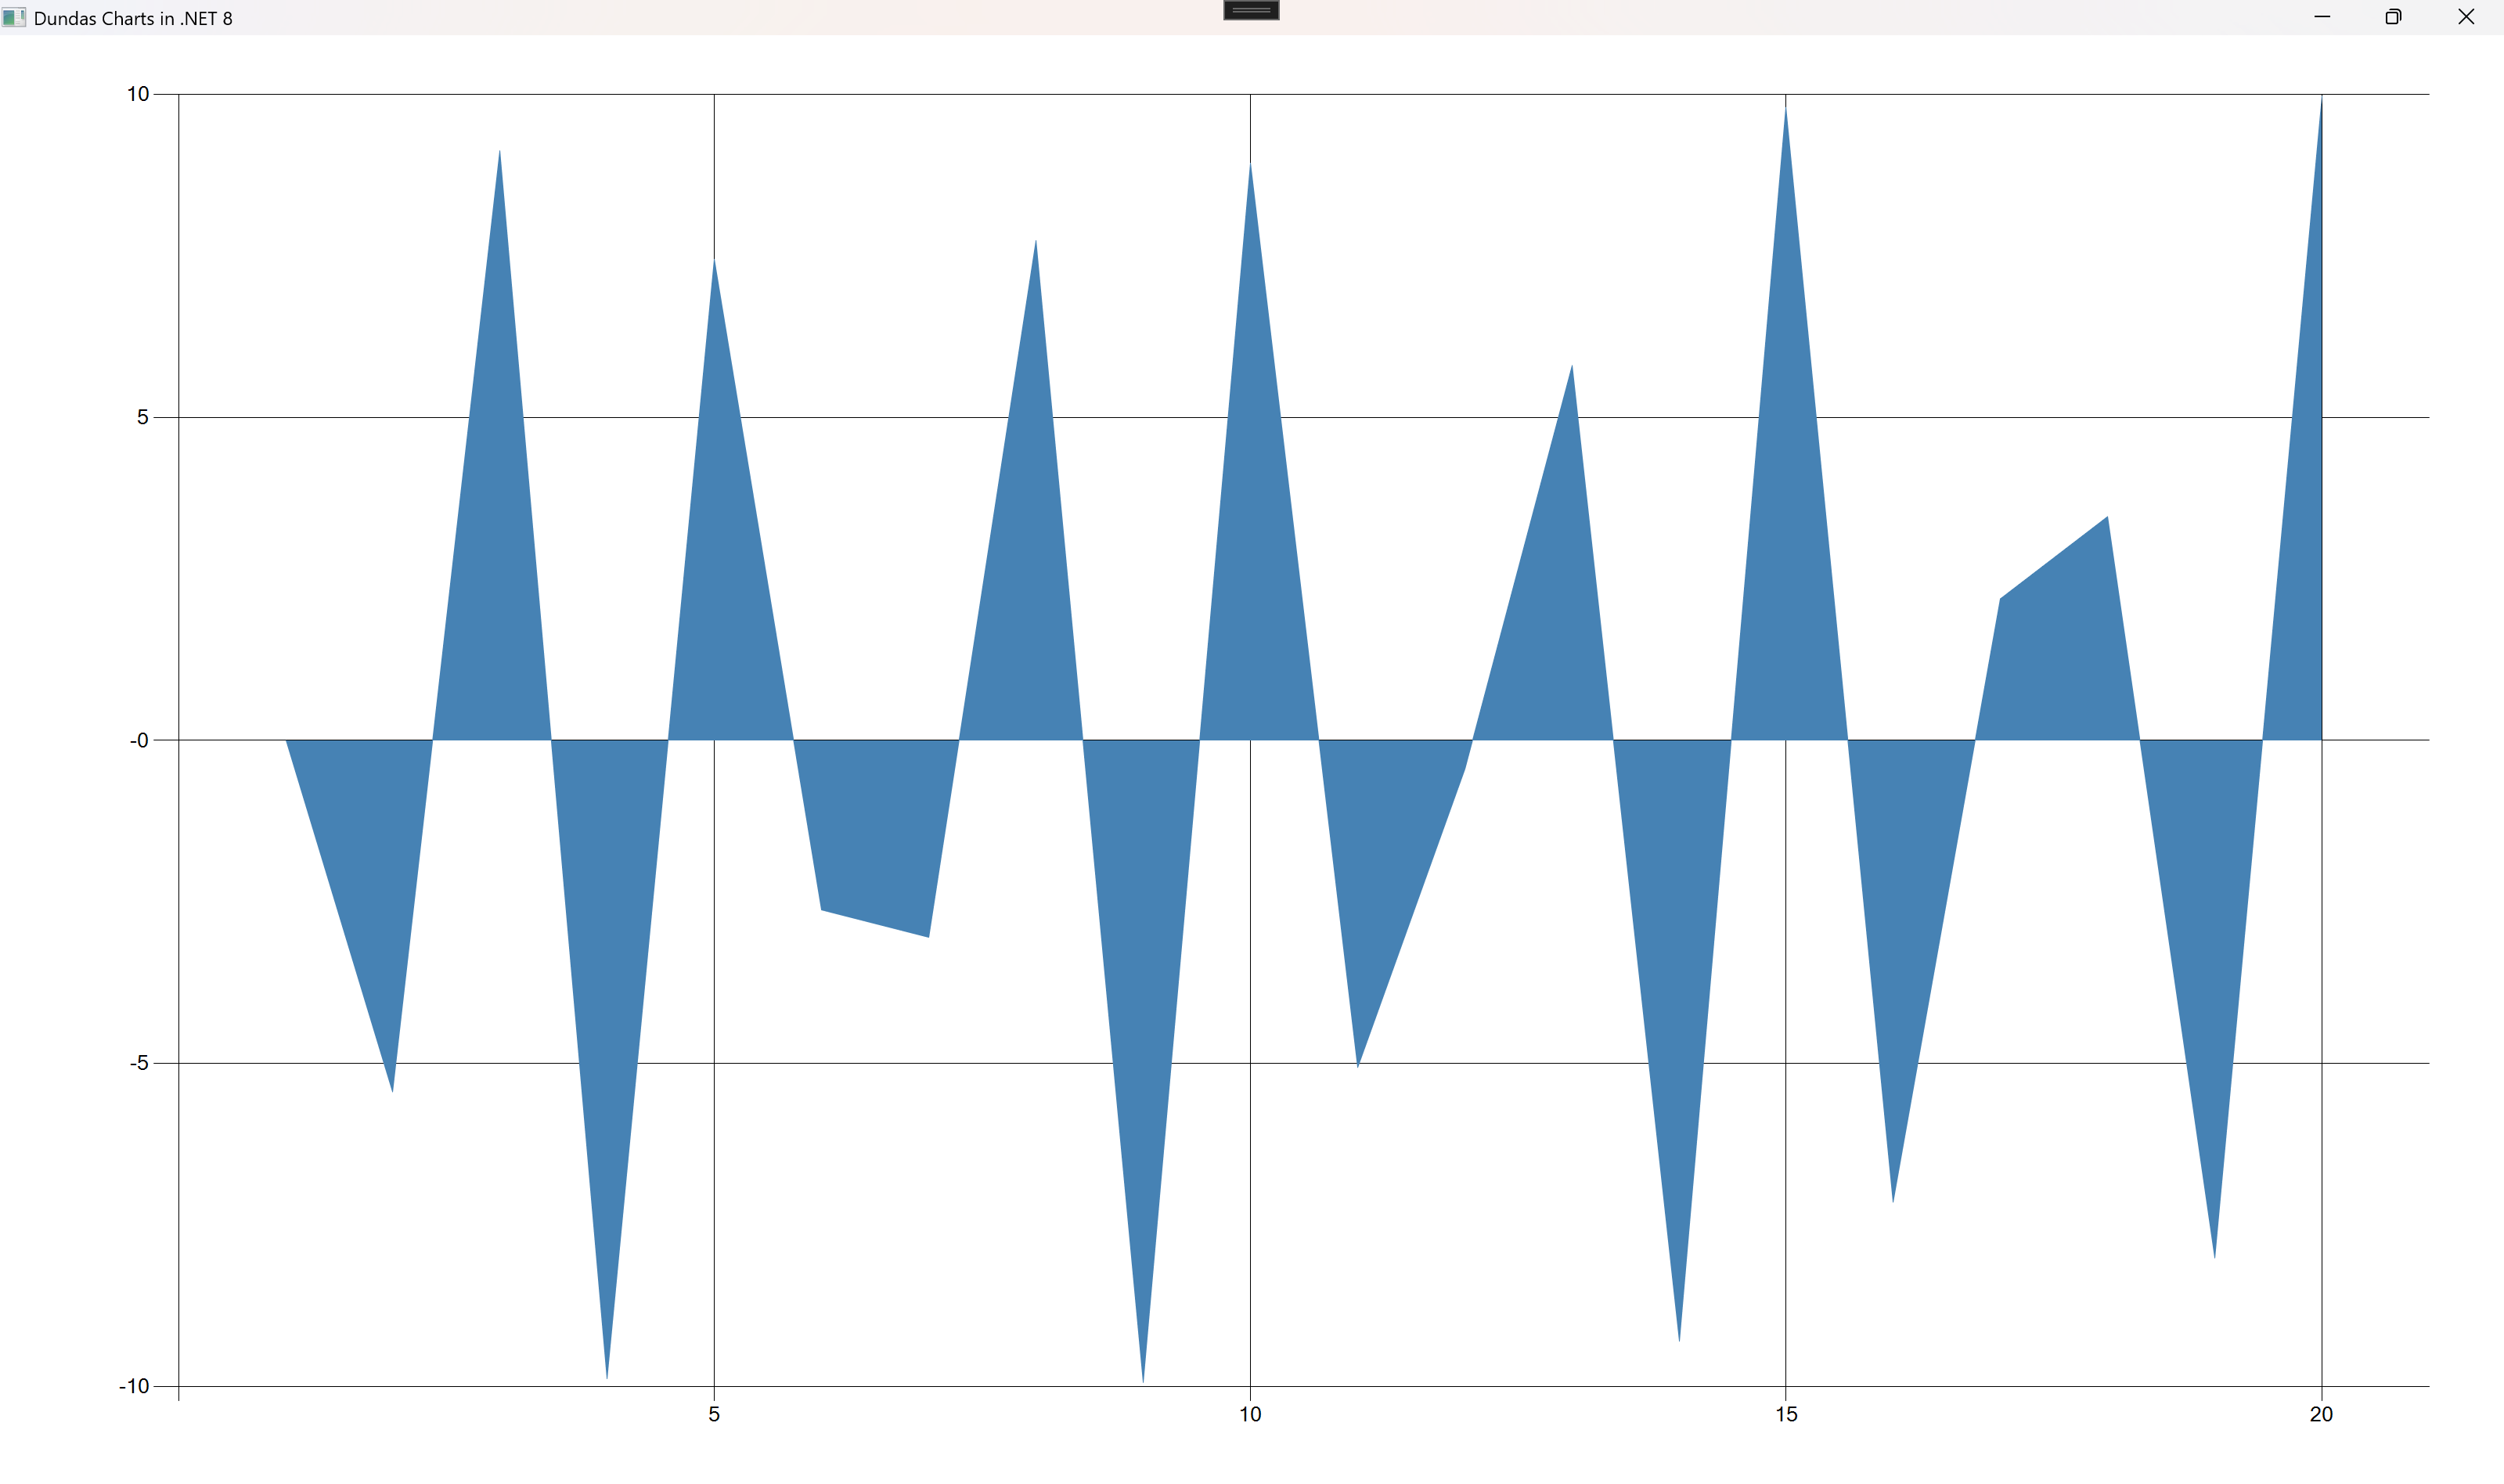
series.ChartType = SeriesChartType.Area;
![]()
series.ChartType = SeriesChartType.Bar;
![]()
series.ChartType = SeriesChartType.BoxPlot;
![]()
series.ChartType = SeriesChartType.Bubble;
![]()
series.ChartType = SeriesChartType.Candlestick;
![]()
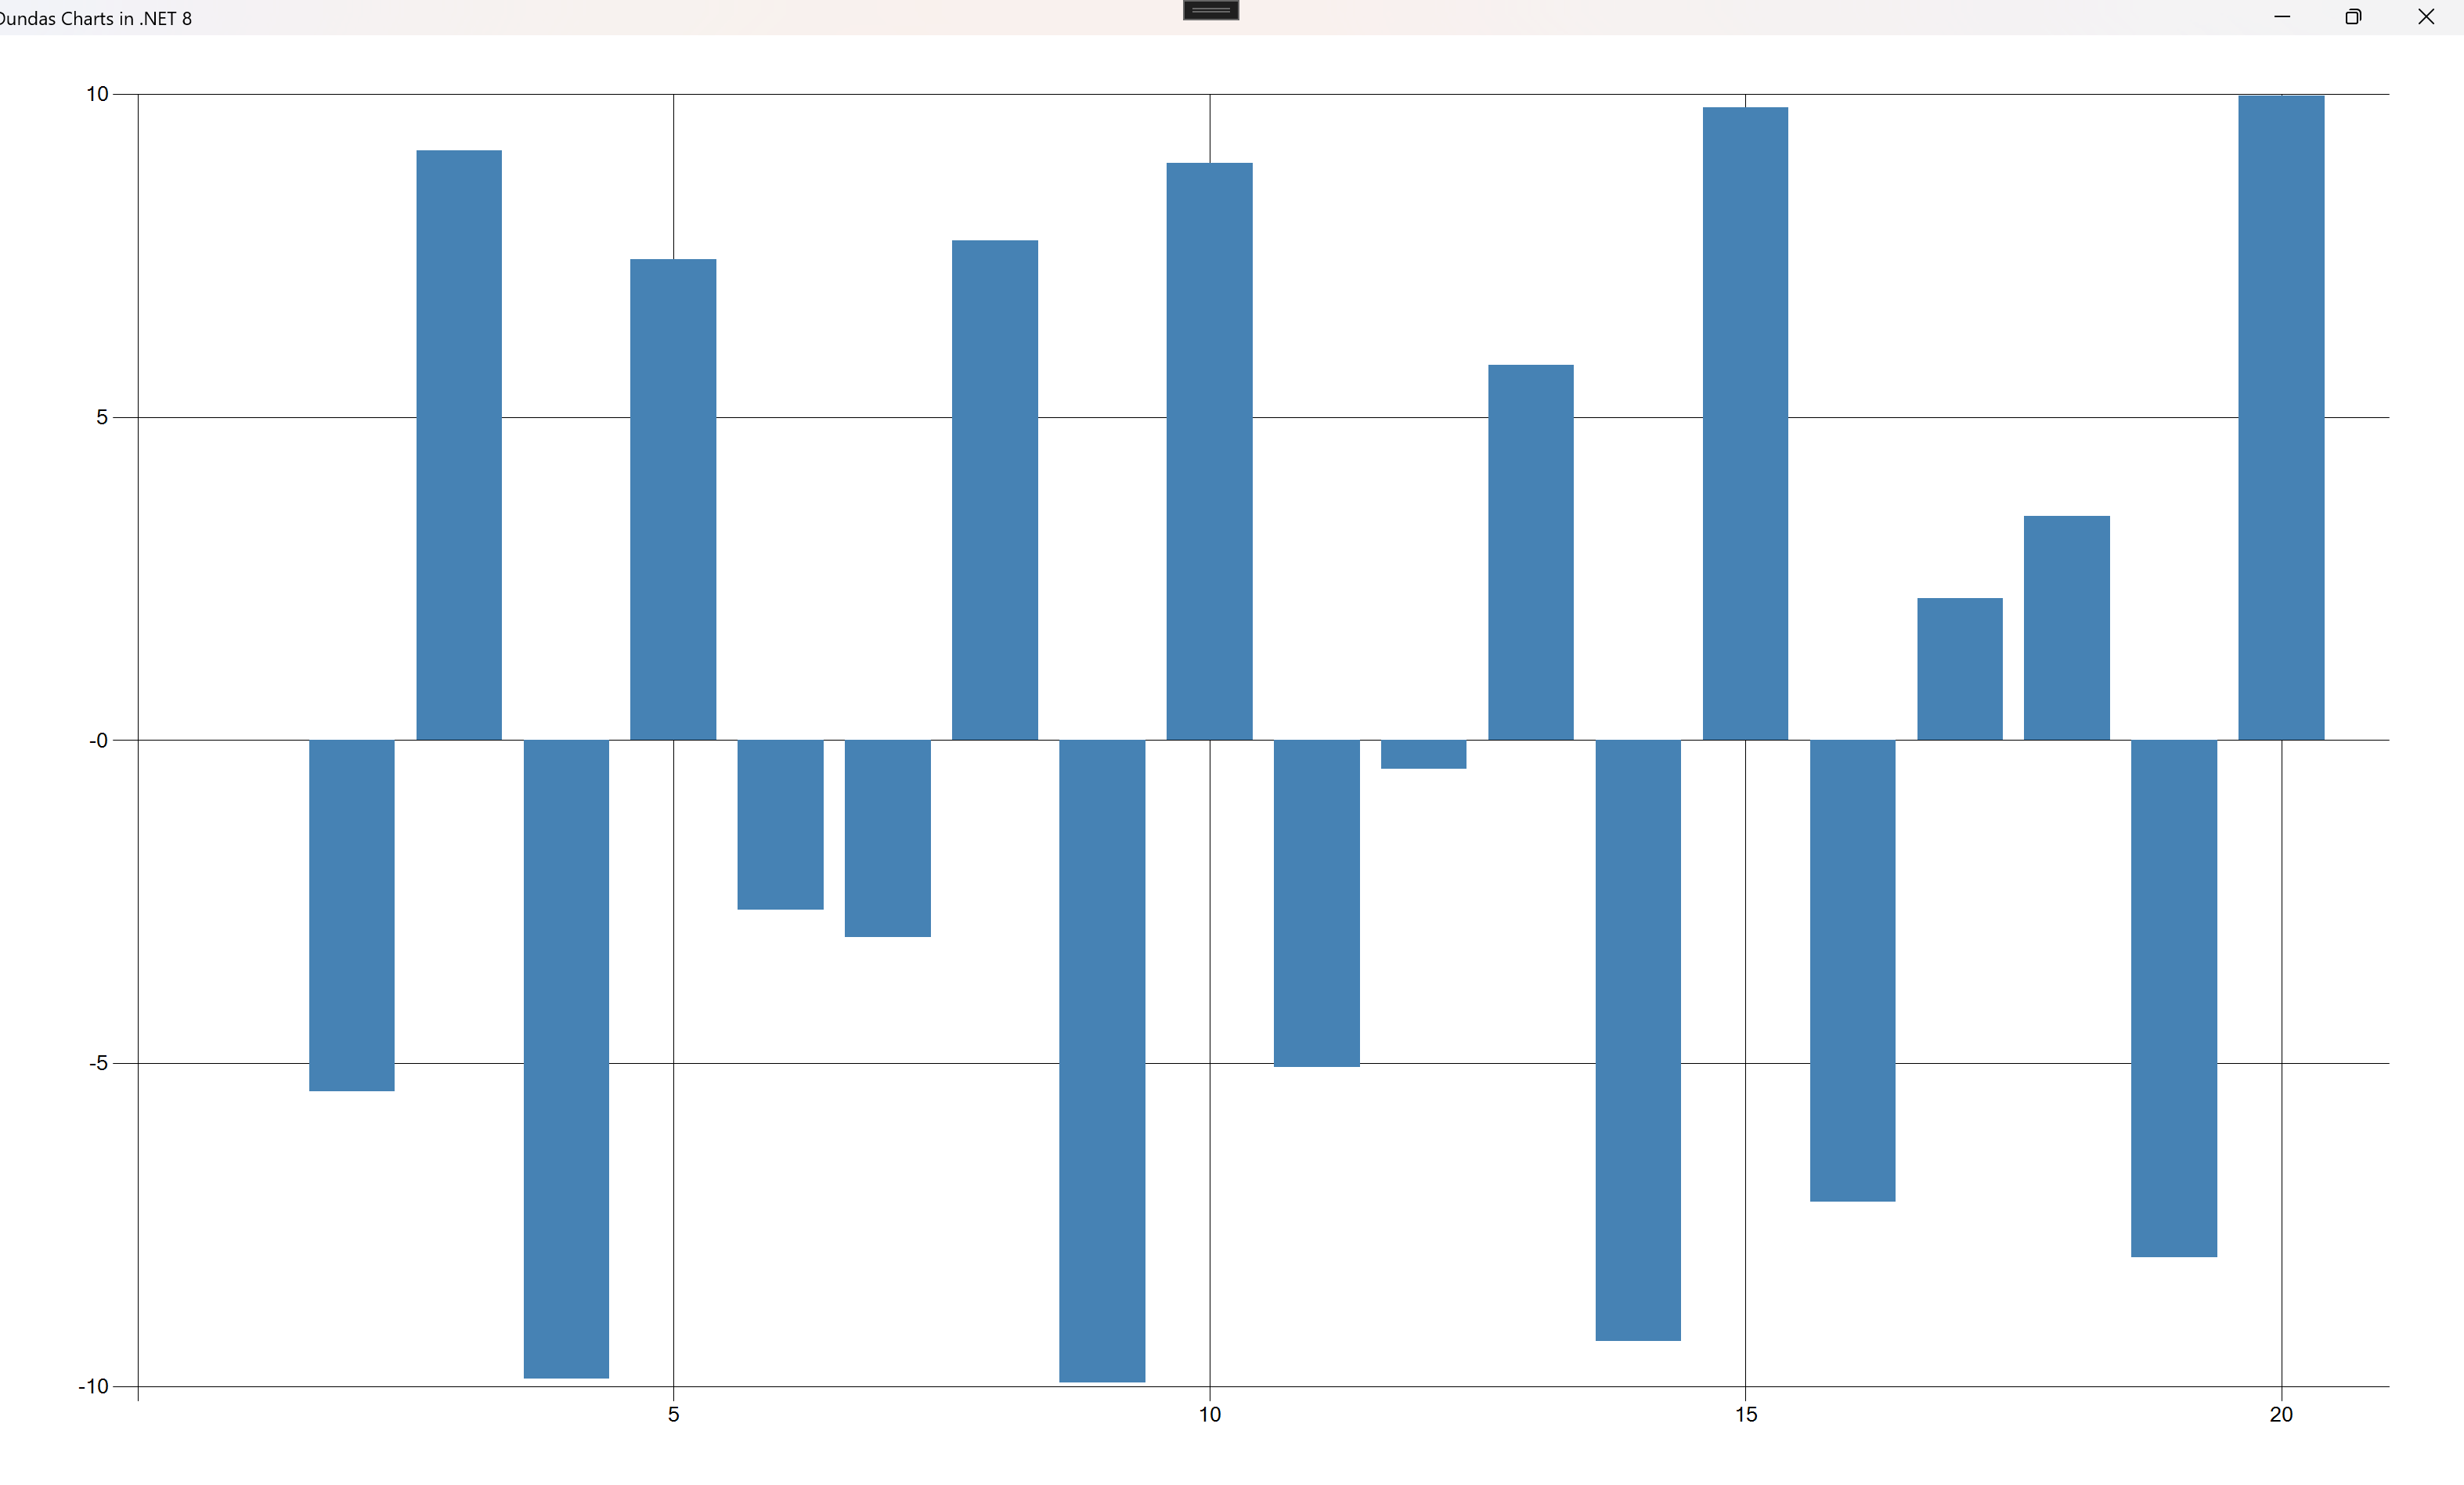
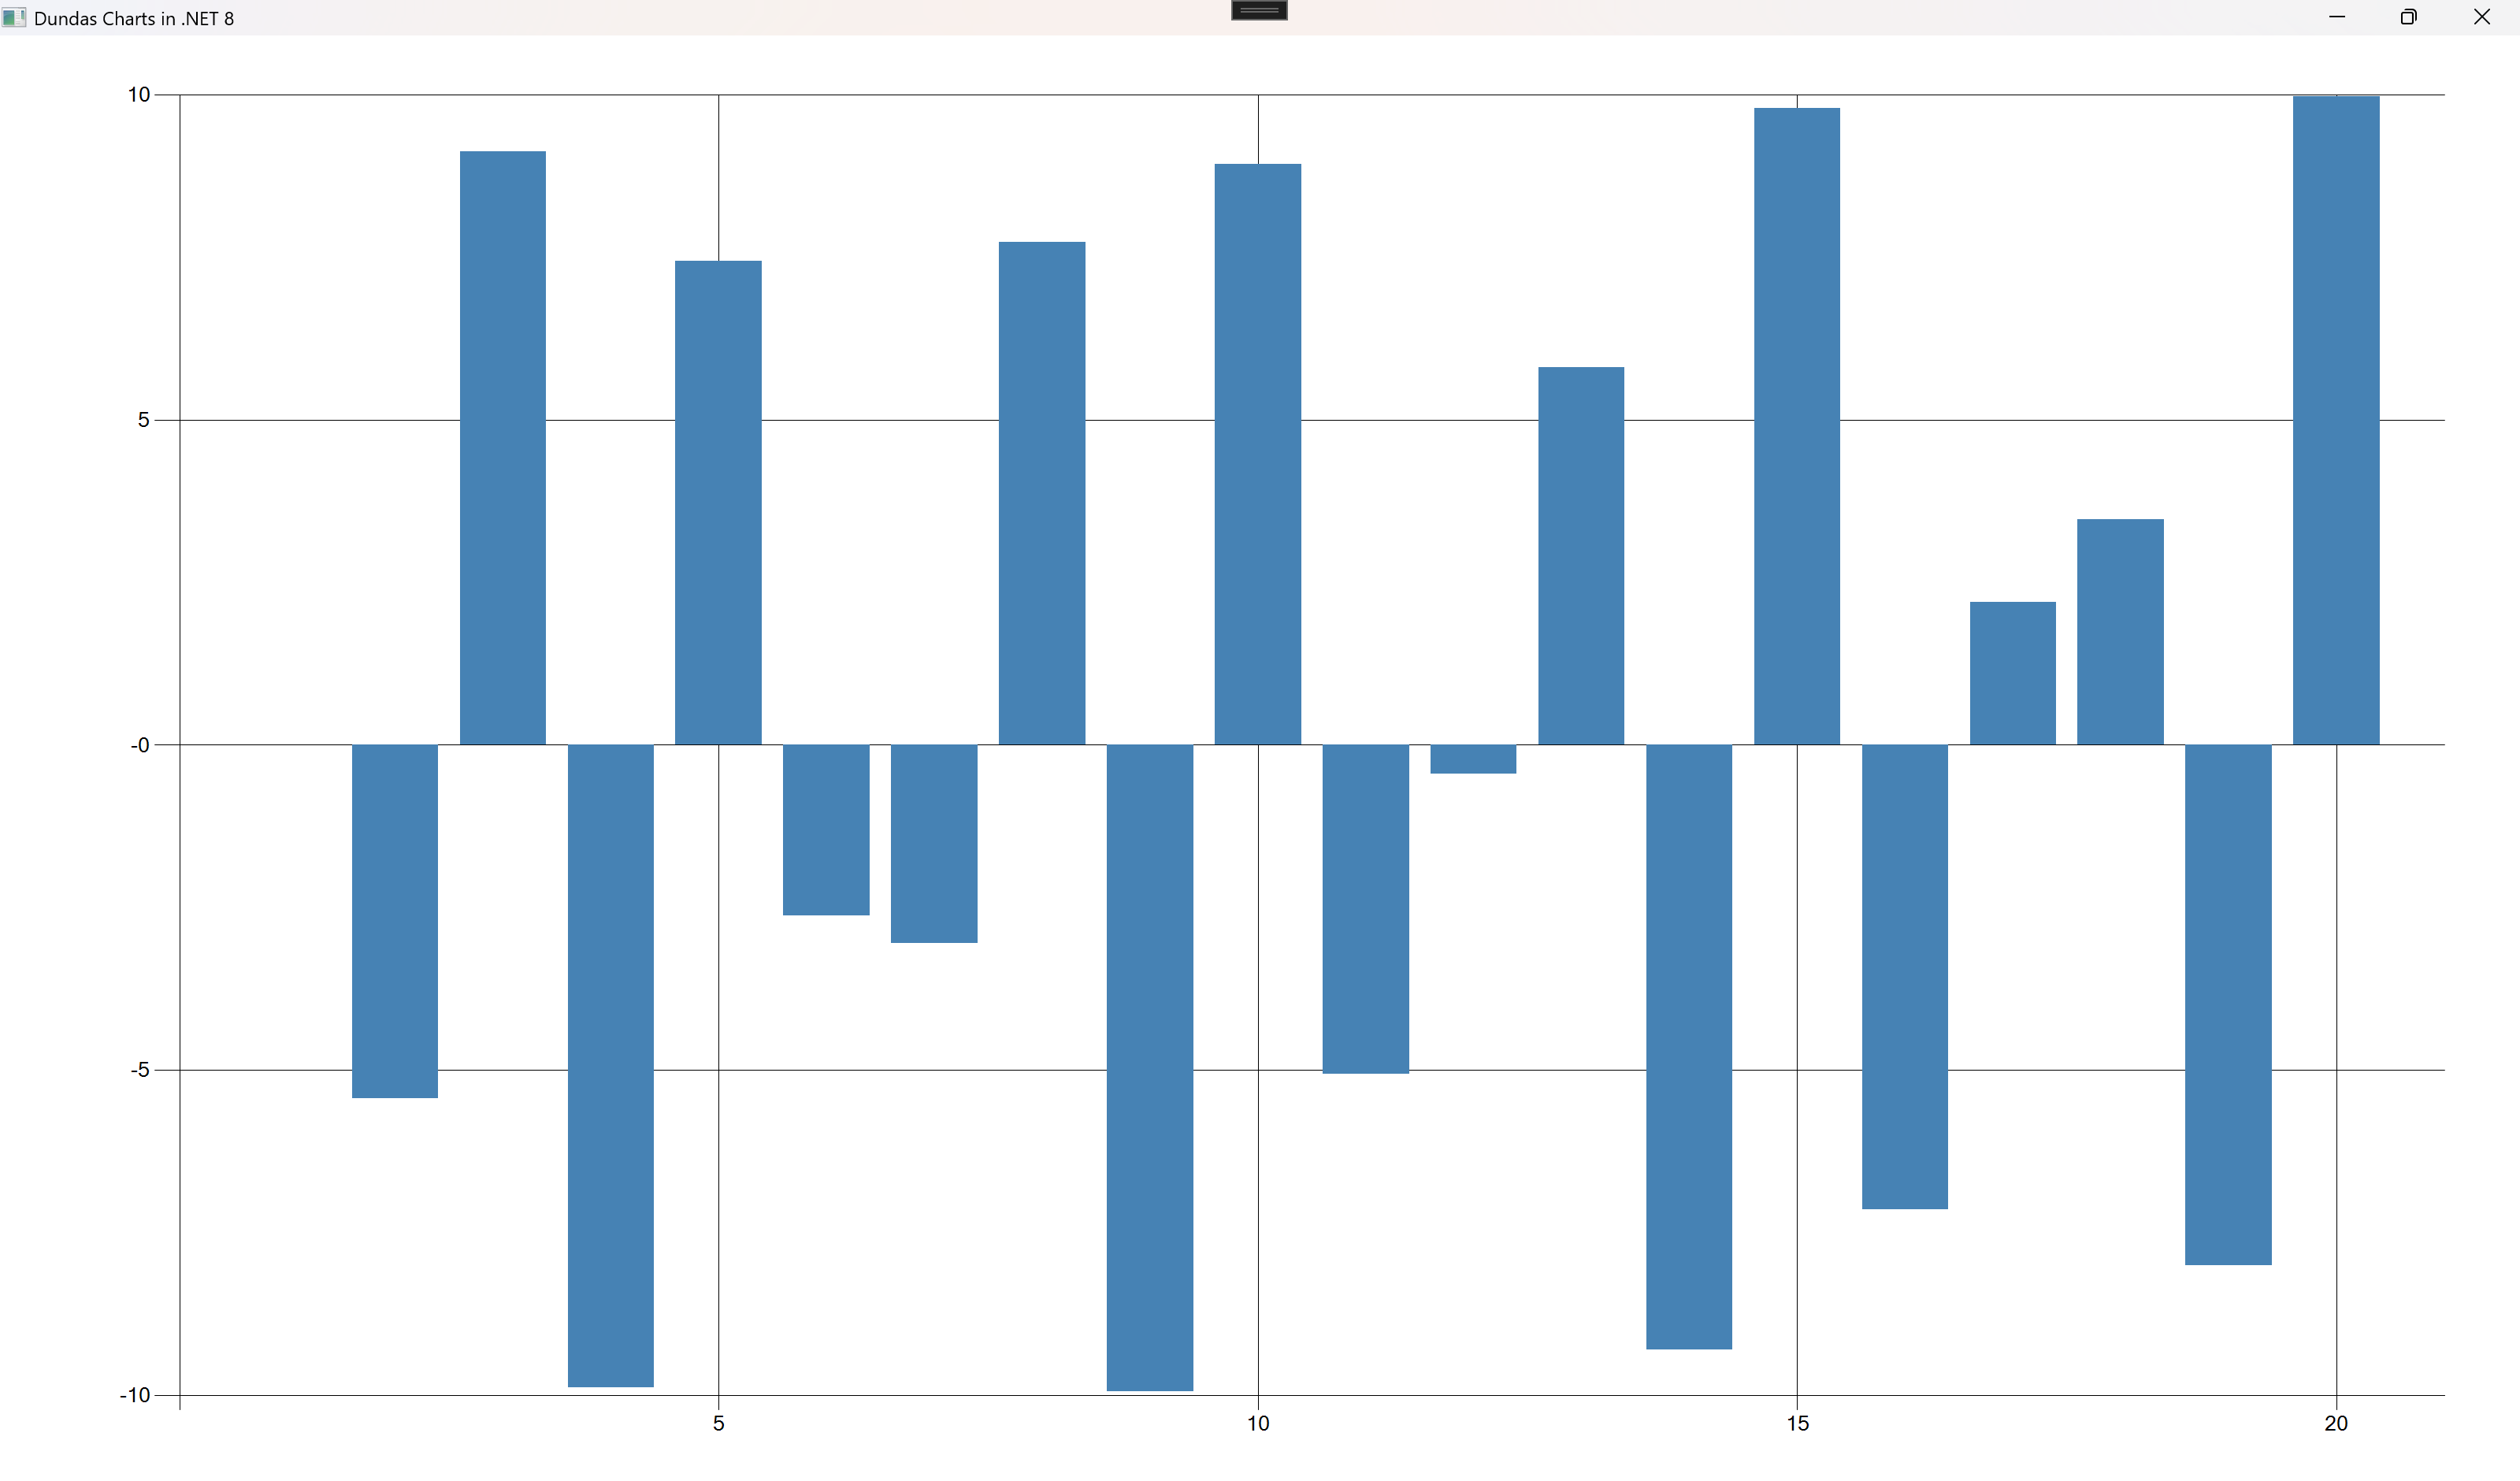
series.ChartType = SeriesChartType.Column;
![]()
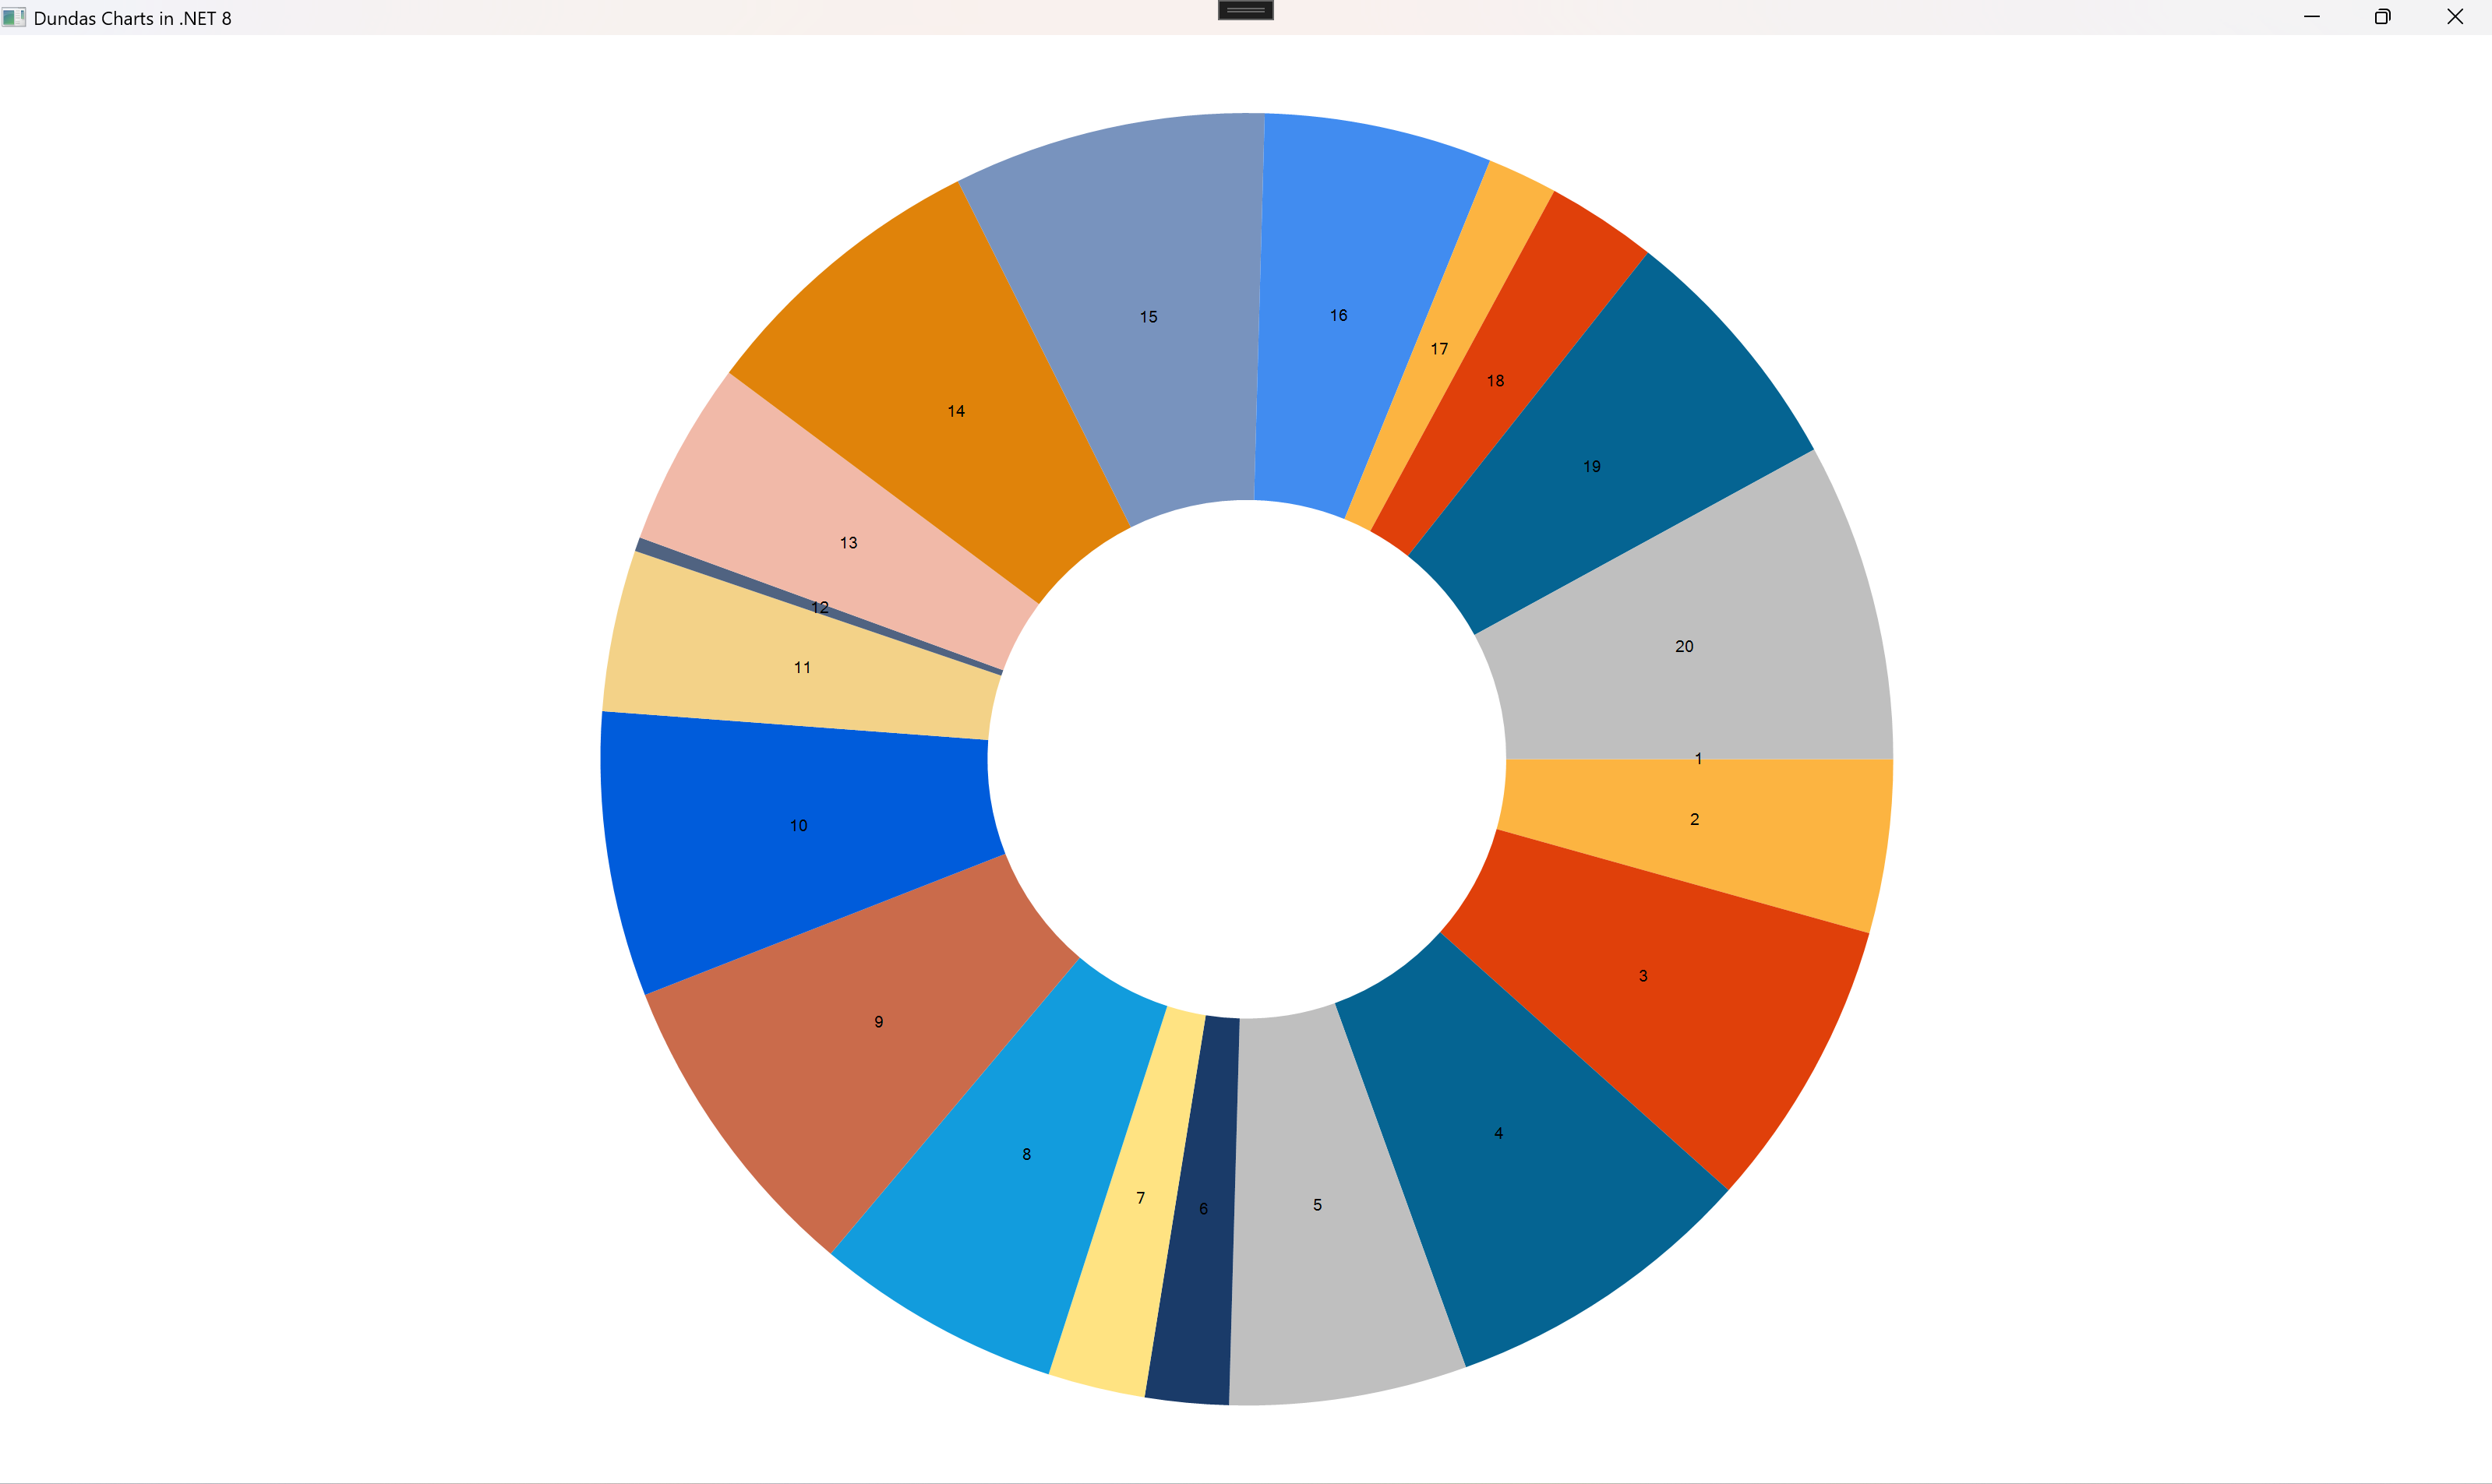
series.ChartType = SeriesChartType.Doughnut;
![]()
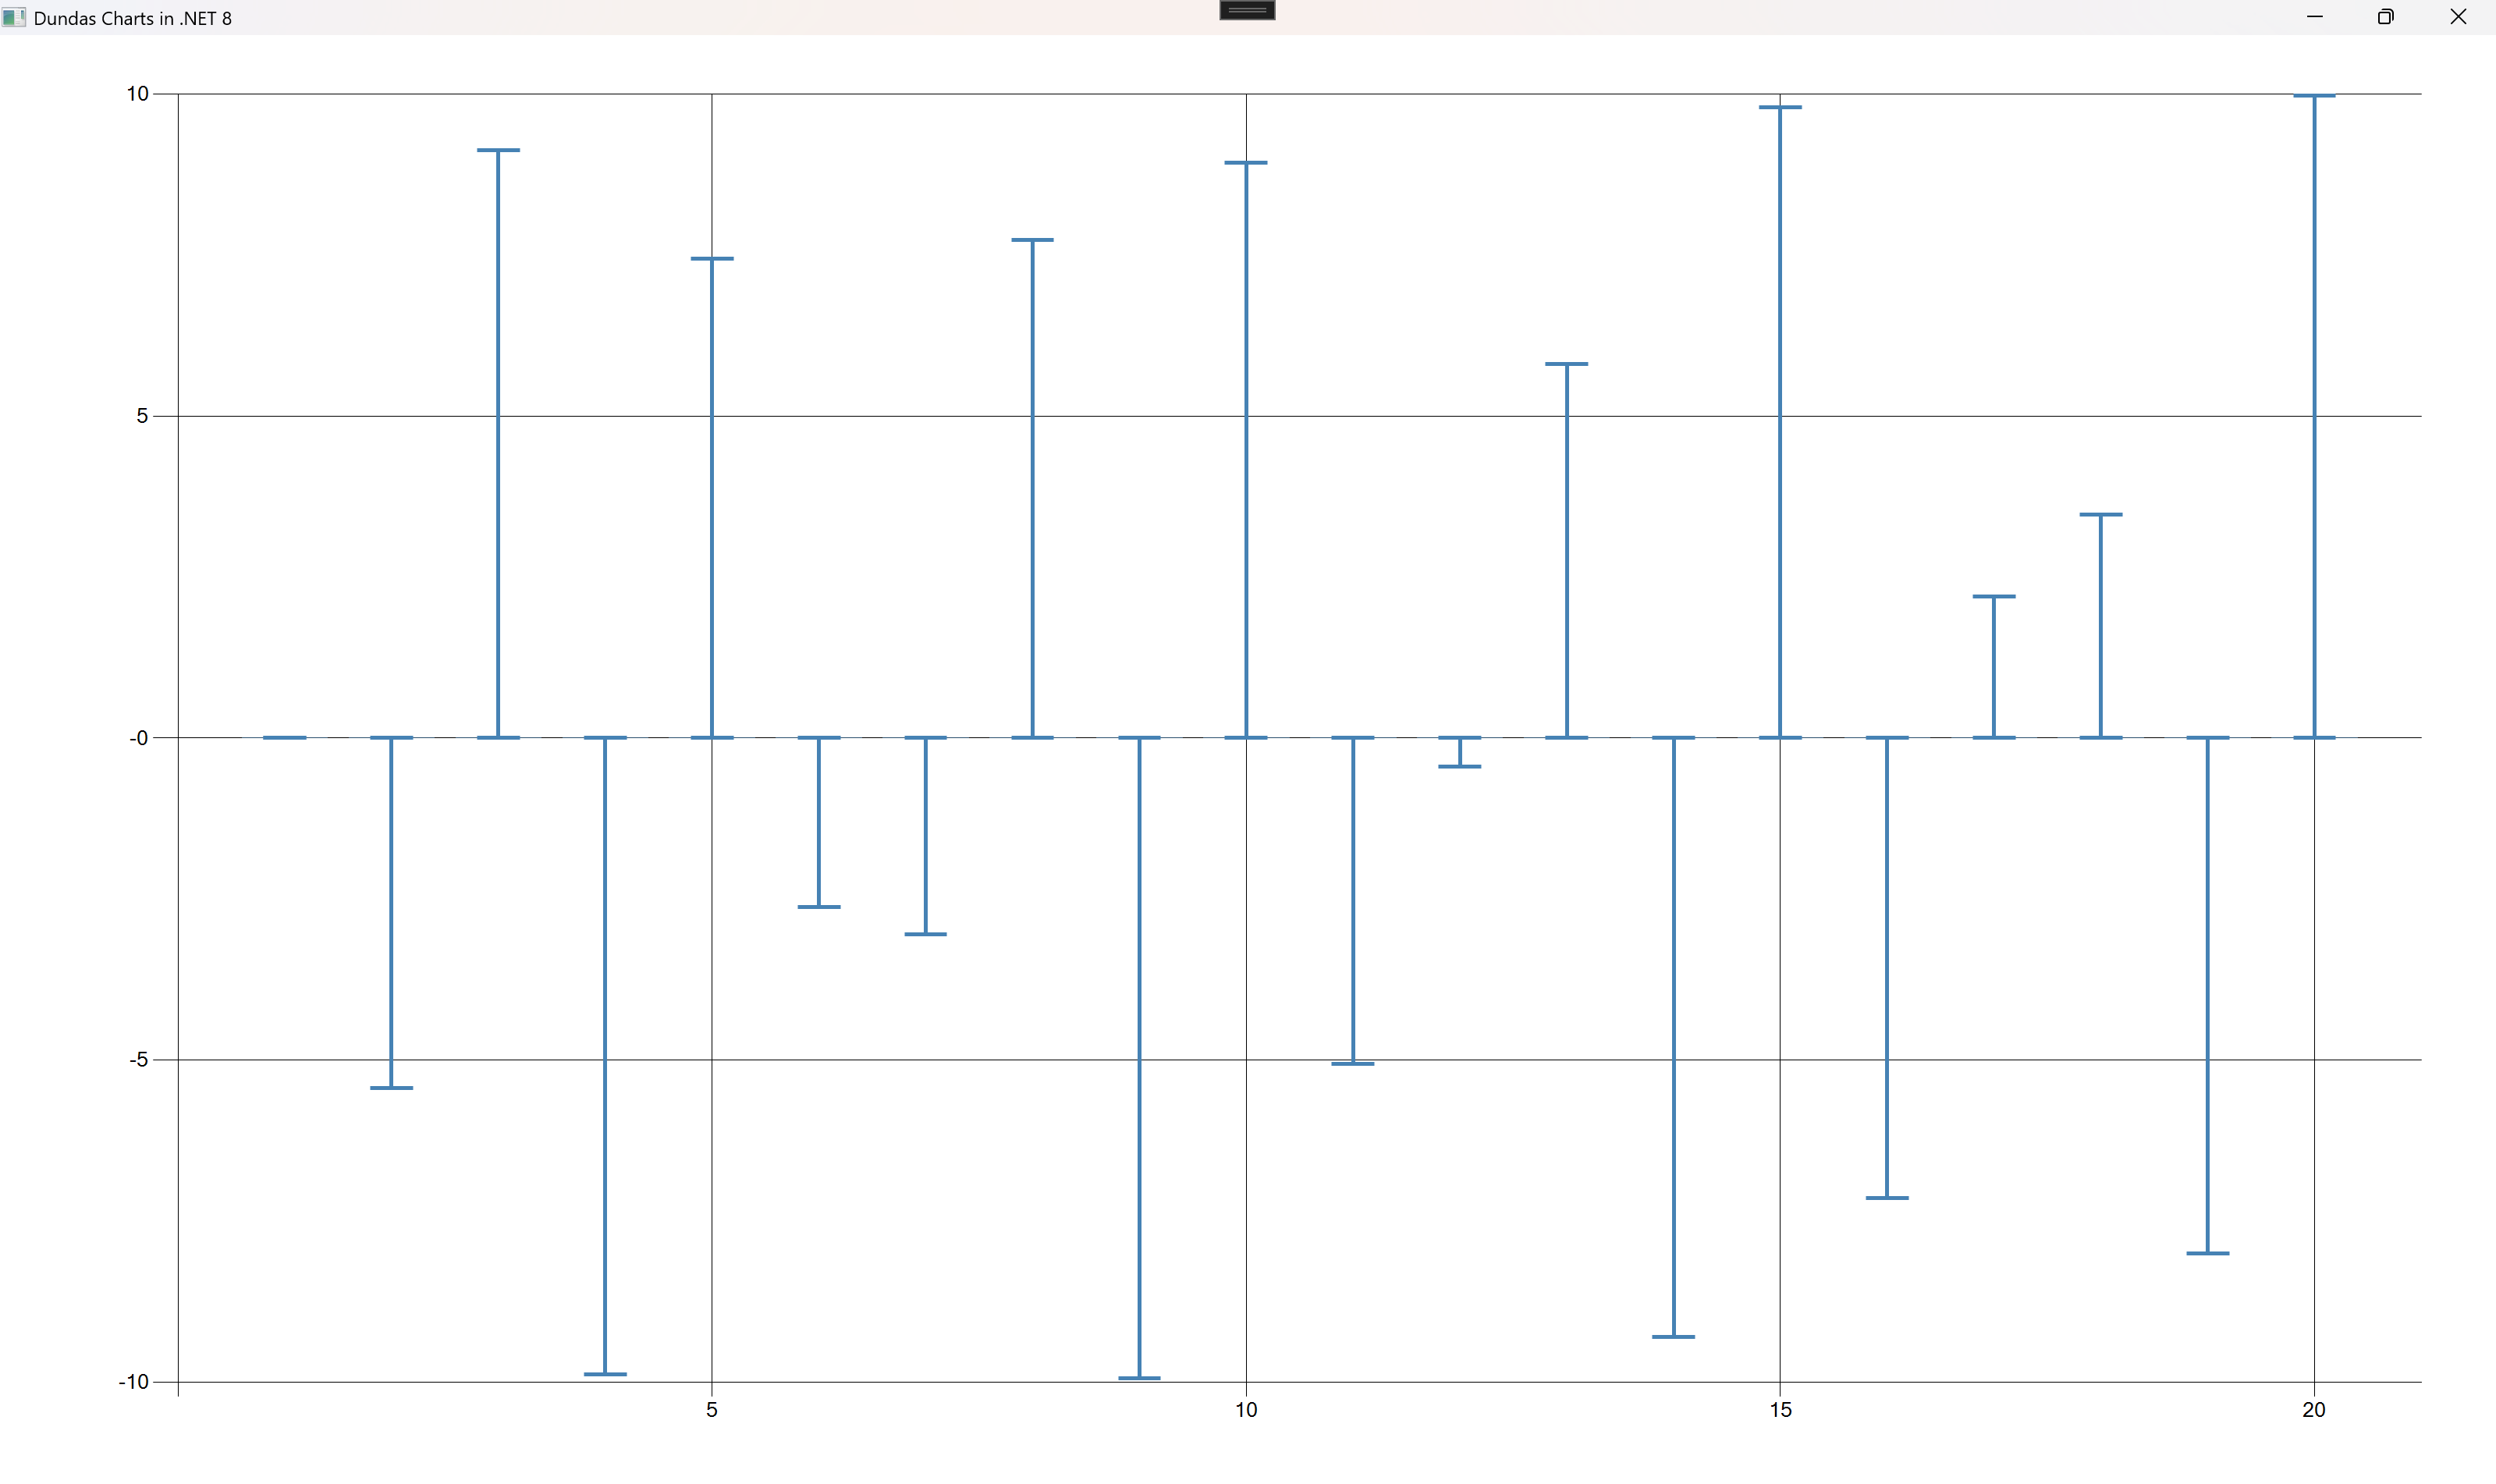
series.ChartType = SeriesChartType.ErrorBar;
![]()
series.ChartType = SeriesChartType.FastLine;
![]()
series.ChartType = SeriesChartType.FastPoint;
![]()
series.ChartType = SeriesChartType.Funnel;
![]()
series.ChartType = SeriesChartType.Kagi;
![]()
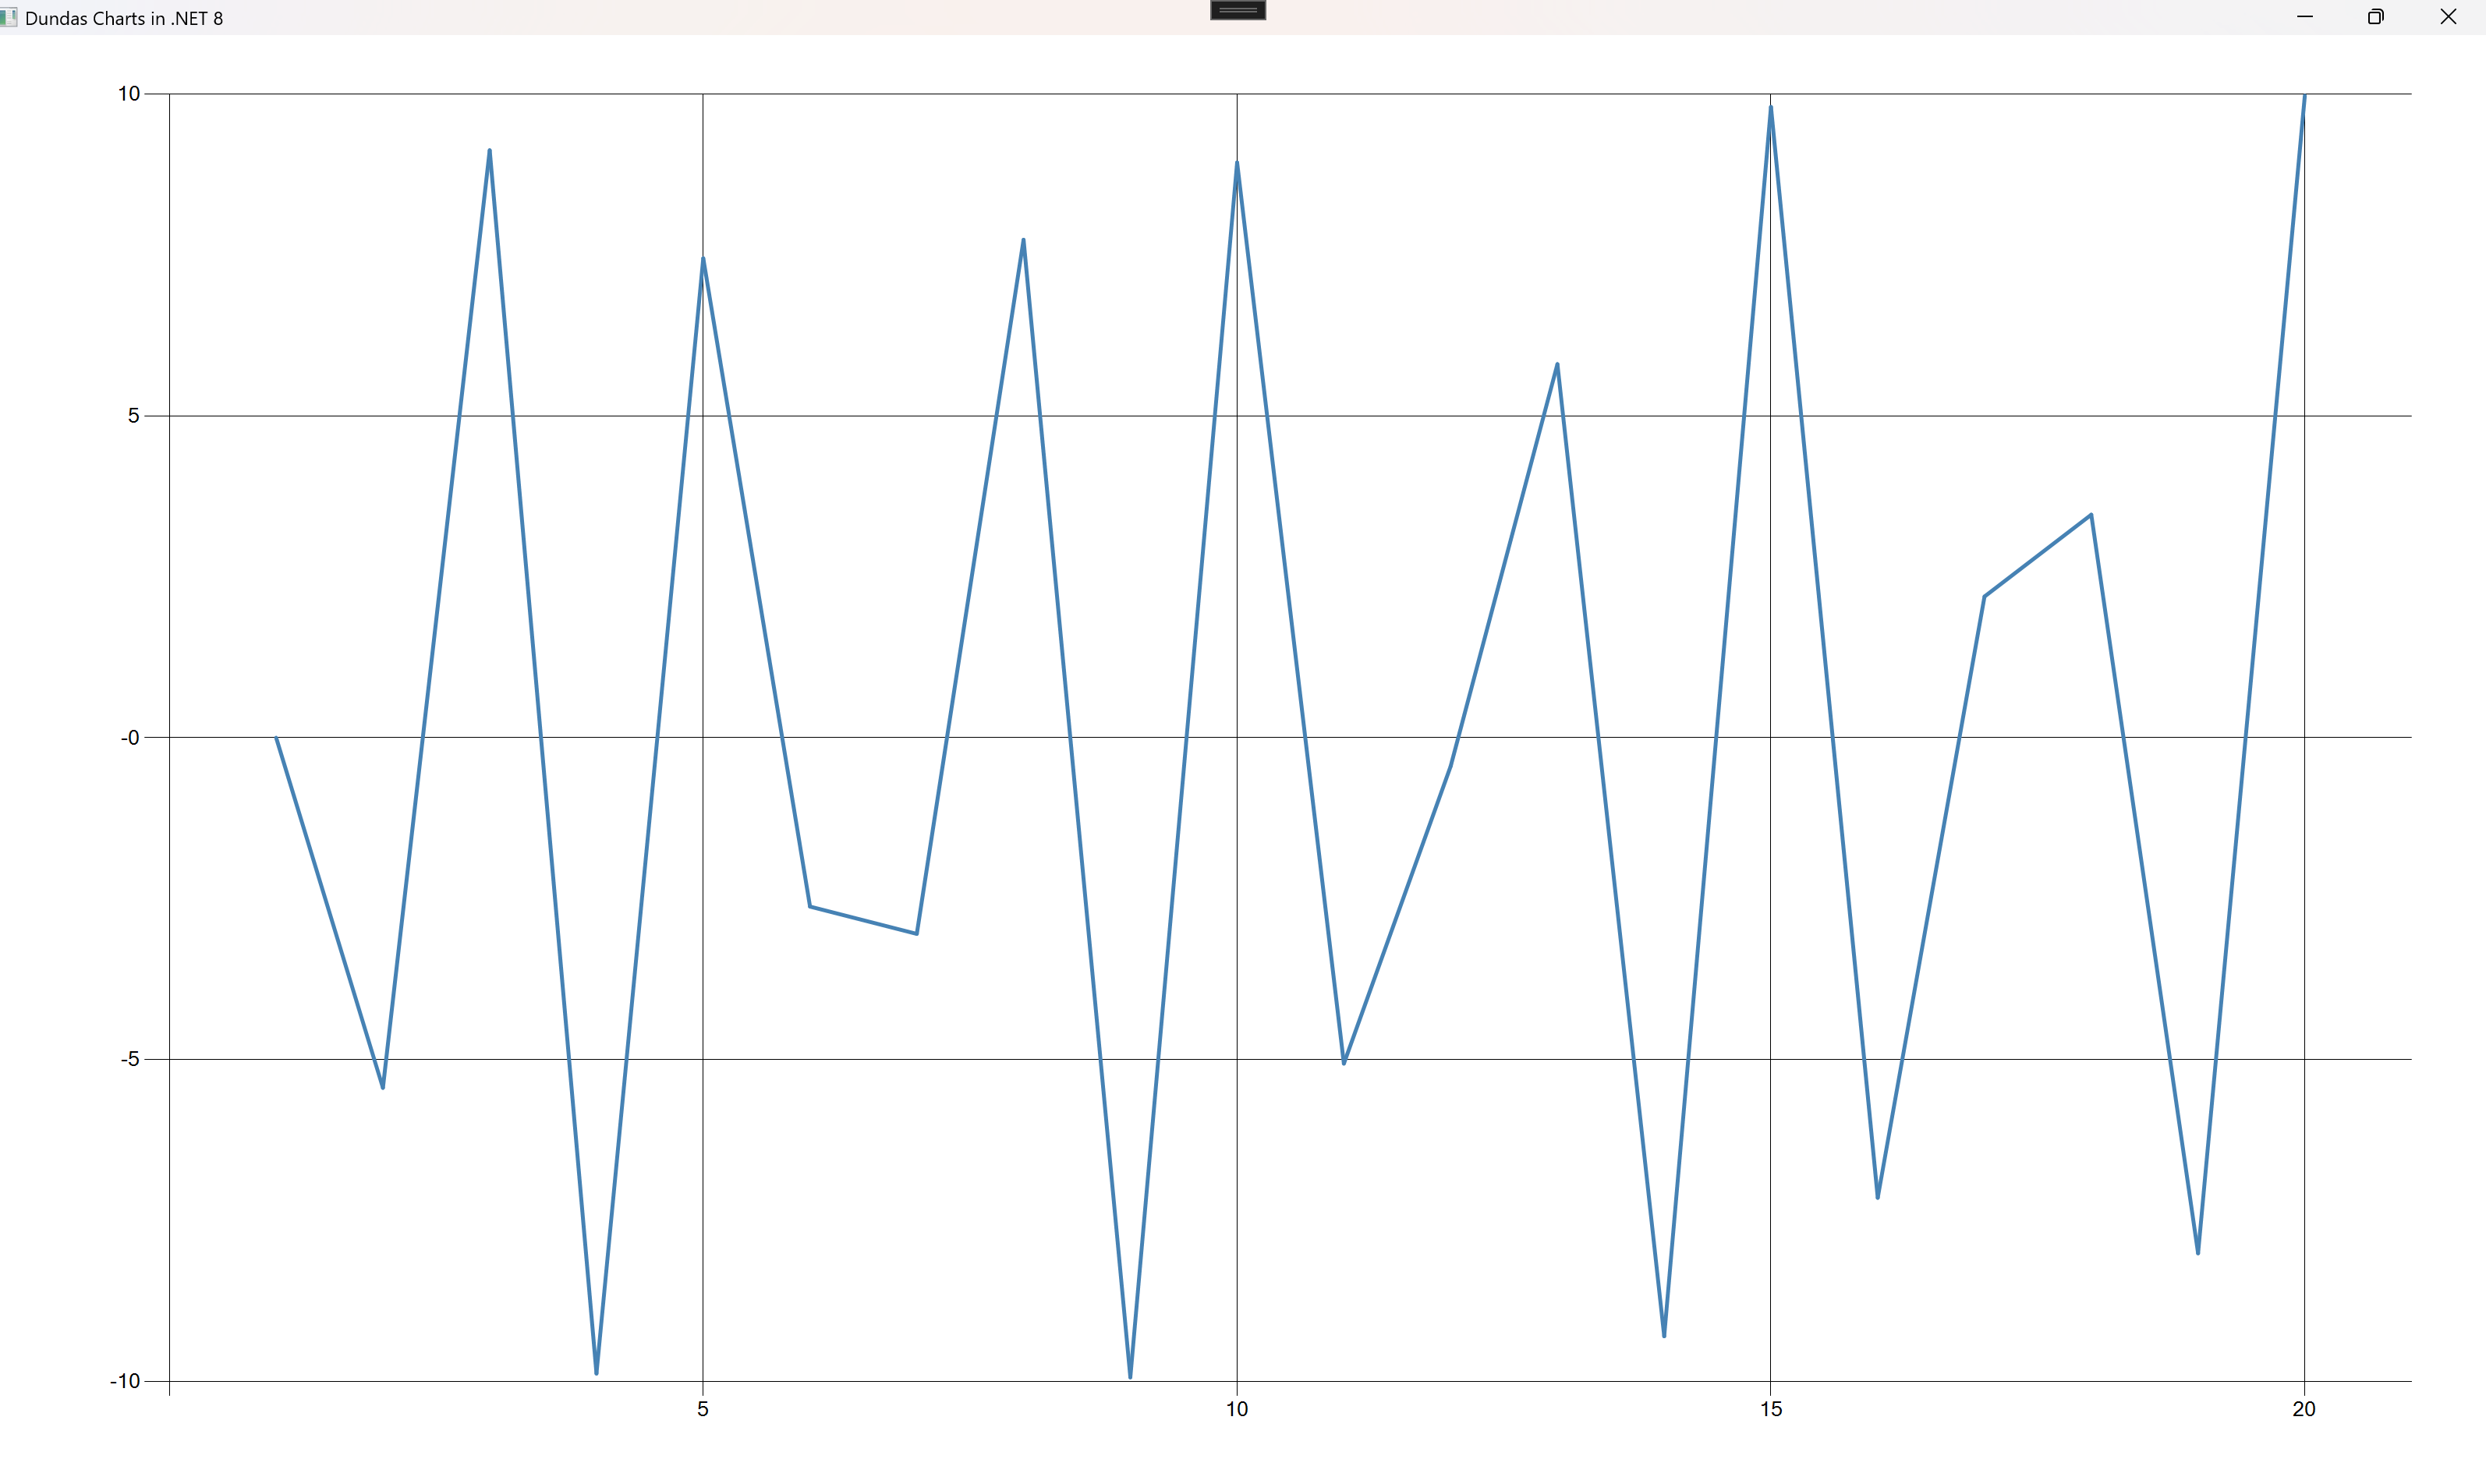
series.ChartType = SeriesChartType.Line;
![]()
series.ChartType = SeriesChartType.Pie;
![]()
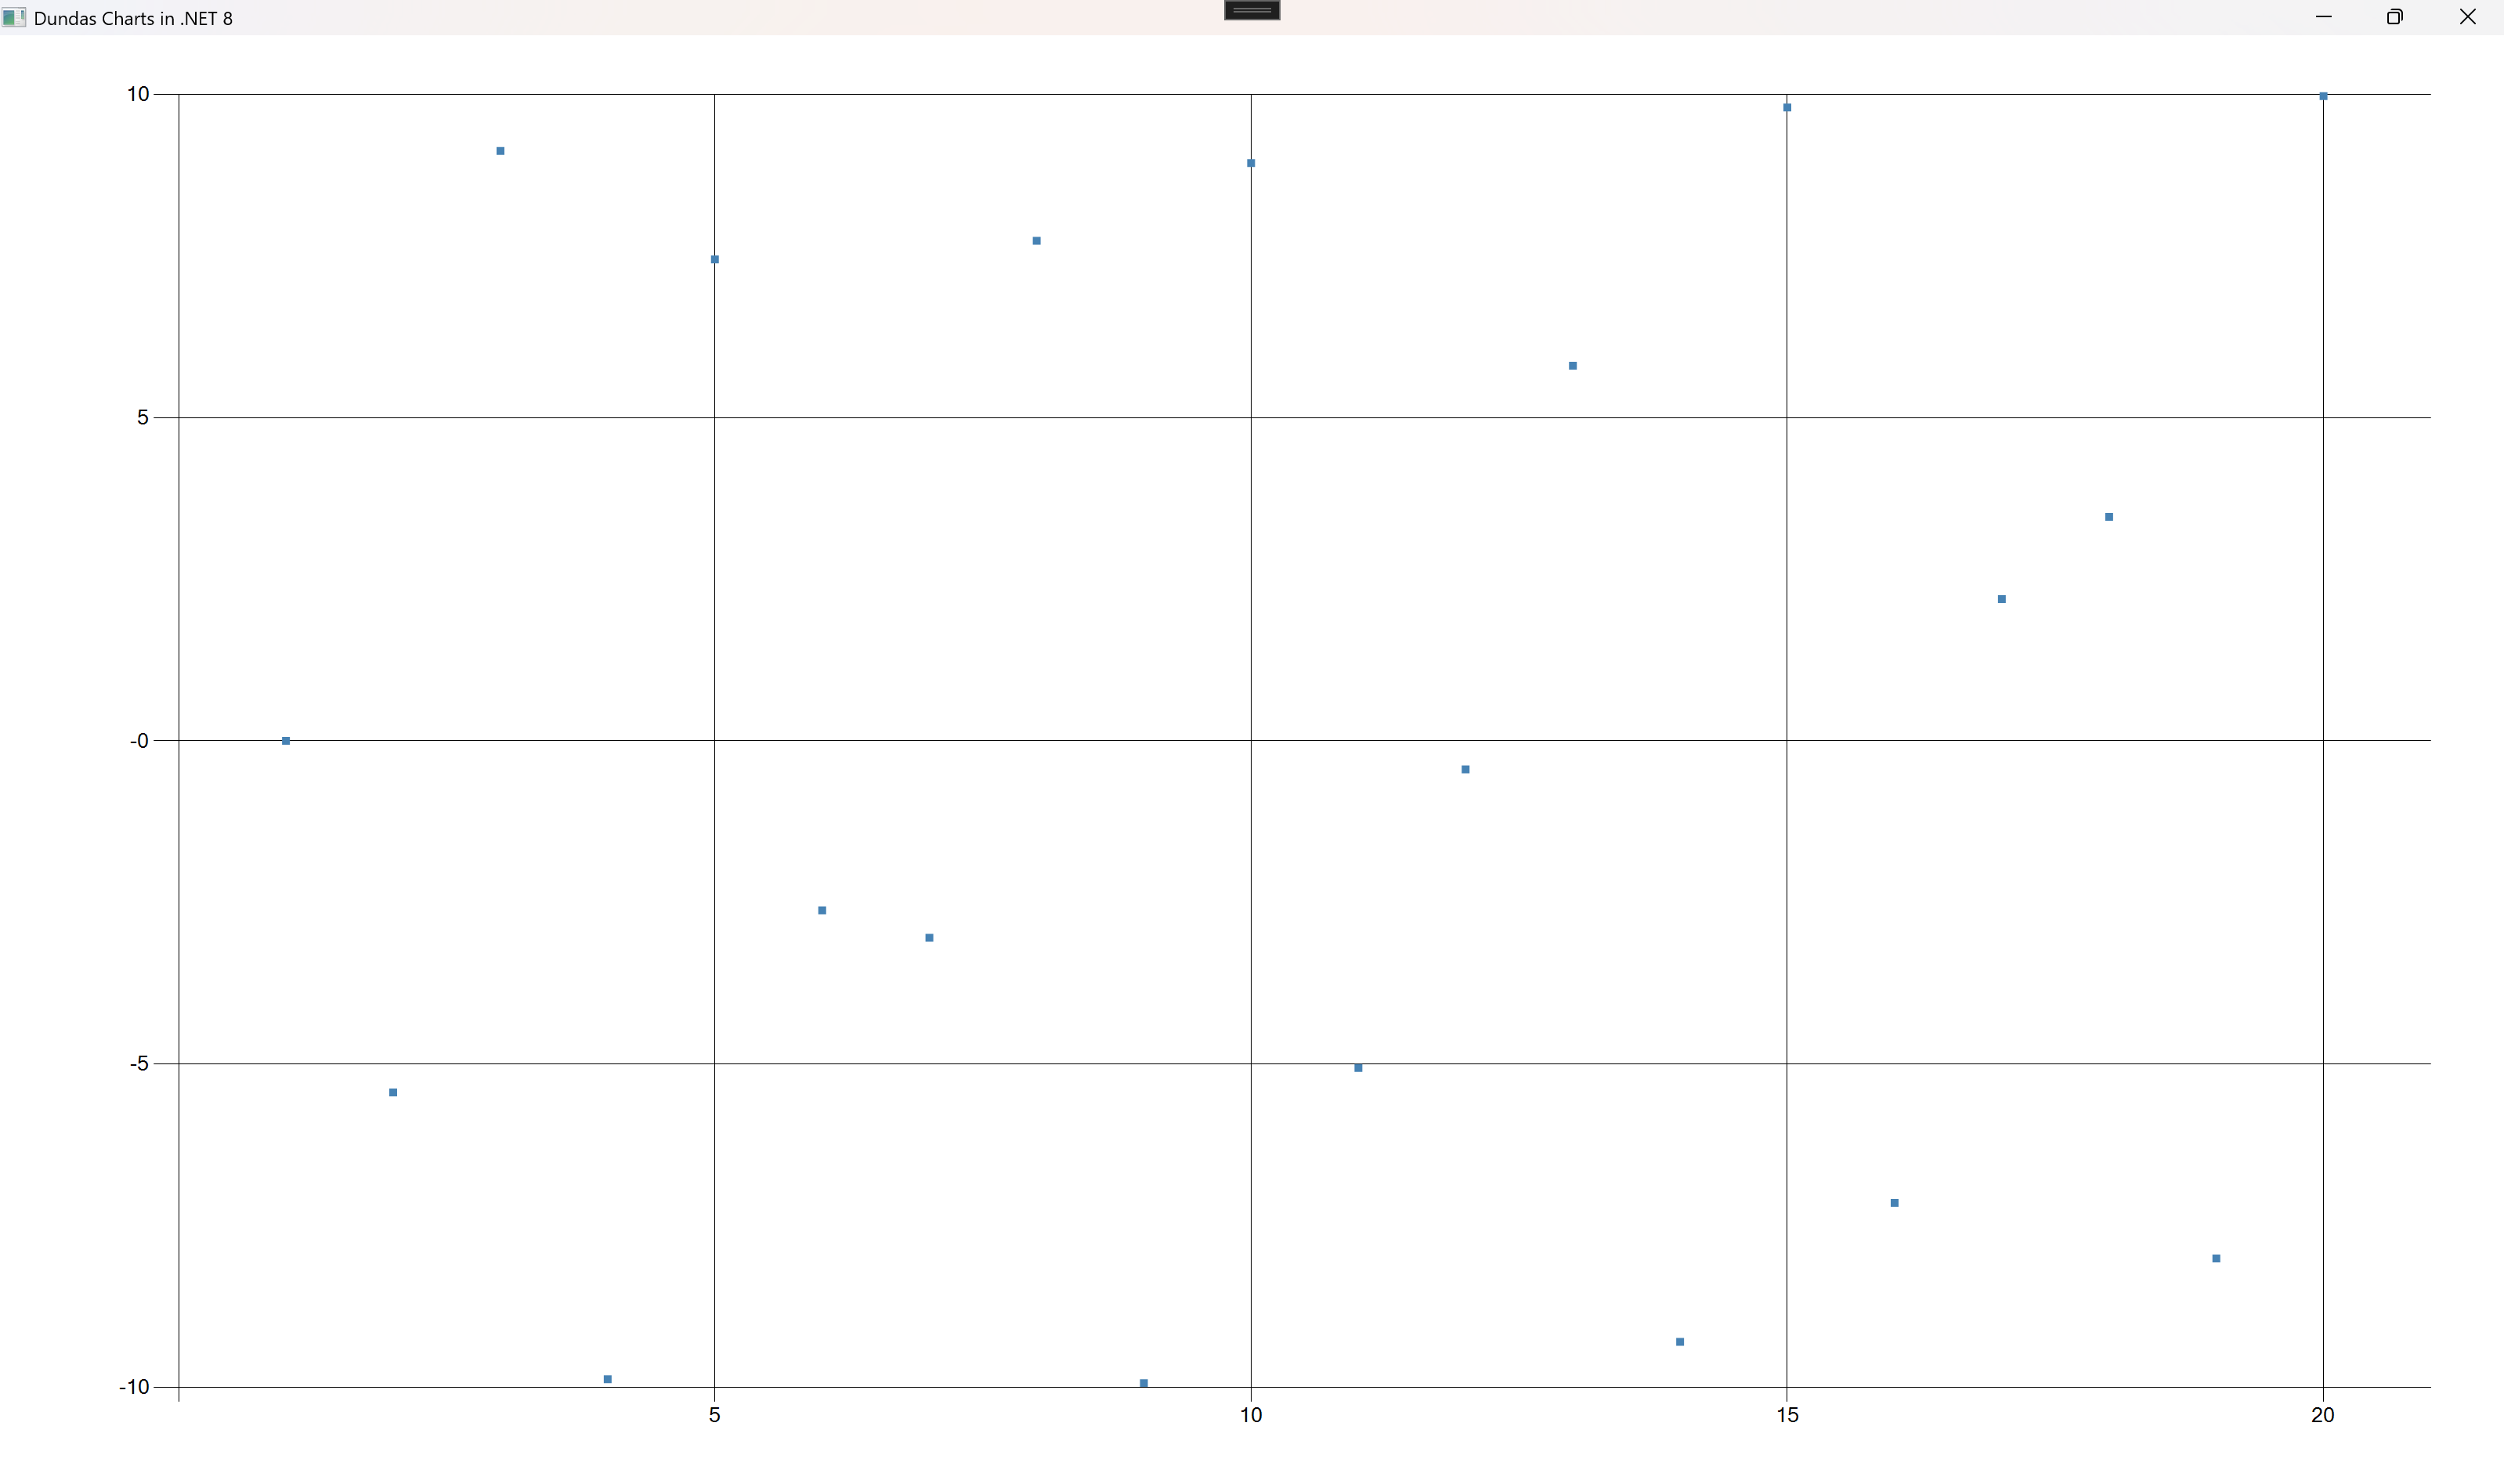
series.ChartType = SeriesChartType.Point;
![]()
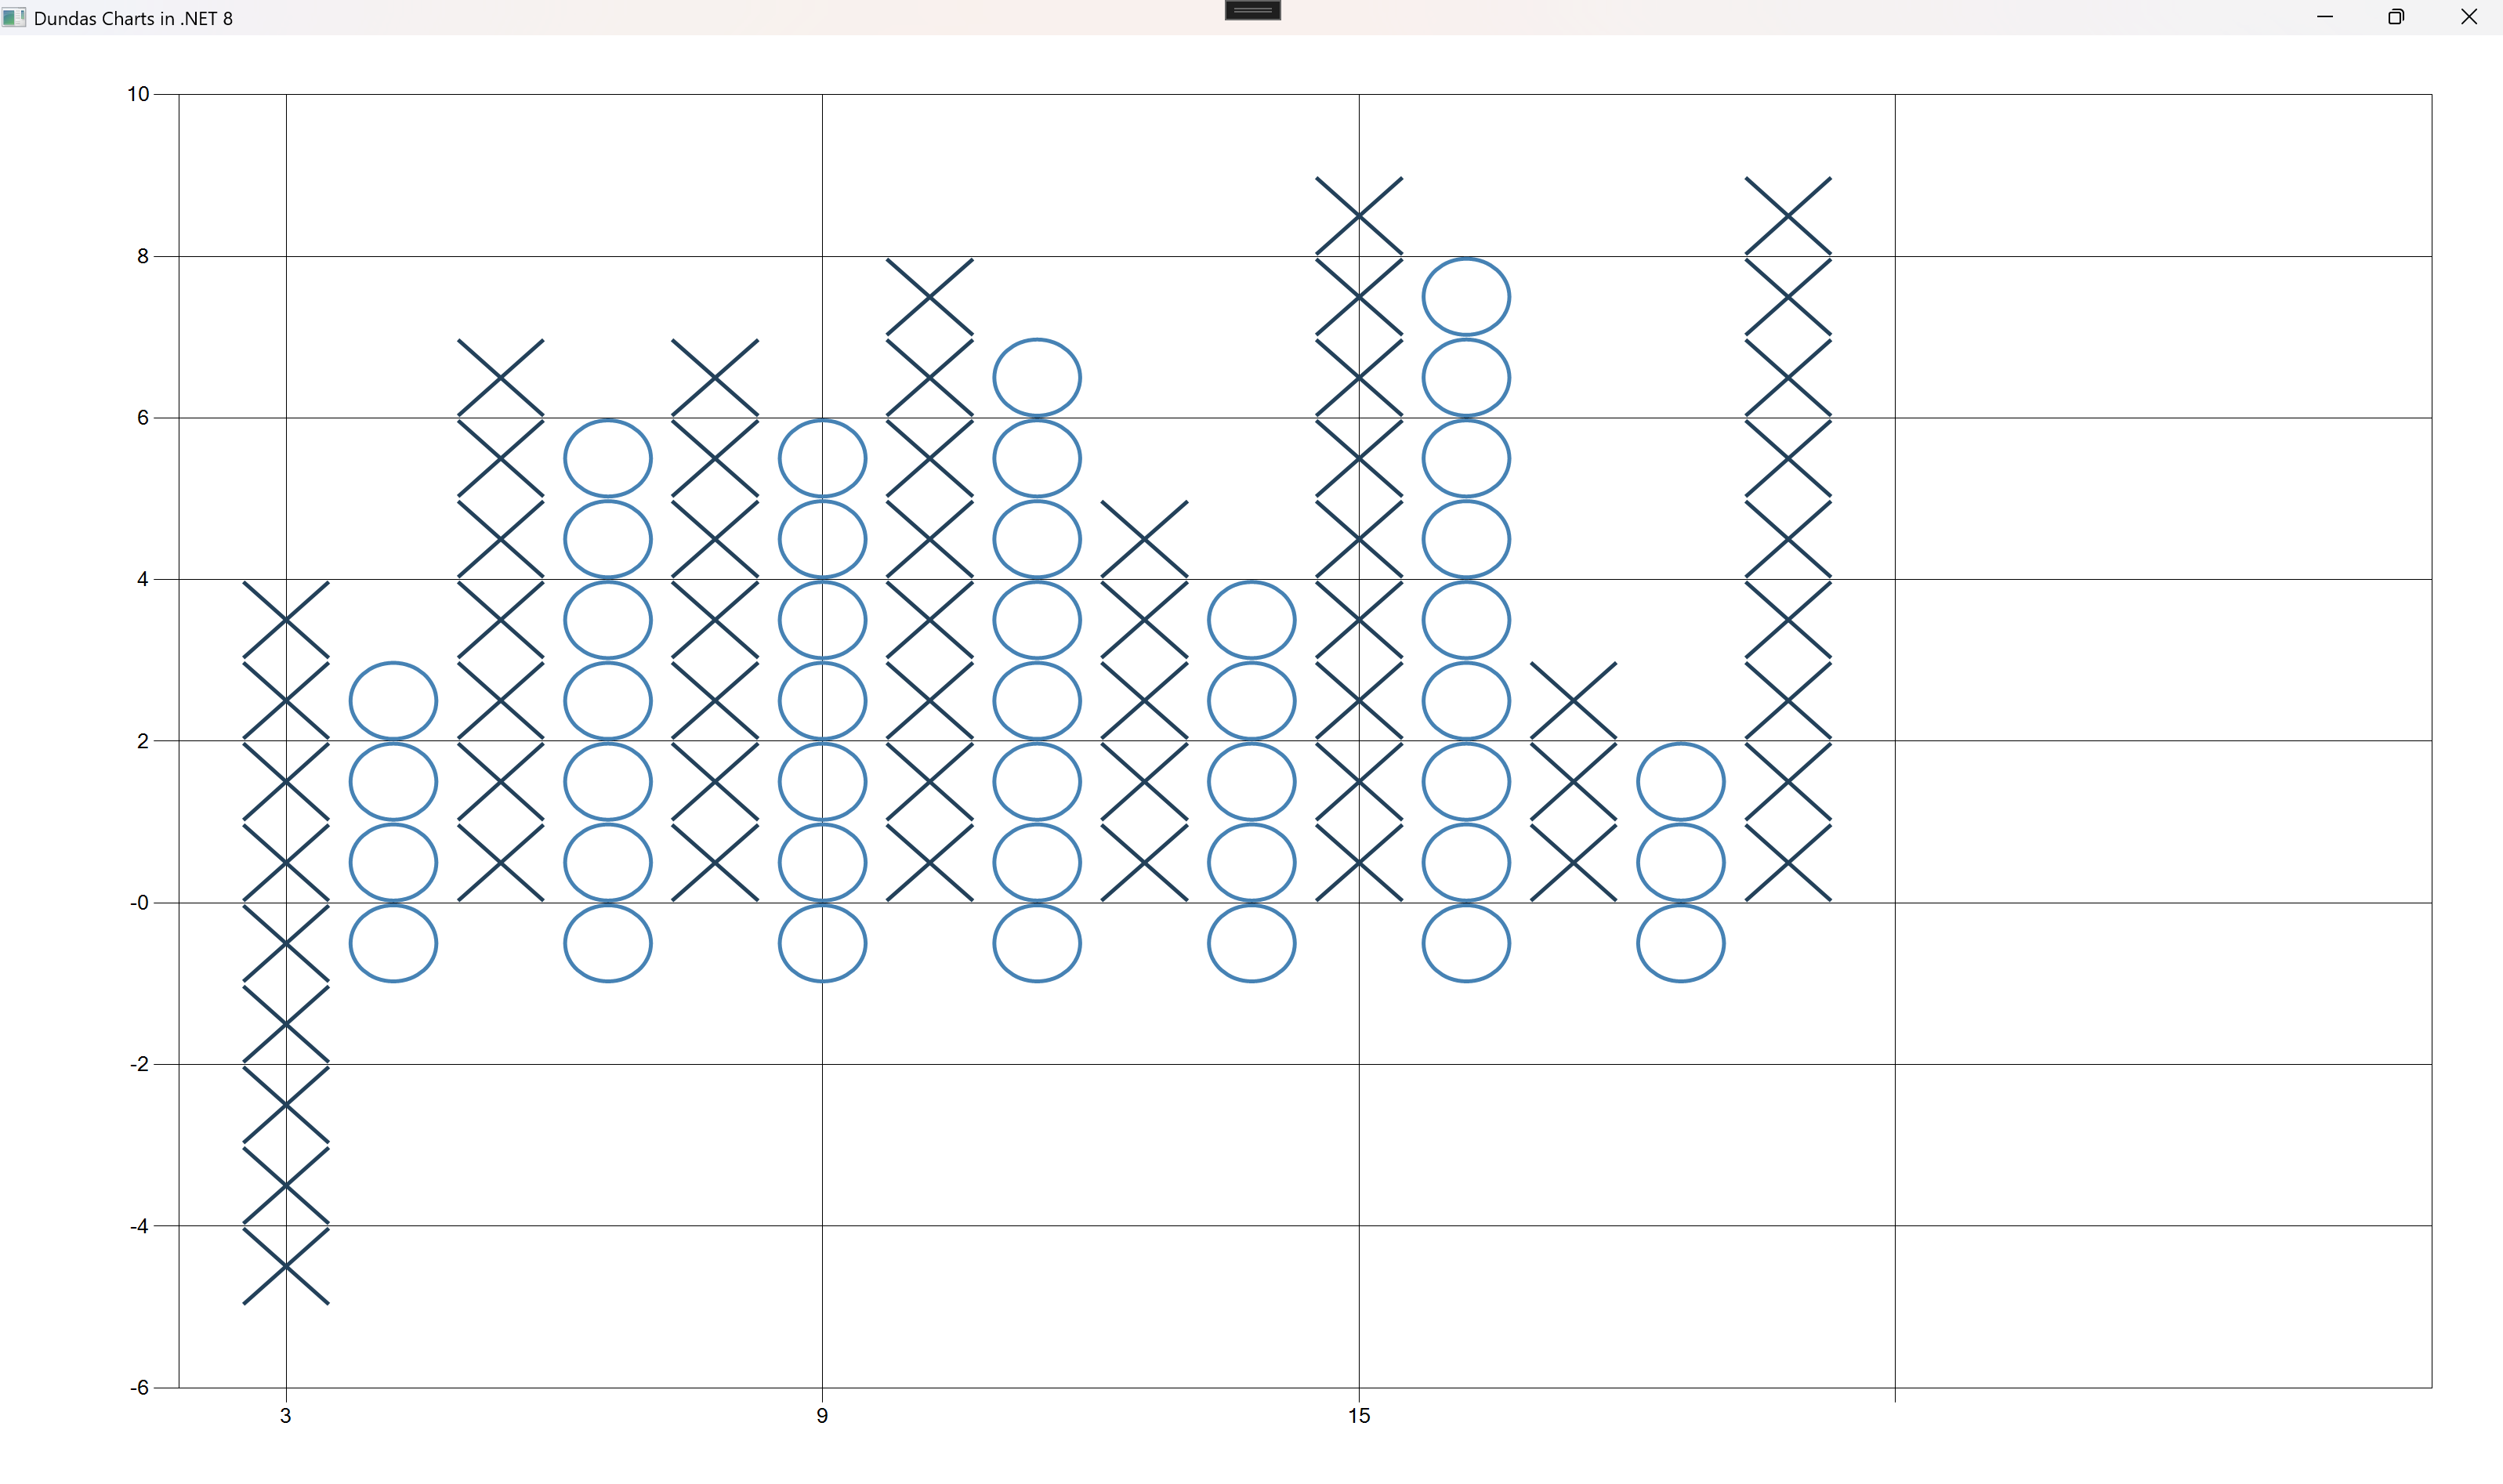
series.ChartType = SeriesChartType.PointAndFigure;
![]()
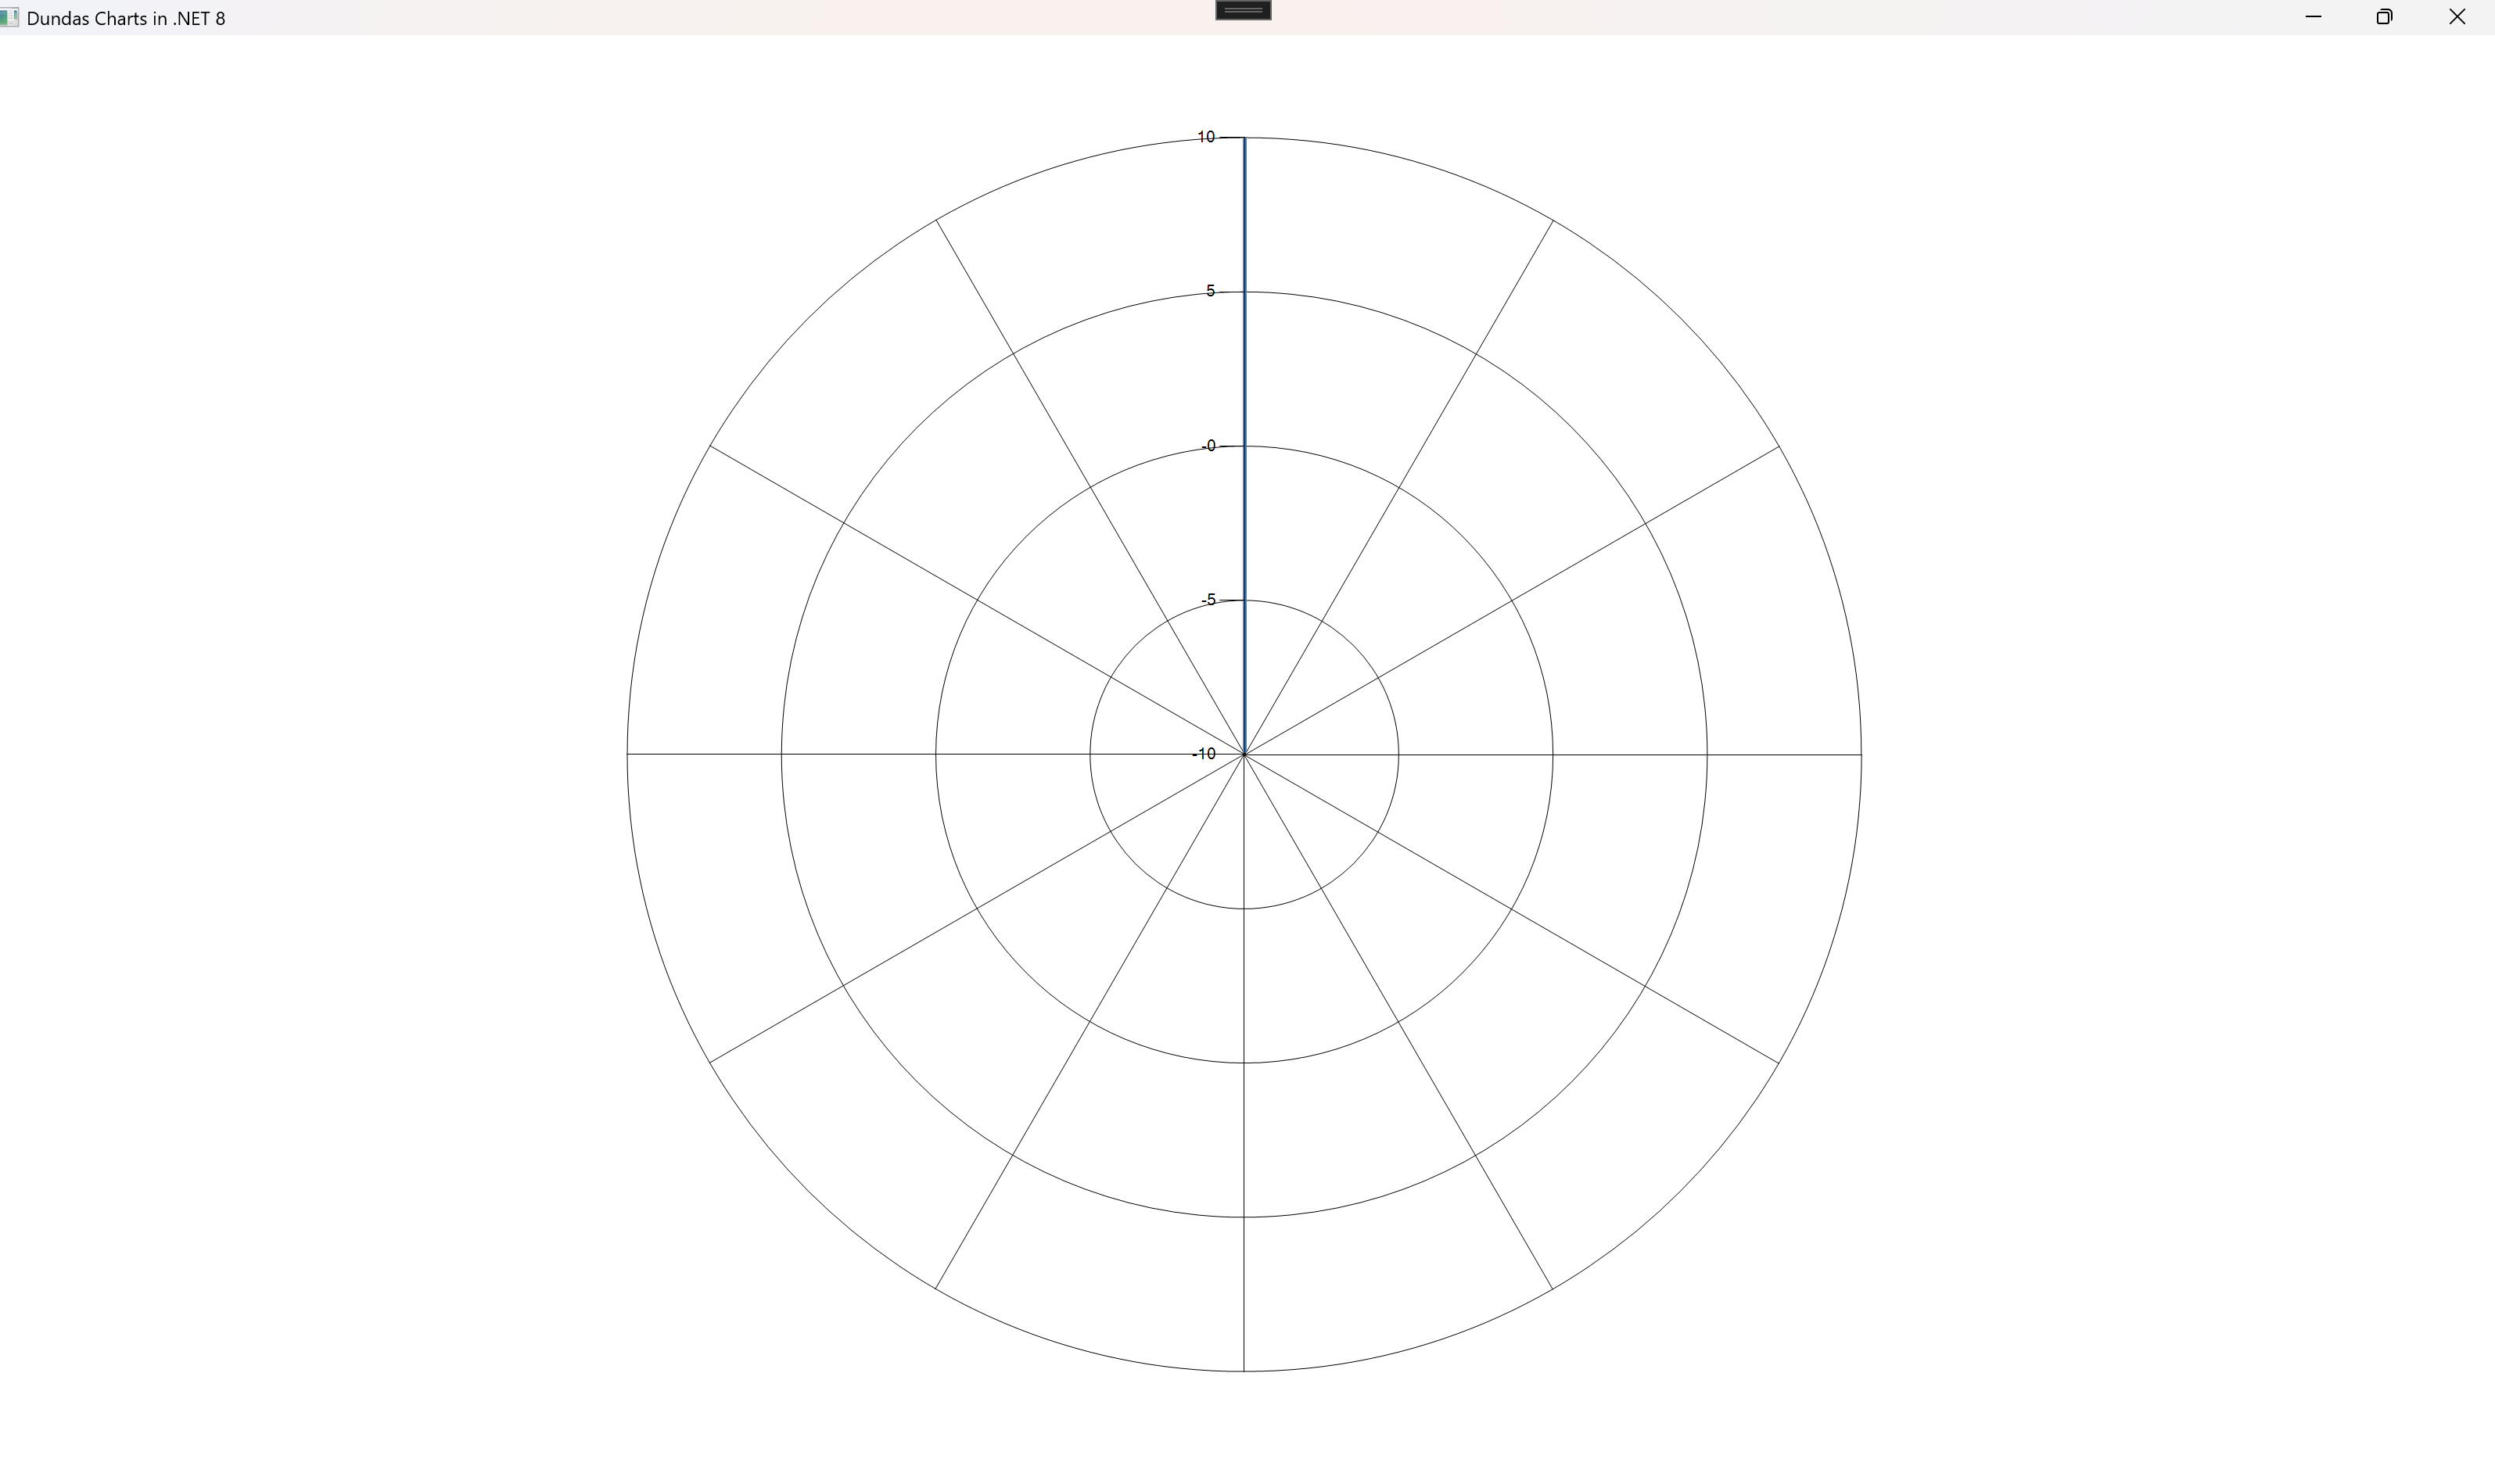
series.ChartType = SeriesChartType.Polar;
![]()
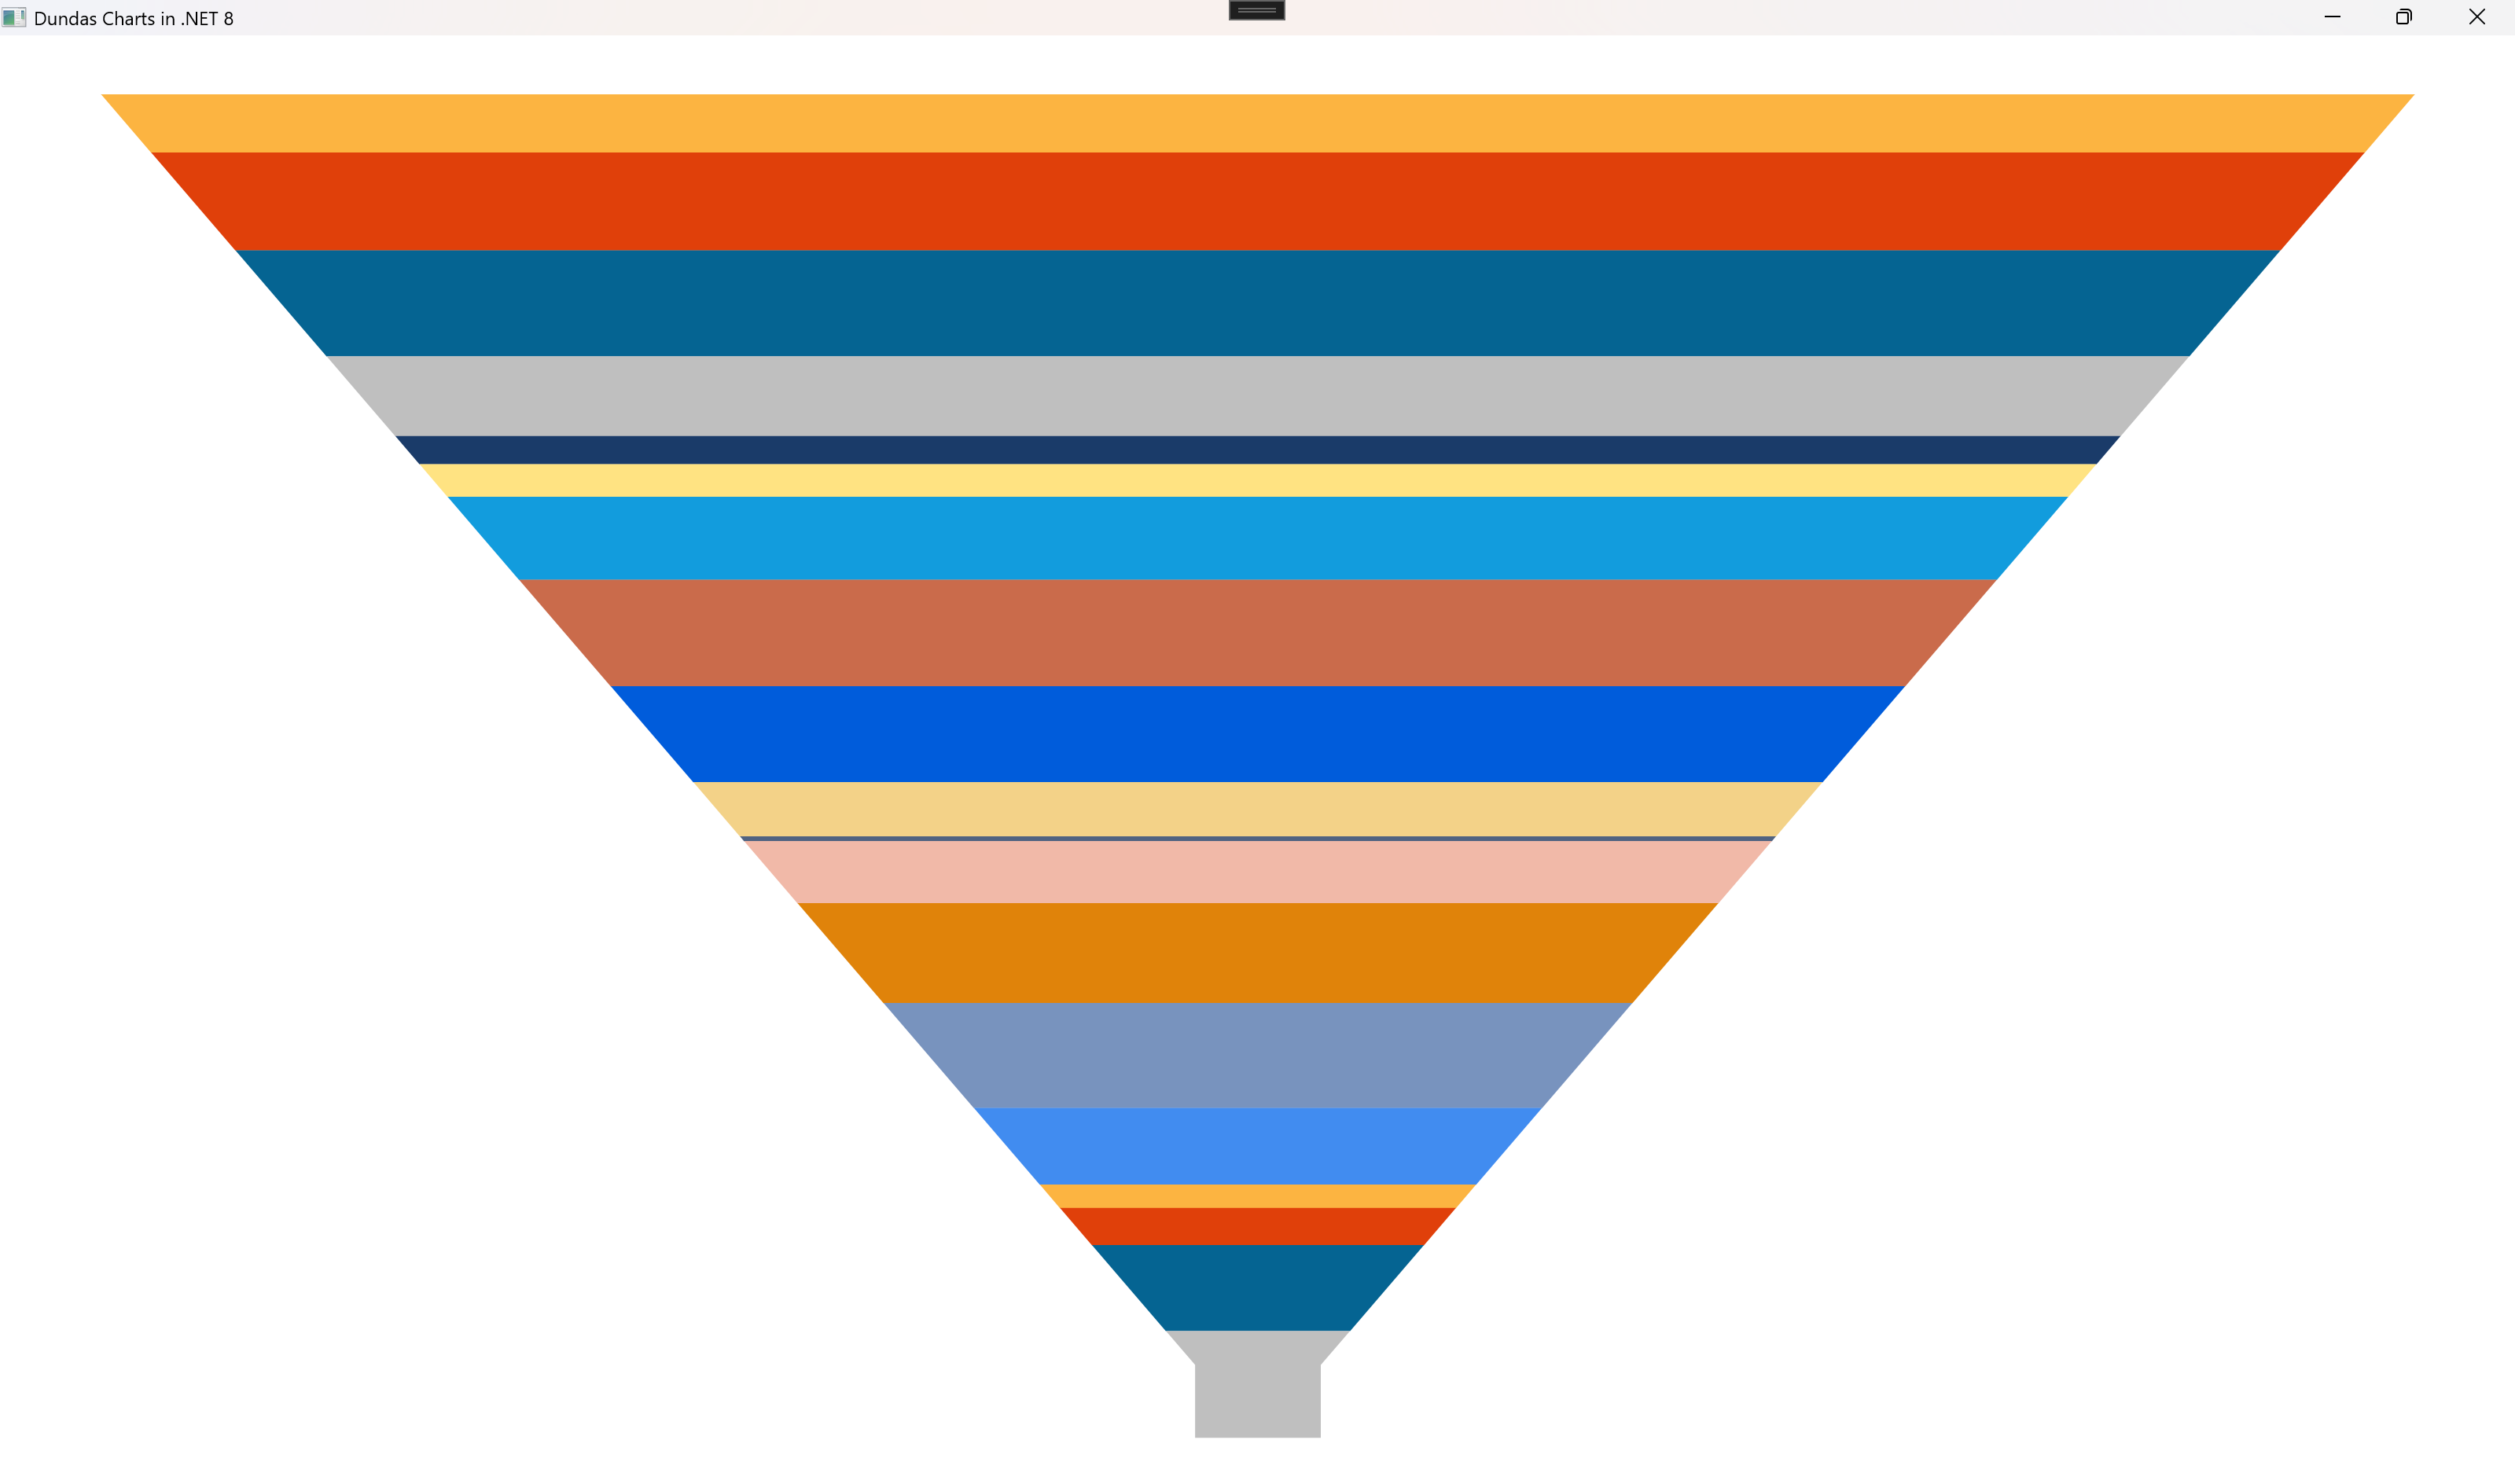
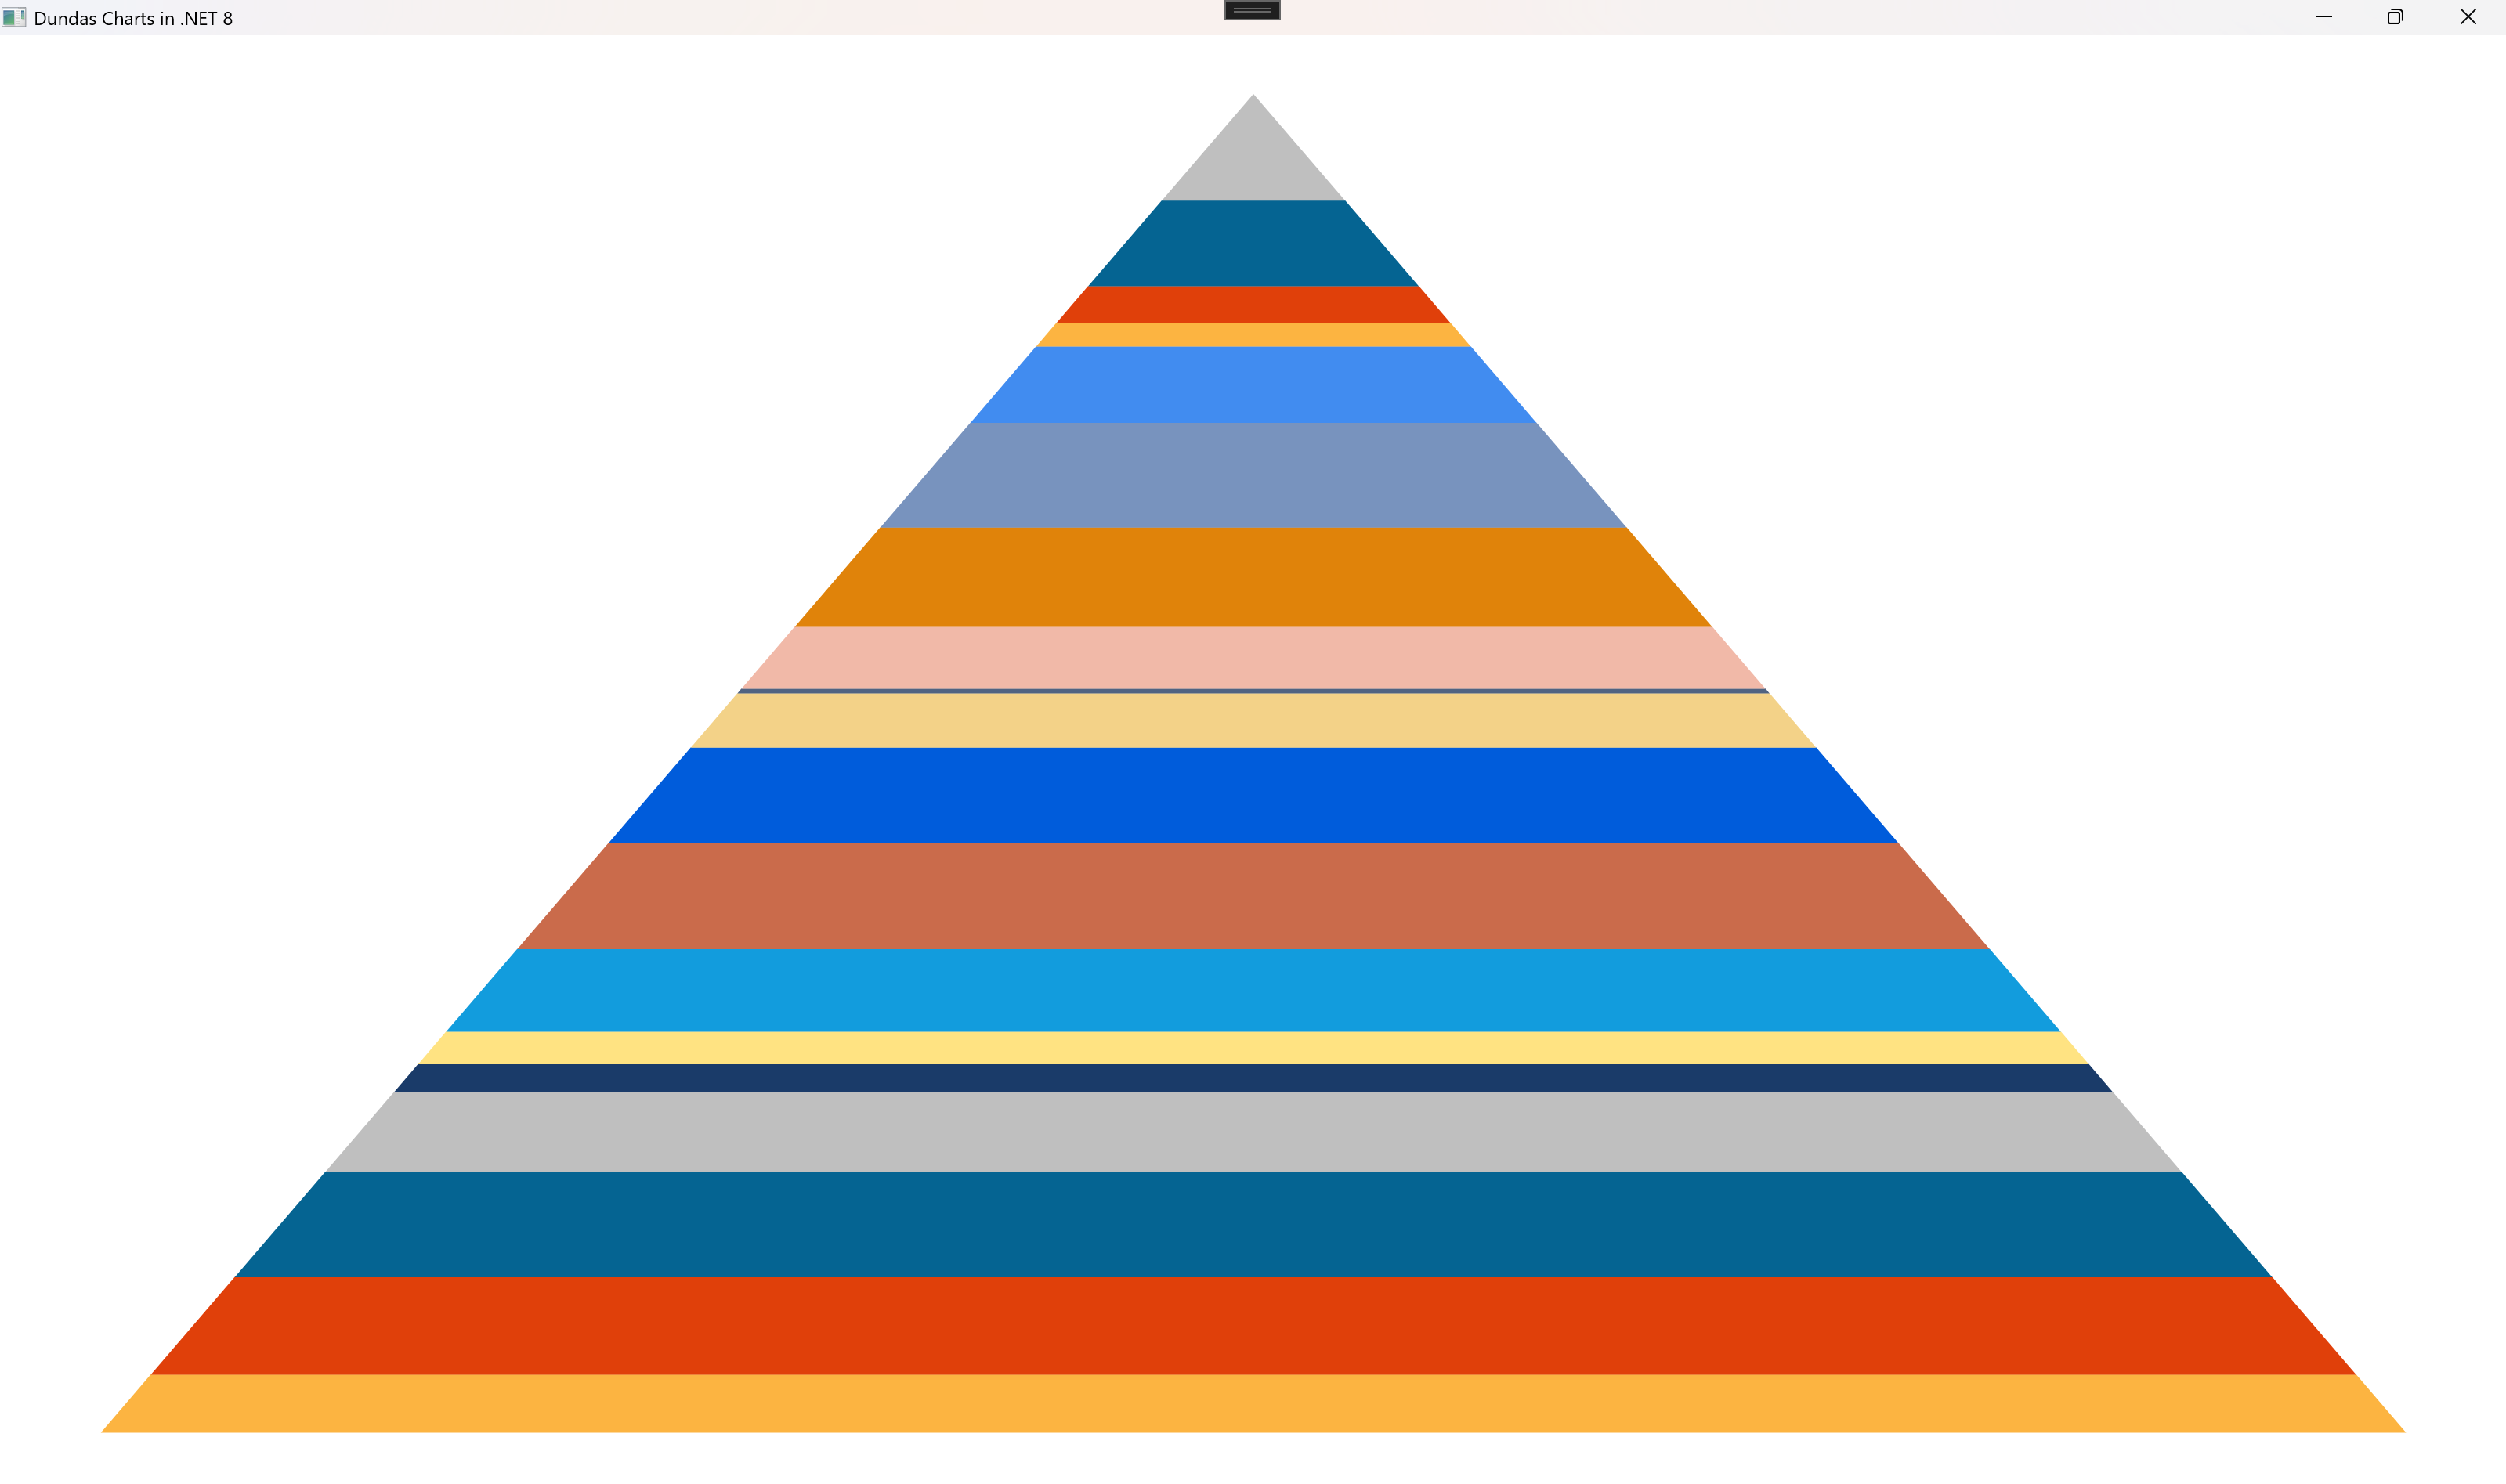
series.ChartType = SeriesChartType.Pyramid;
![]()
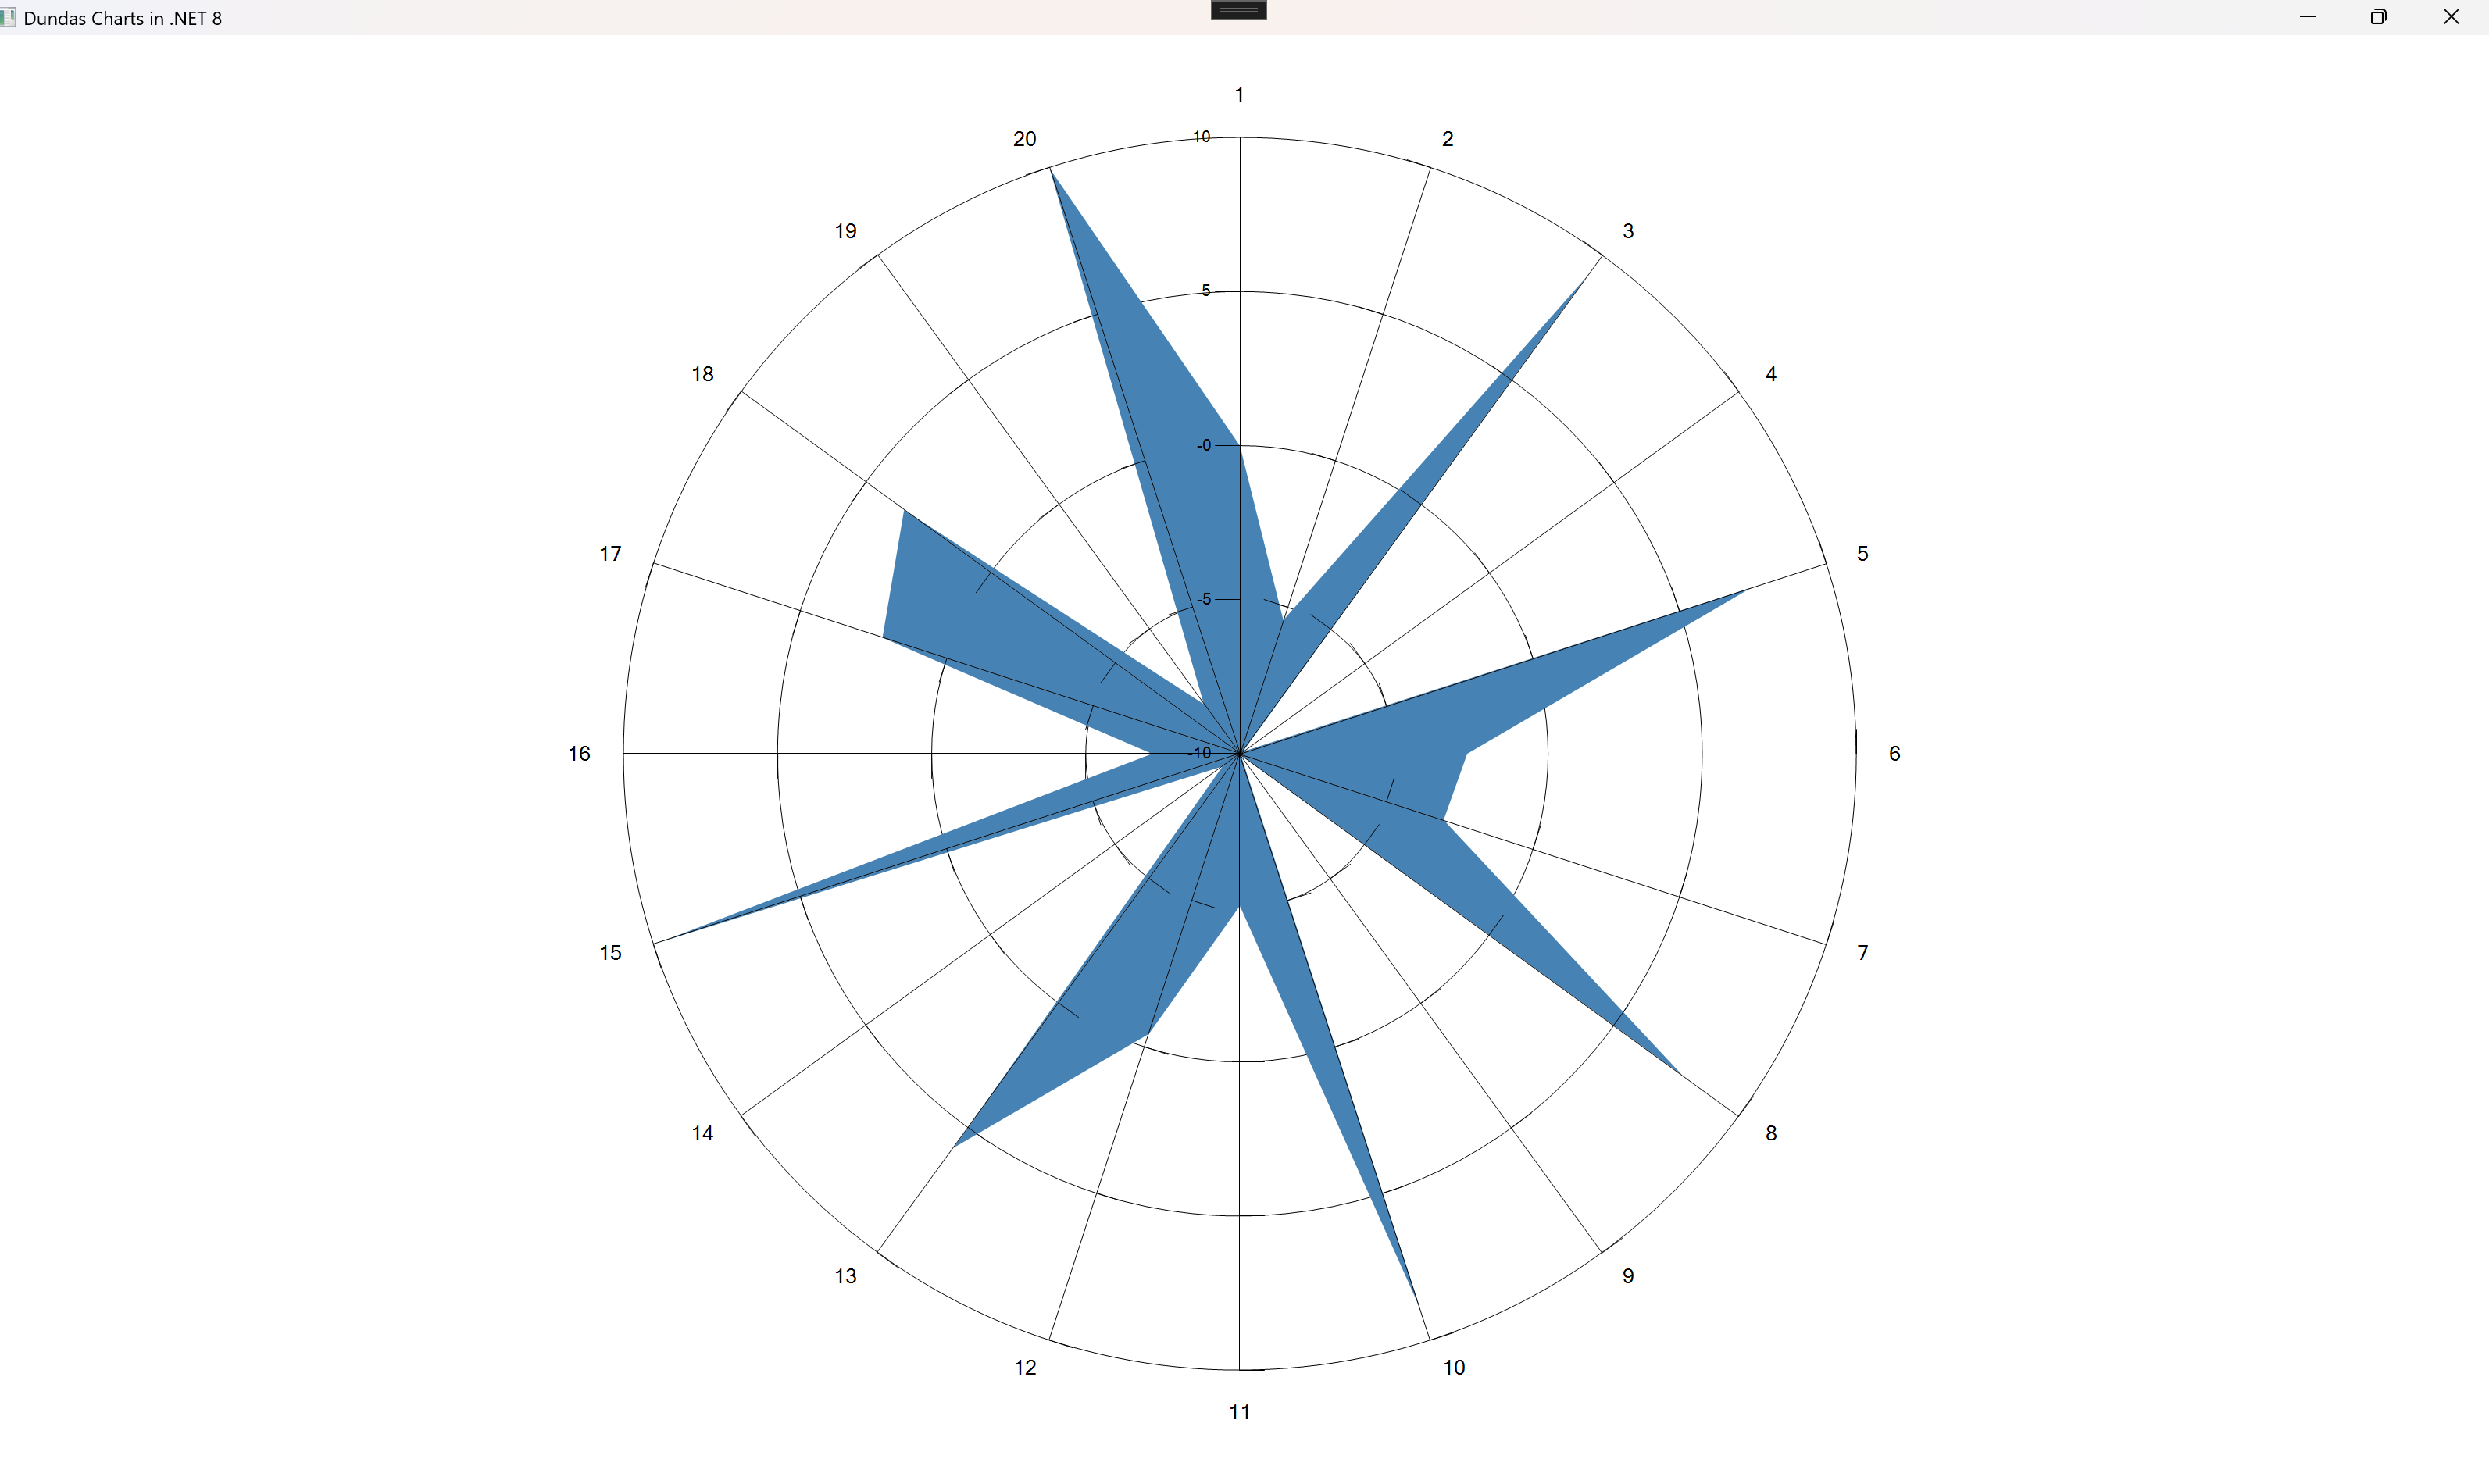
series.ChartType = SeriesChartType.Radar;
![]()
series.ChartType = SeriesChartType.Range;
![]()
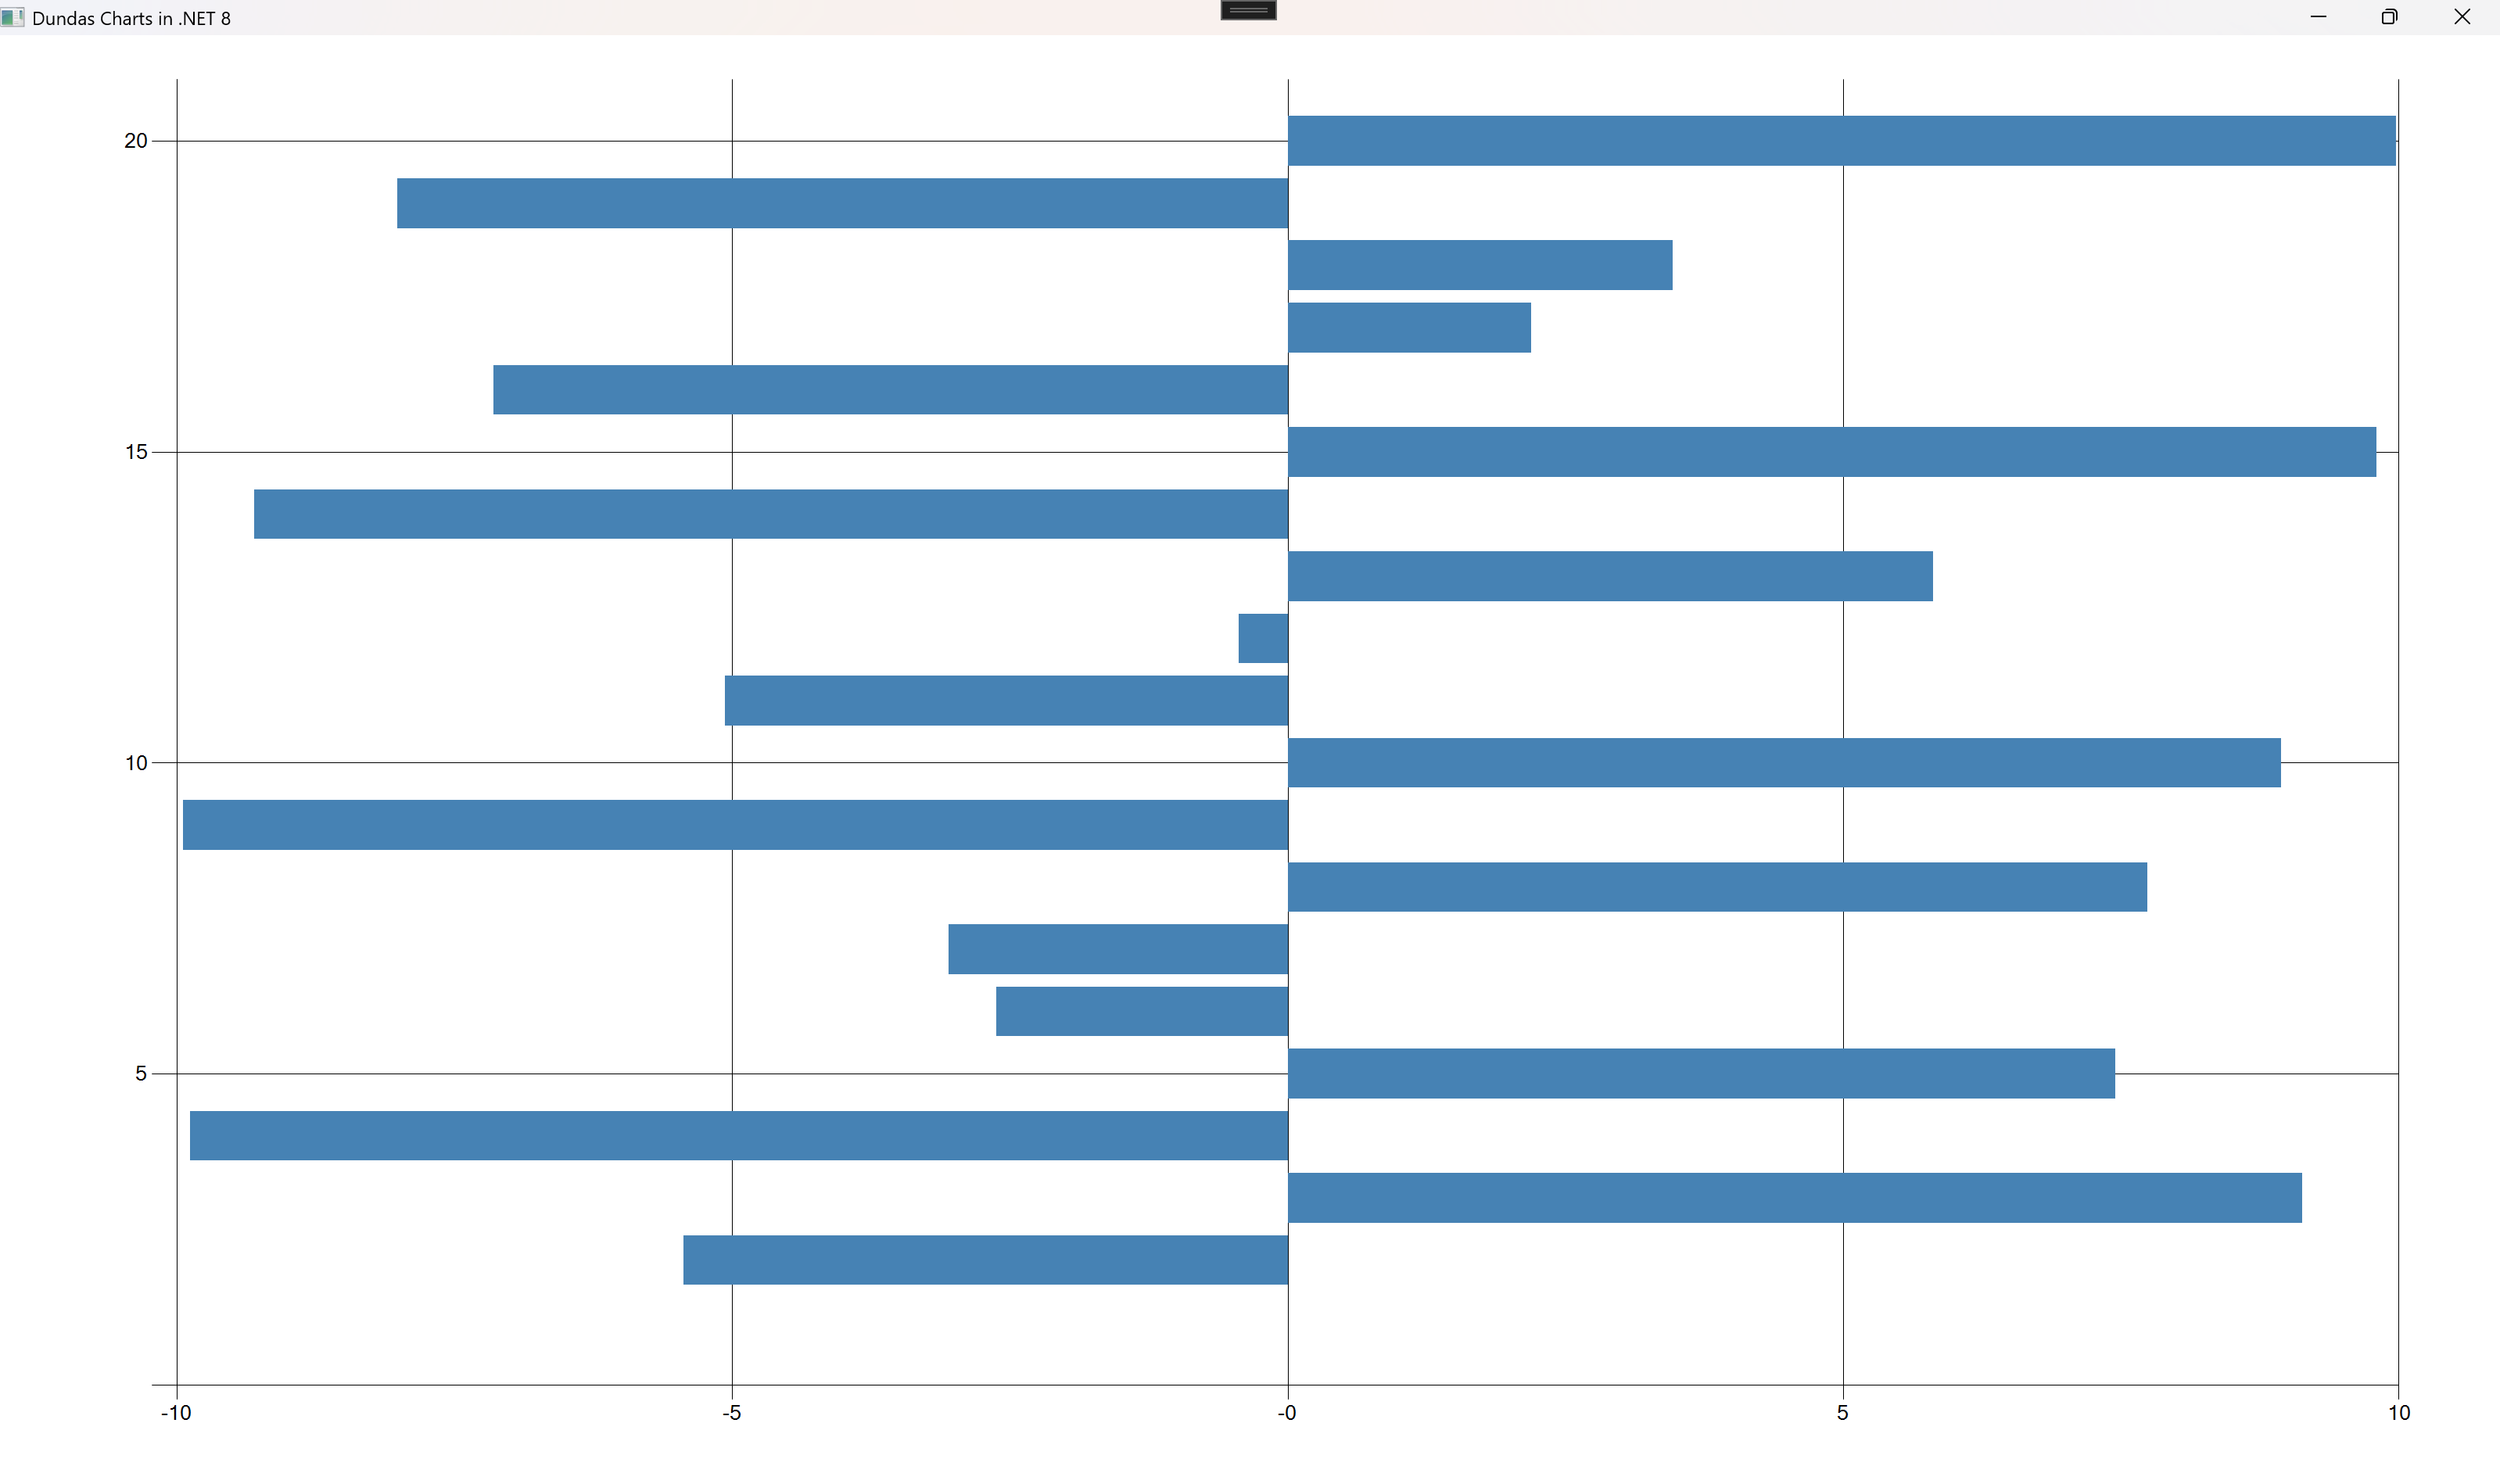
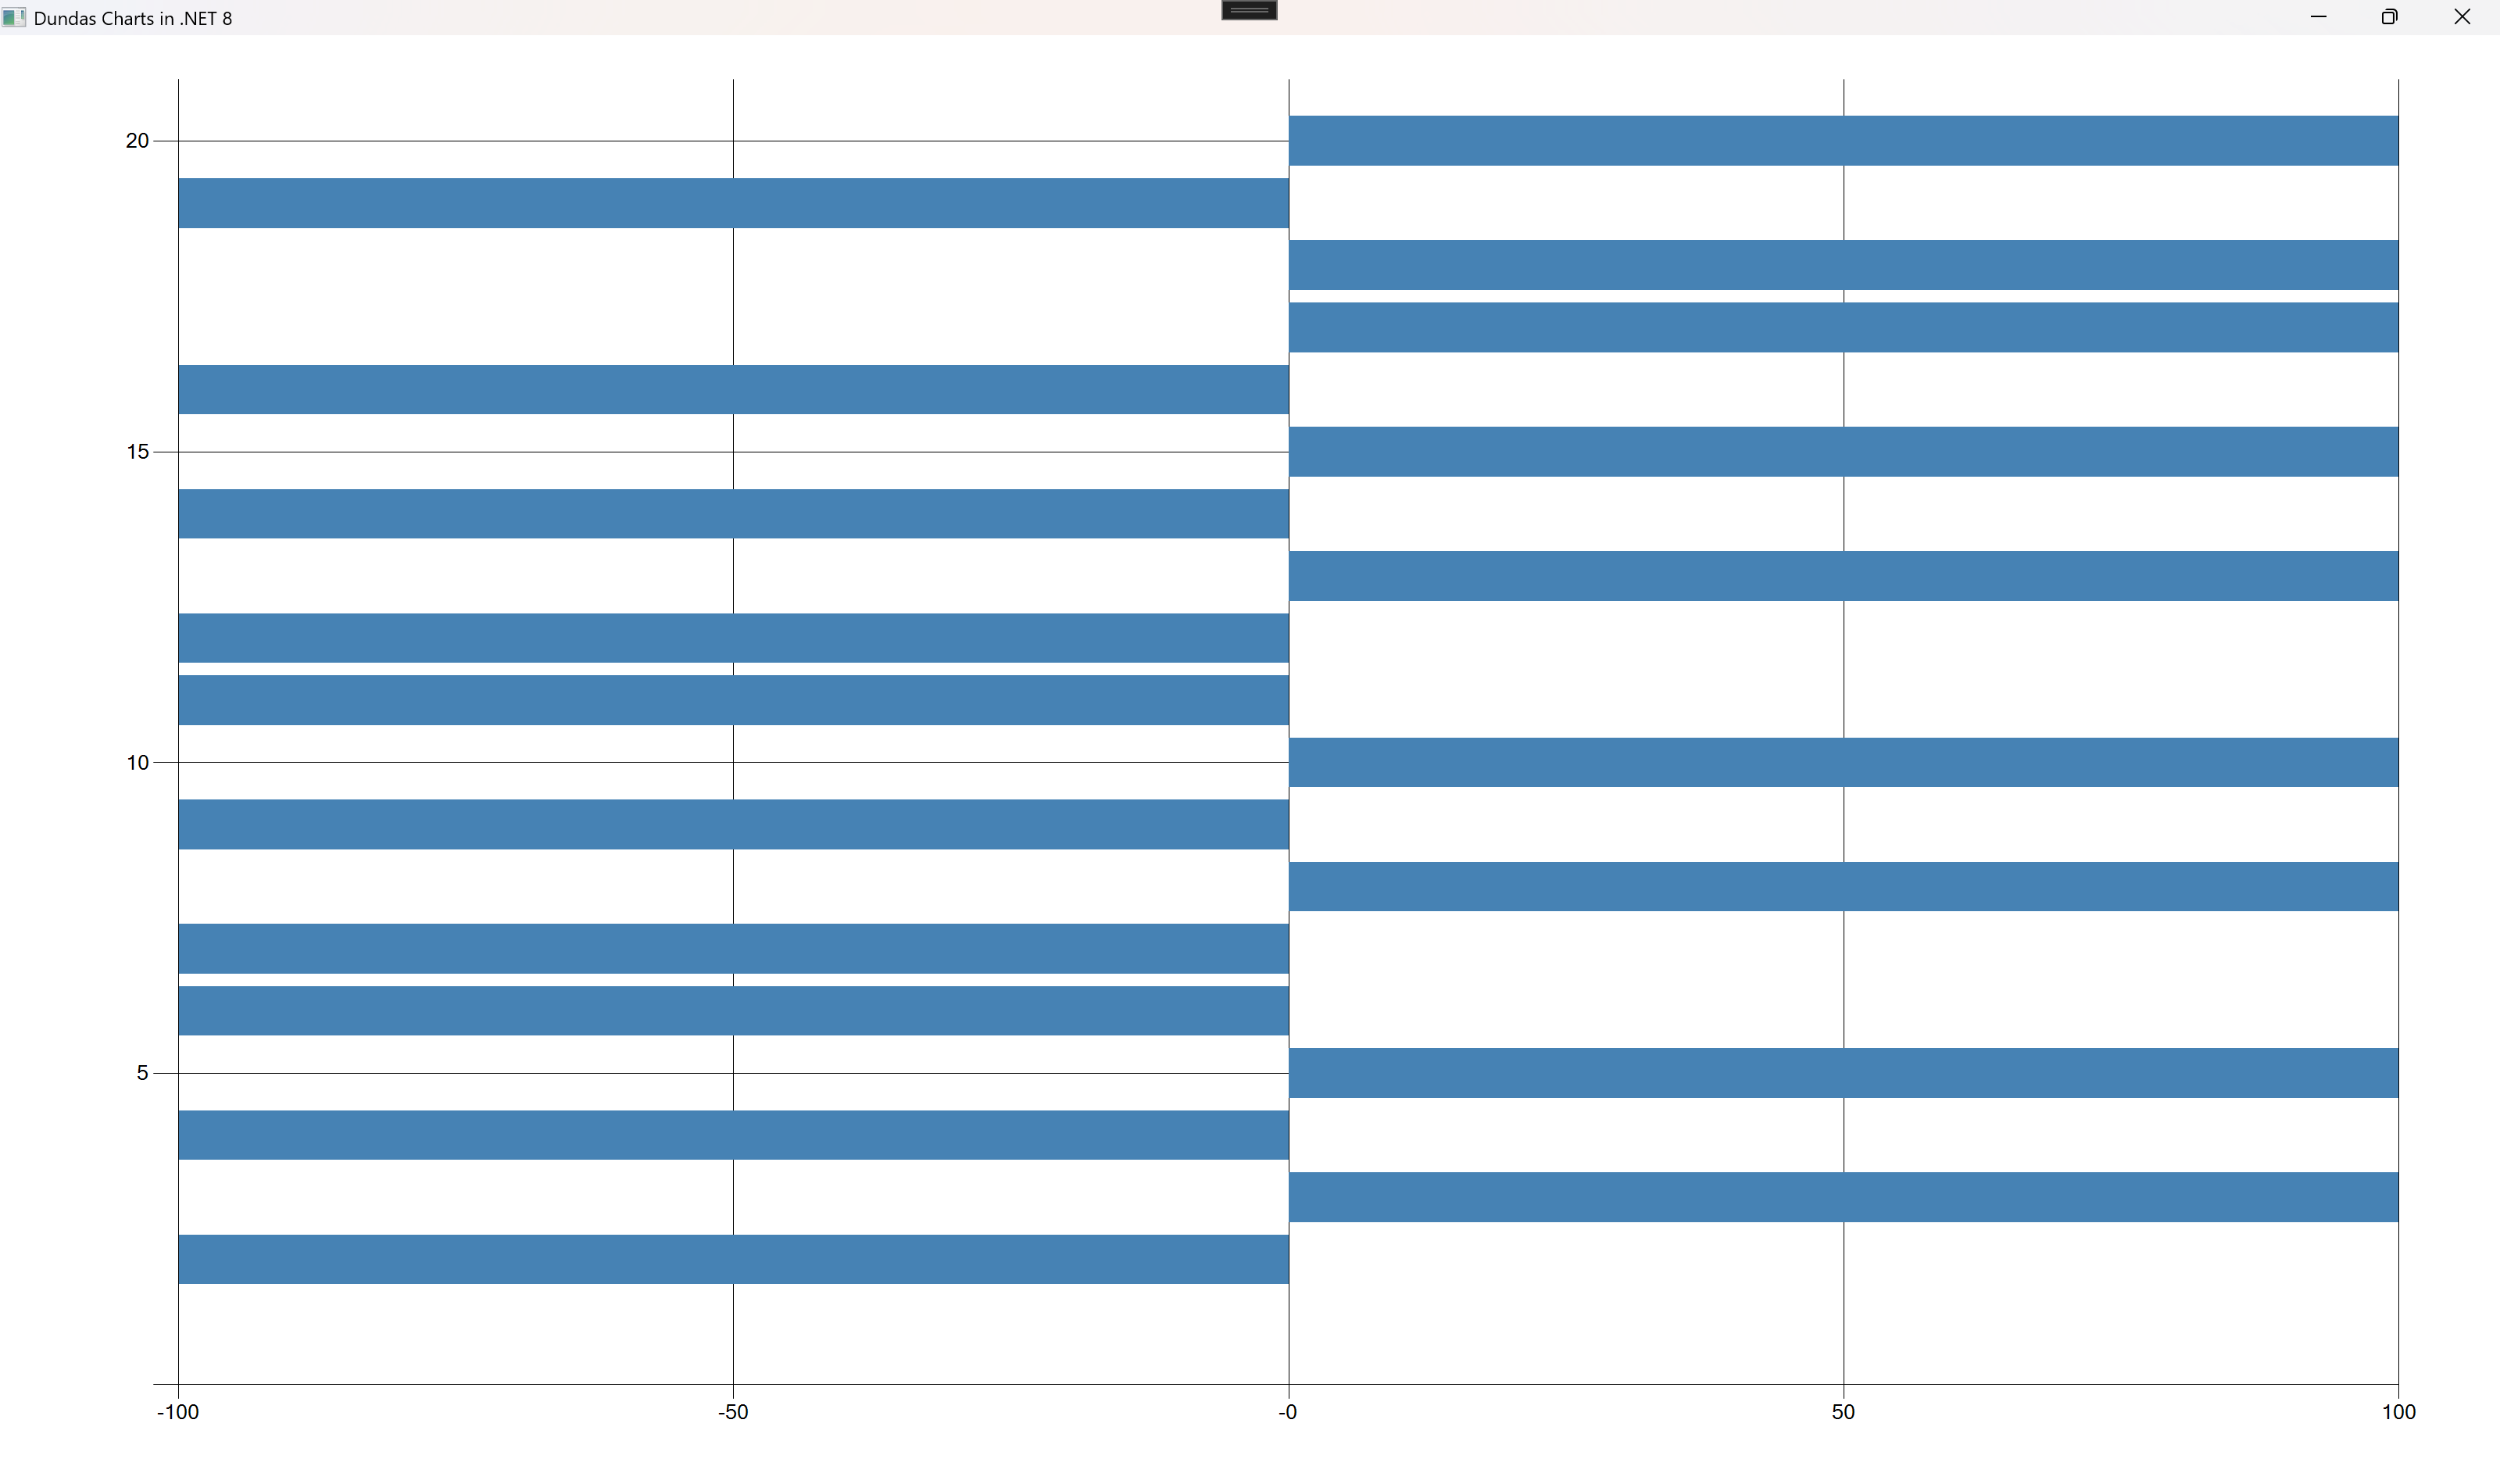
series.ChartType = SeriesChartType.RangeBar;
![]()
series.ChartType = SeriesChartType.RangeColumn;
![]()
series.ChartType = SeriesChartType.Renko;
![]()
series.ChartType = SeriesChartType.Spline;
![]()
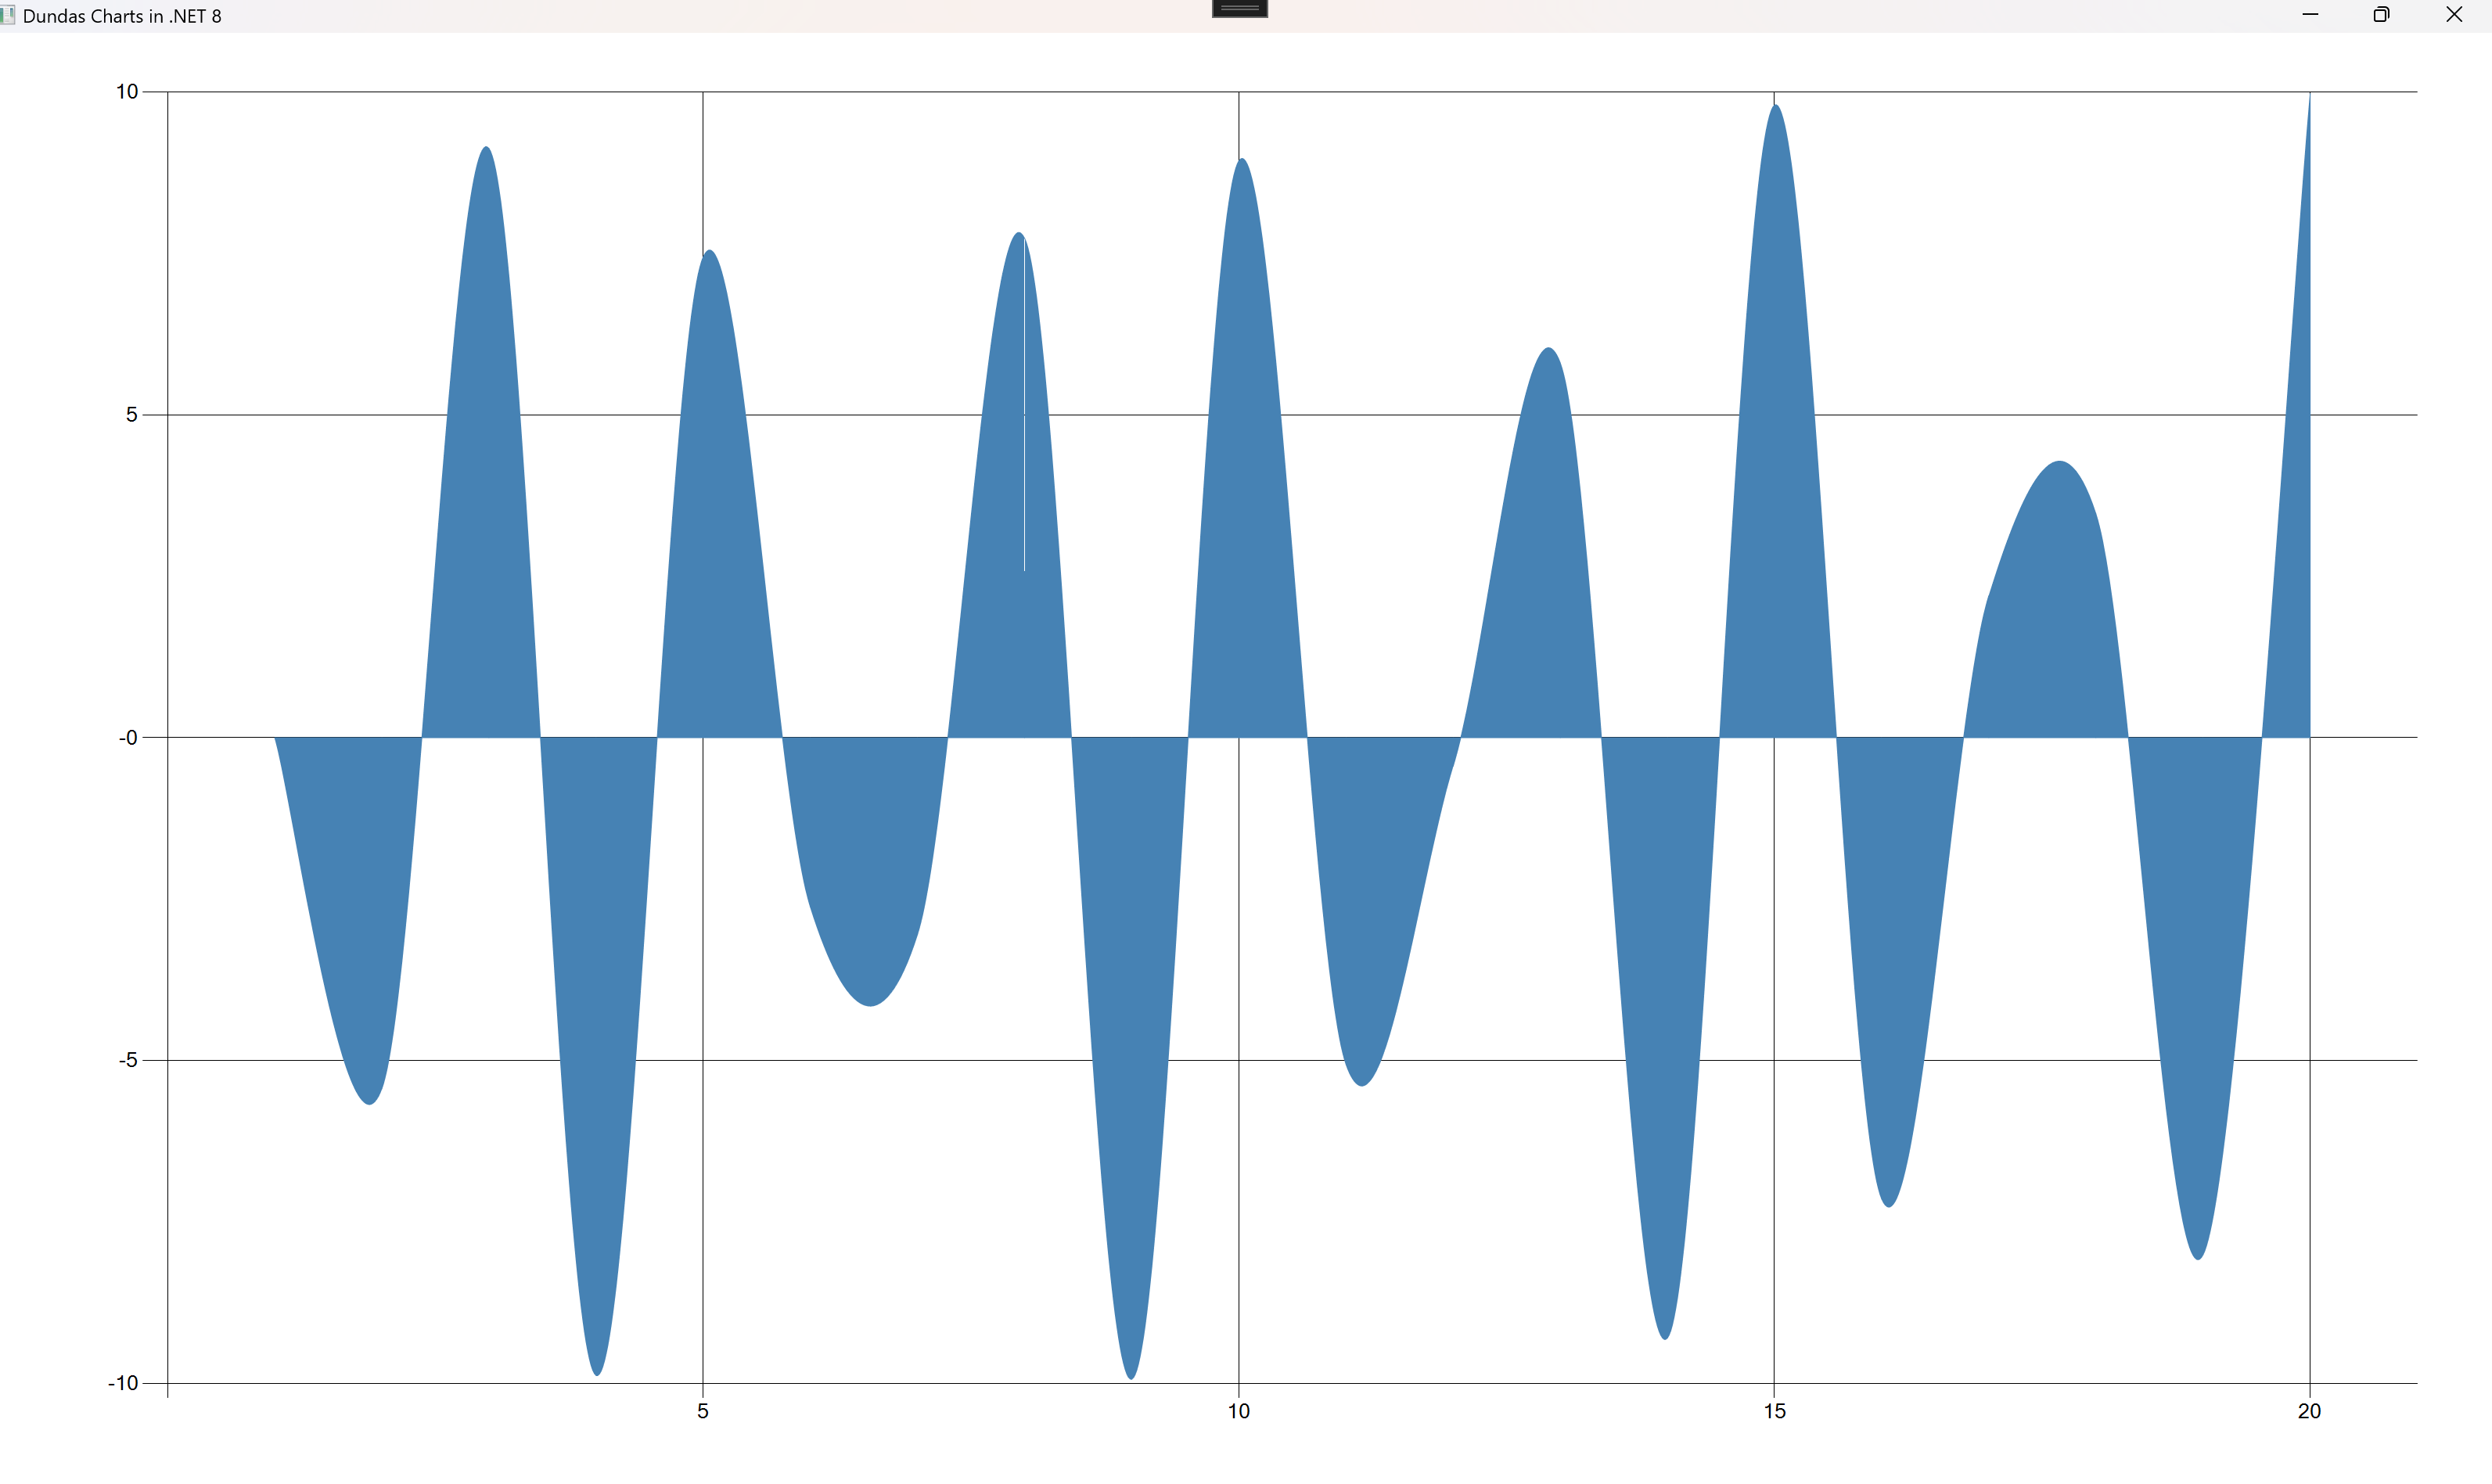
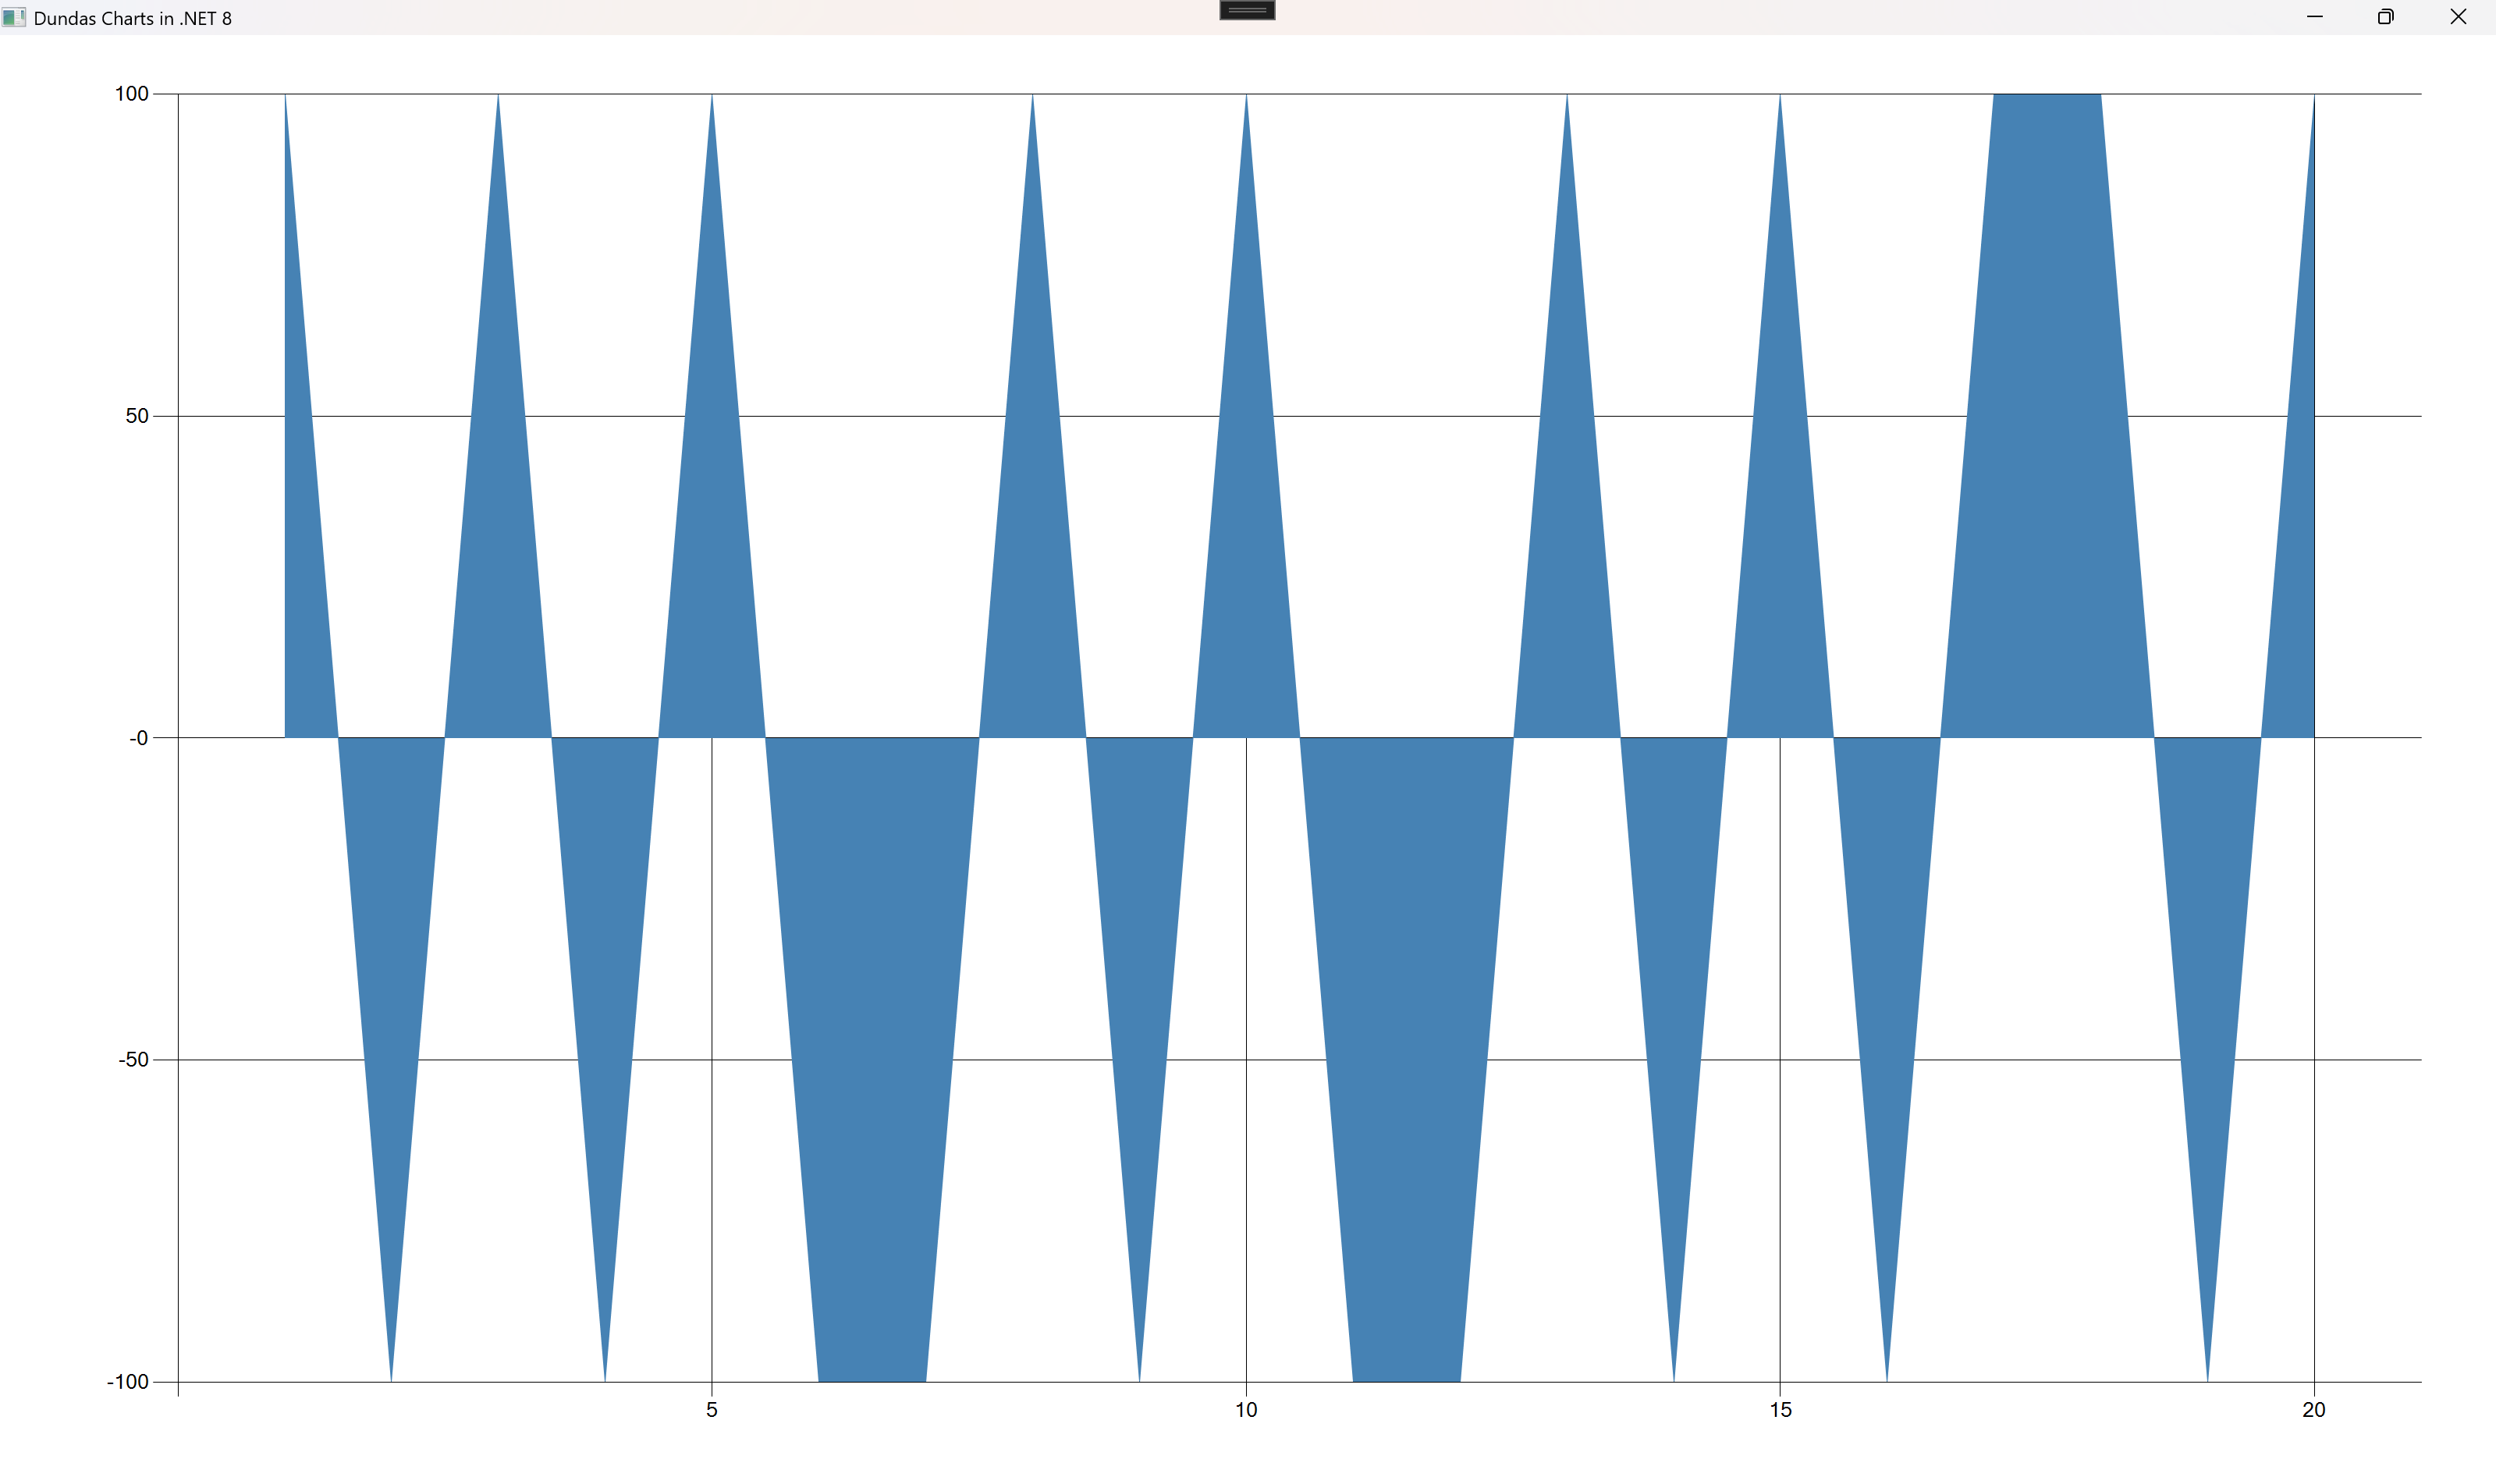
series.ChartType = SeriesChartType.SplineArea;
![]()
series.ChartType = SeriesChartType.SplineRange;
![]()
series.ChartType = SeriesChartType.StackedArea;
![]()
series.ChartType = SeriesChartType.StackedArea100;
![]()
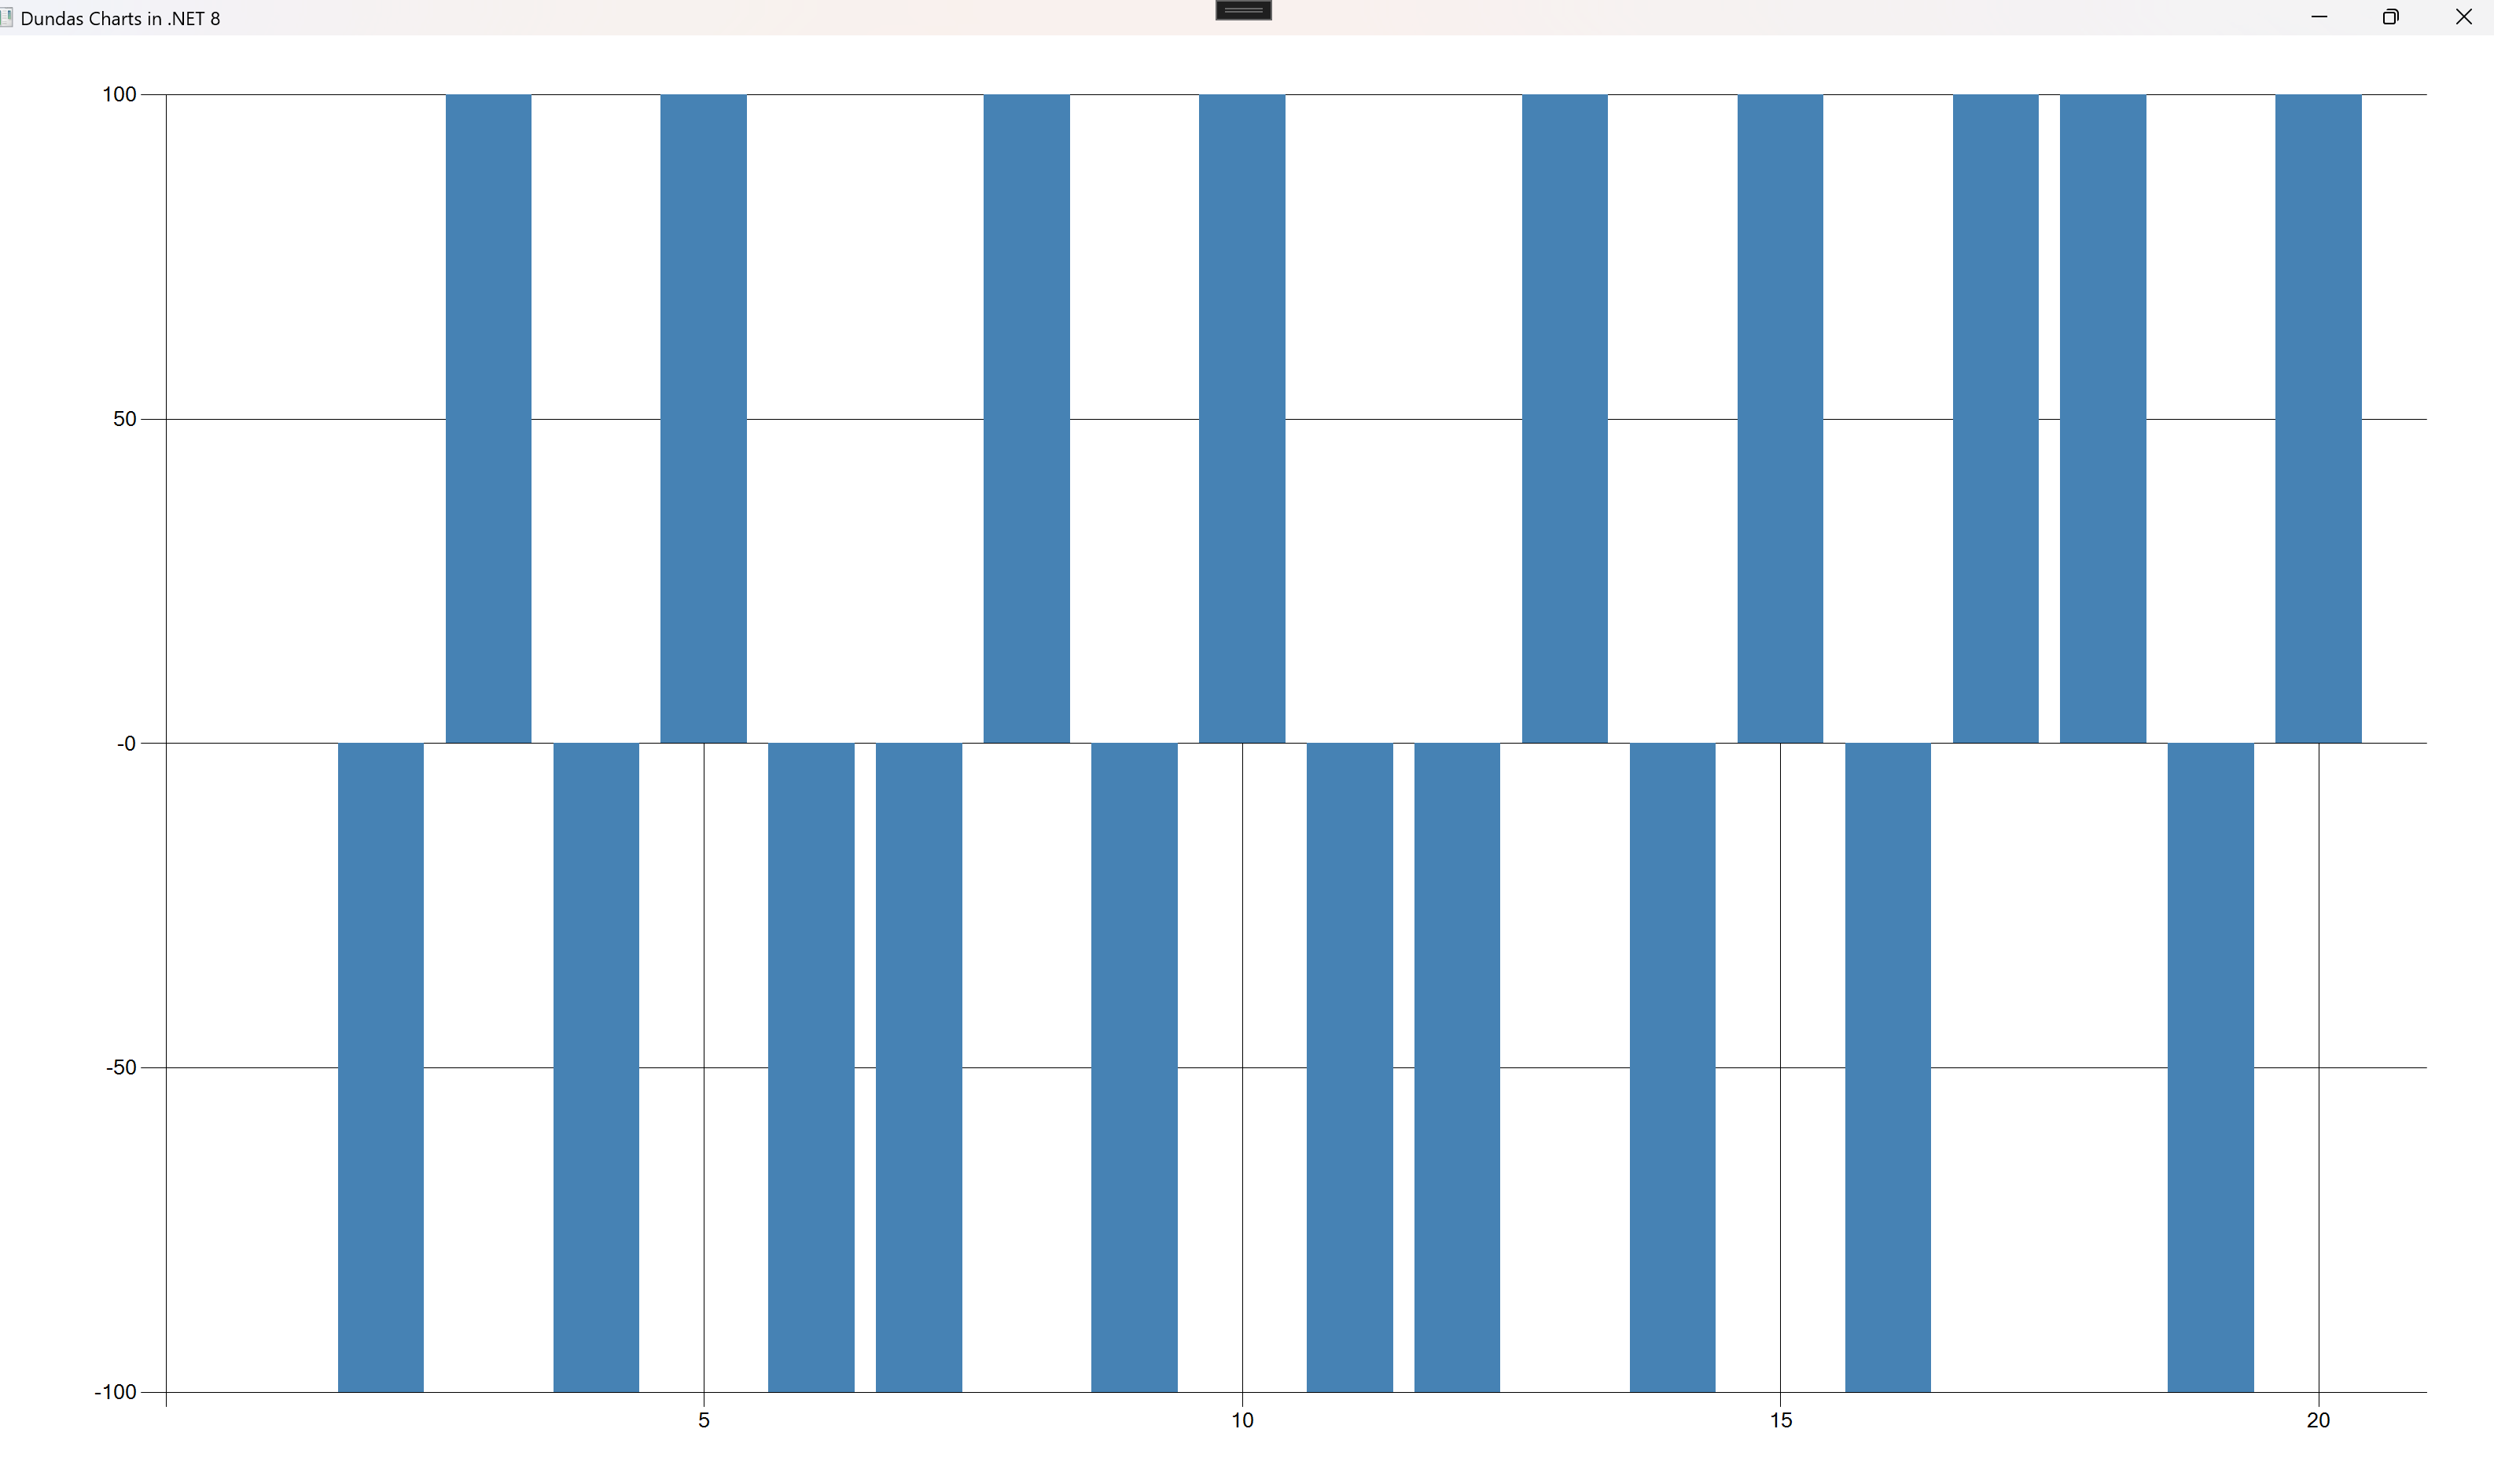
series.ChartType = SeriesChartType.StackedBar;
![]()
series.ChartType = SeriesChartType.StackedBar100;
![]()
series.ChartType = SeriesChartType.StackedColumn;
![]()
series.ChartType = SeriesChartType.StackedColumn100;
![]()
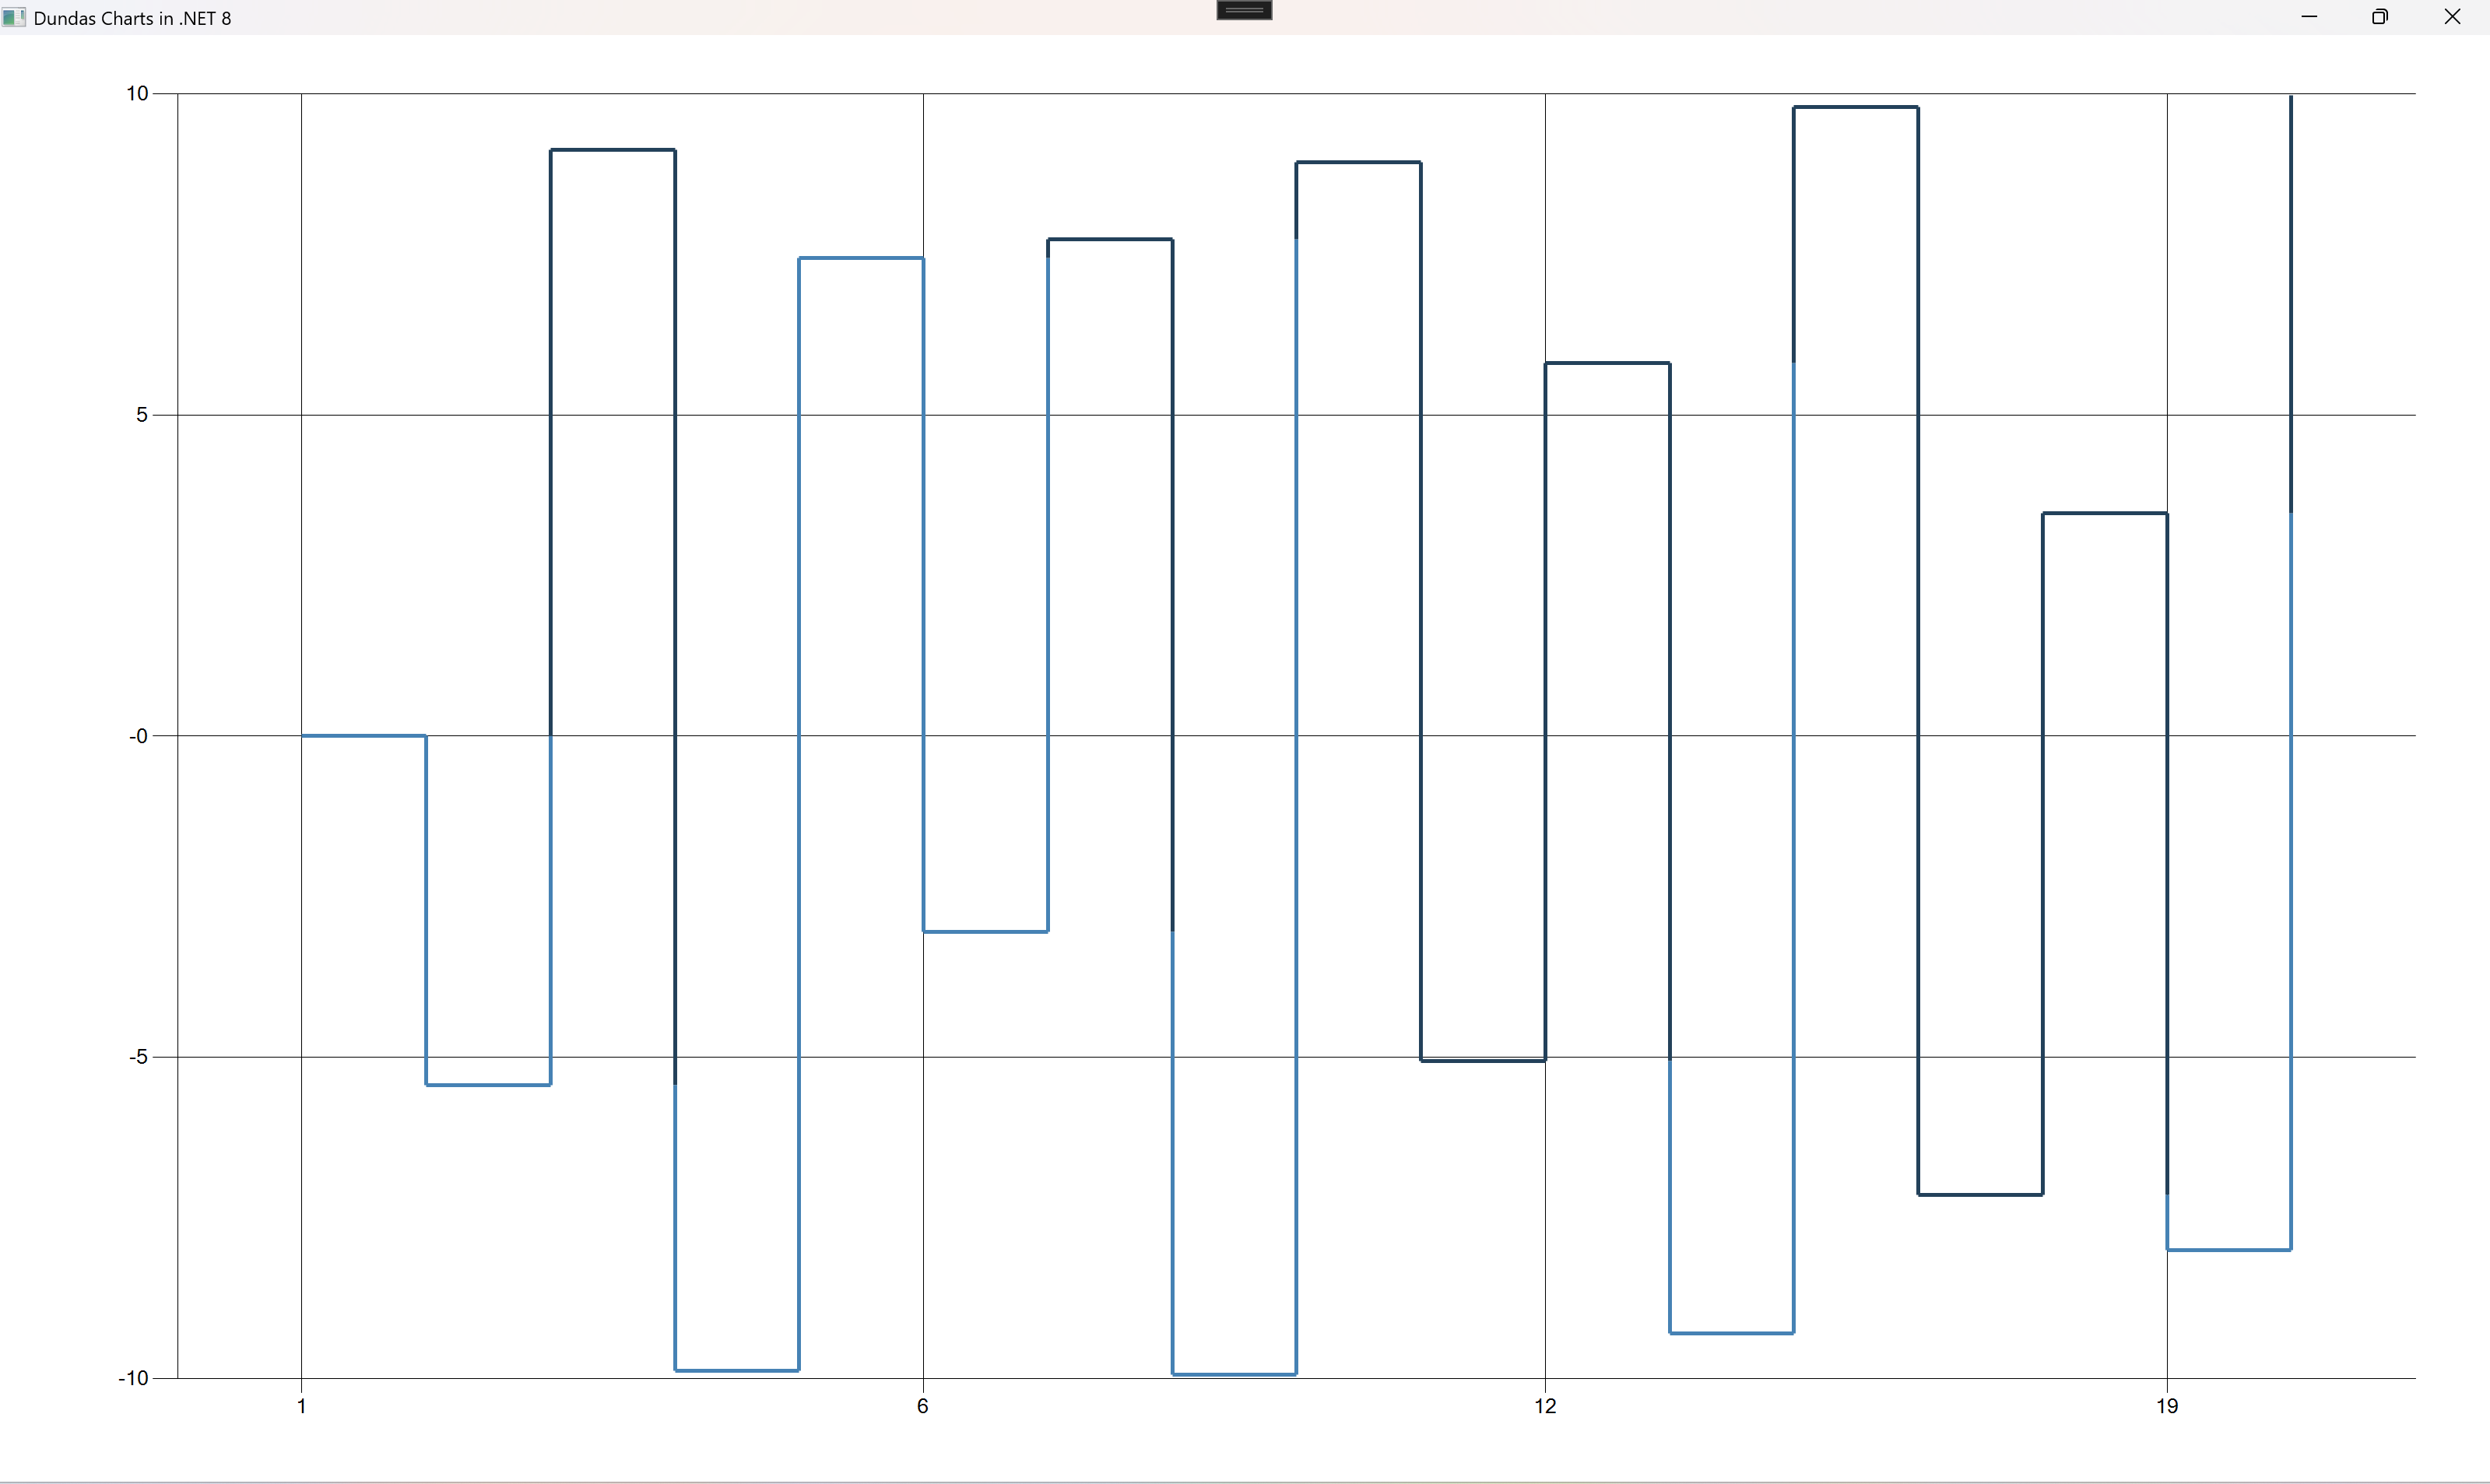
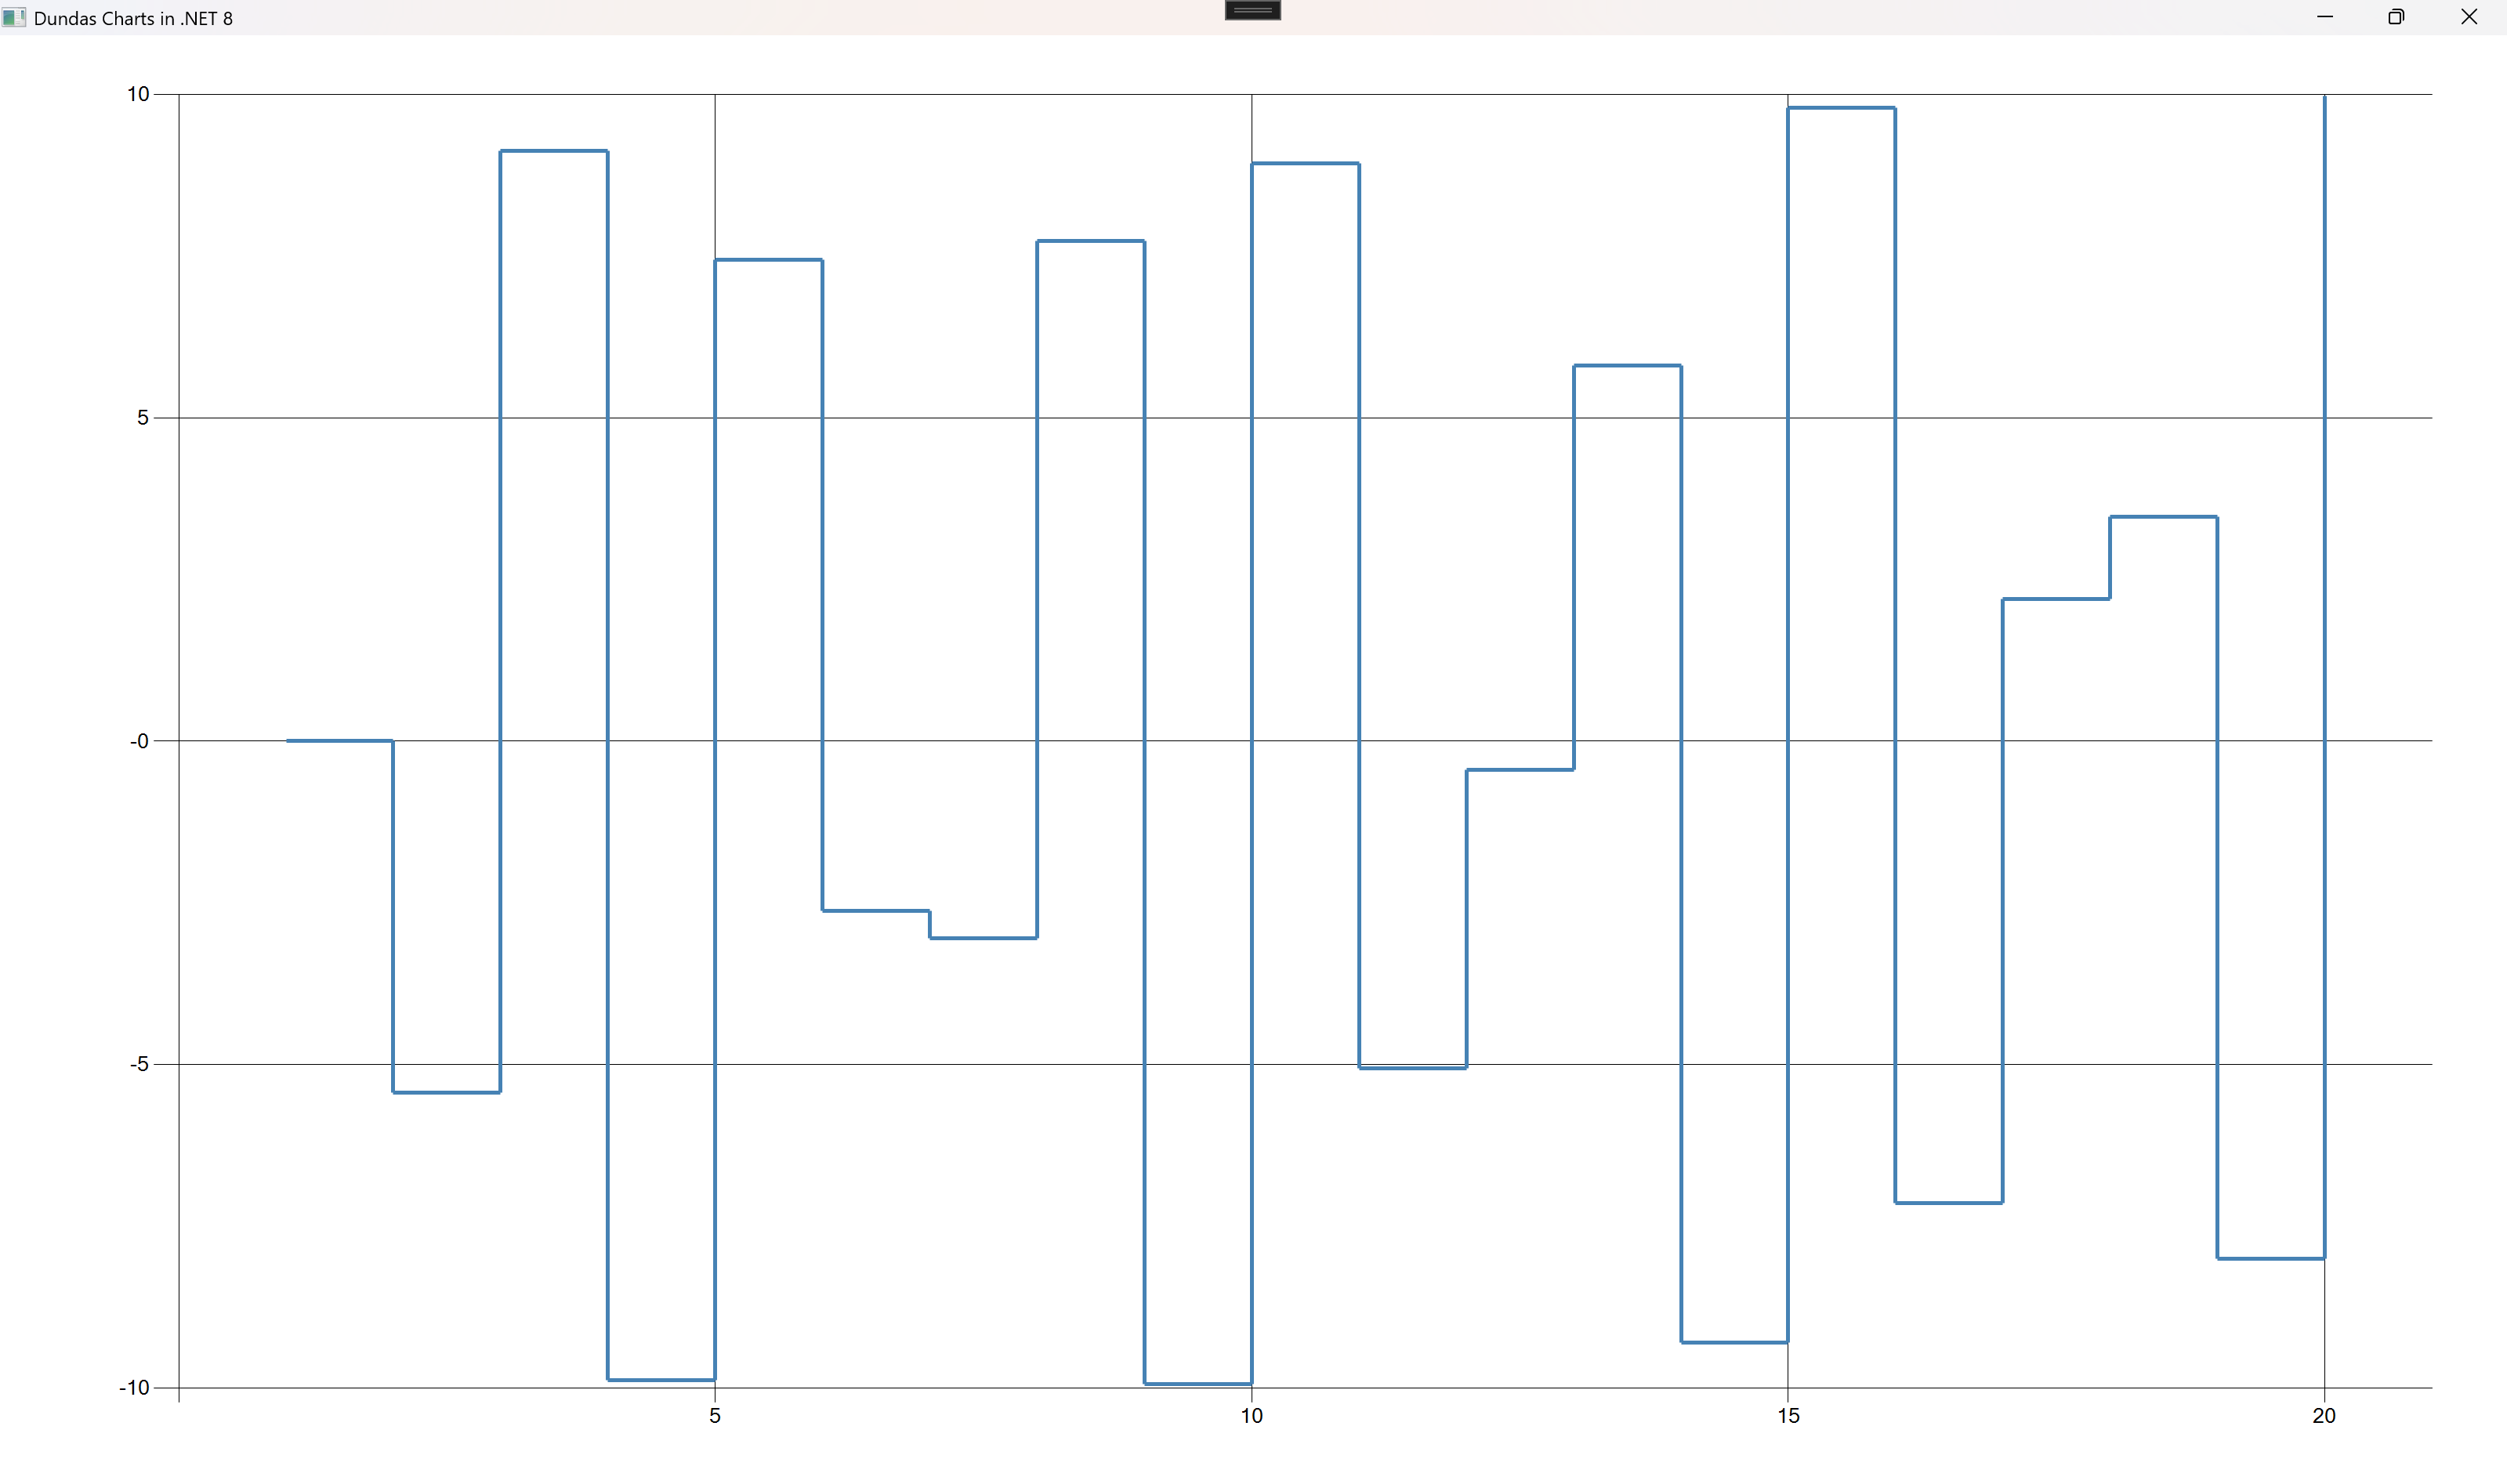
series.ChartType = SeriesChartType.StepLine;
![]()
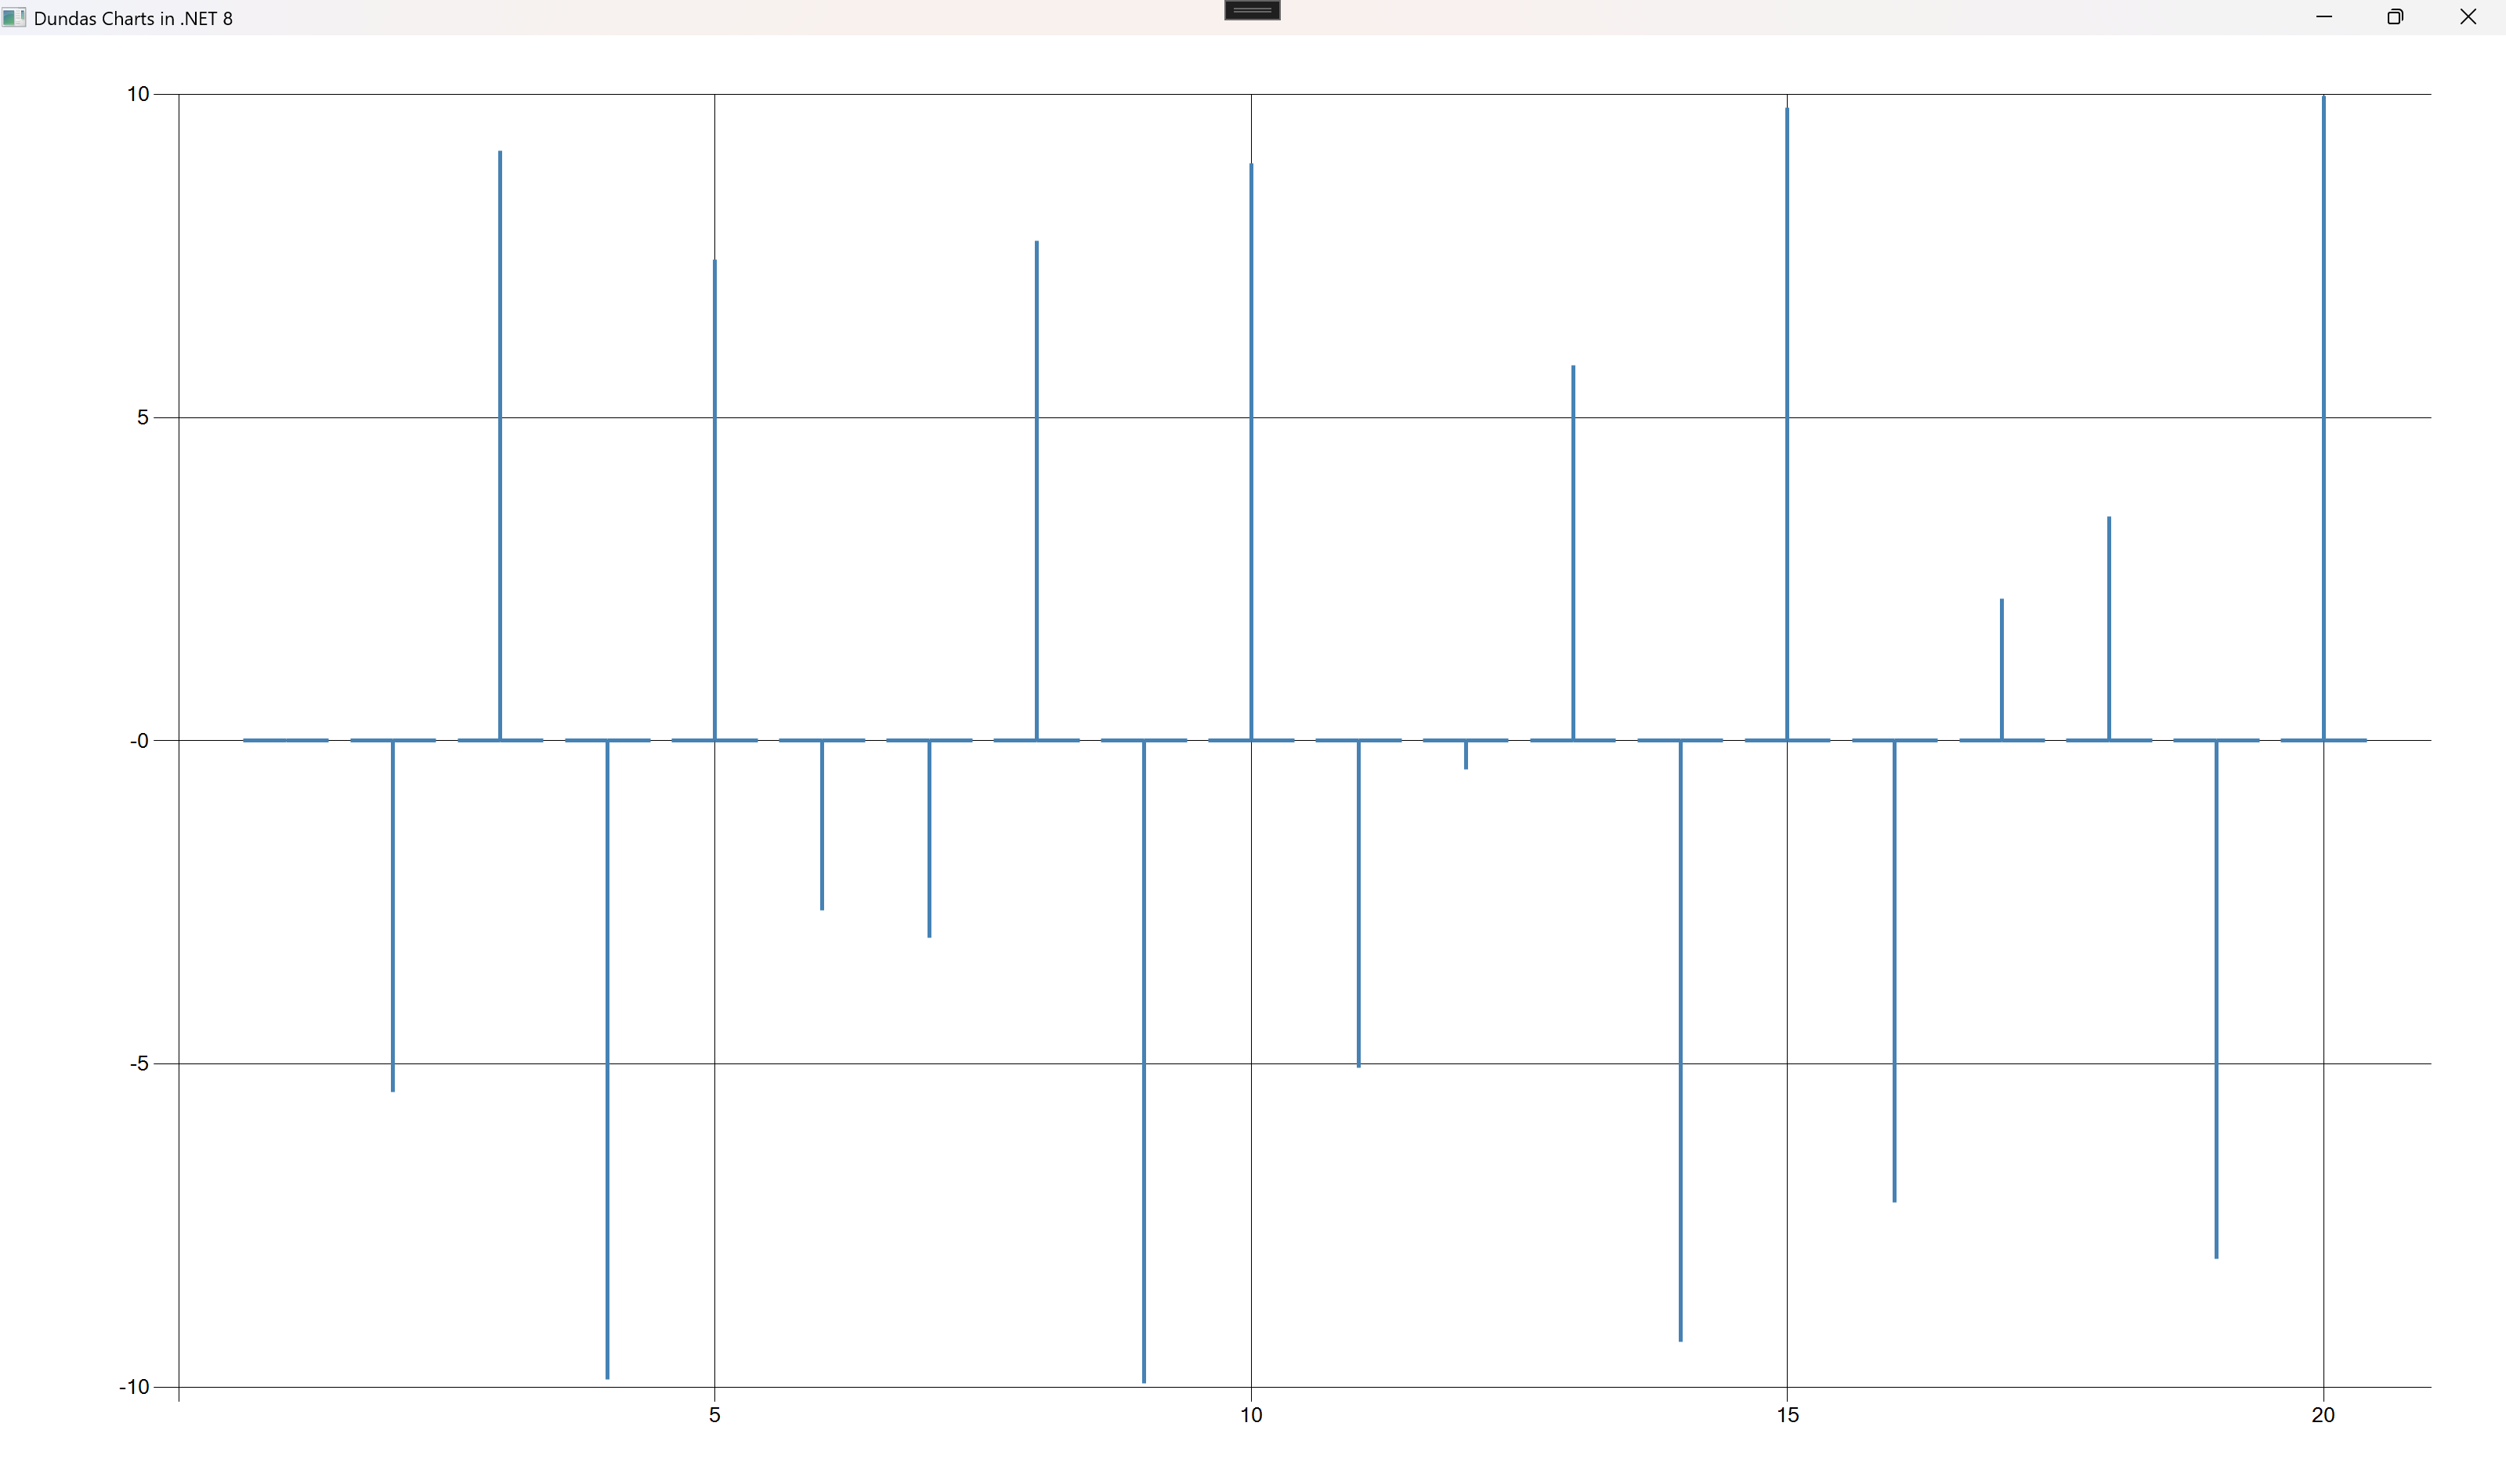
series.ChartType = SeriesChartType.Stock;
![]()
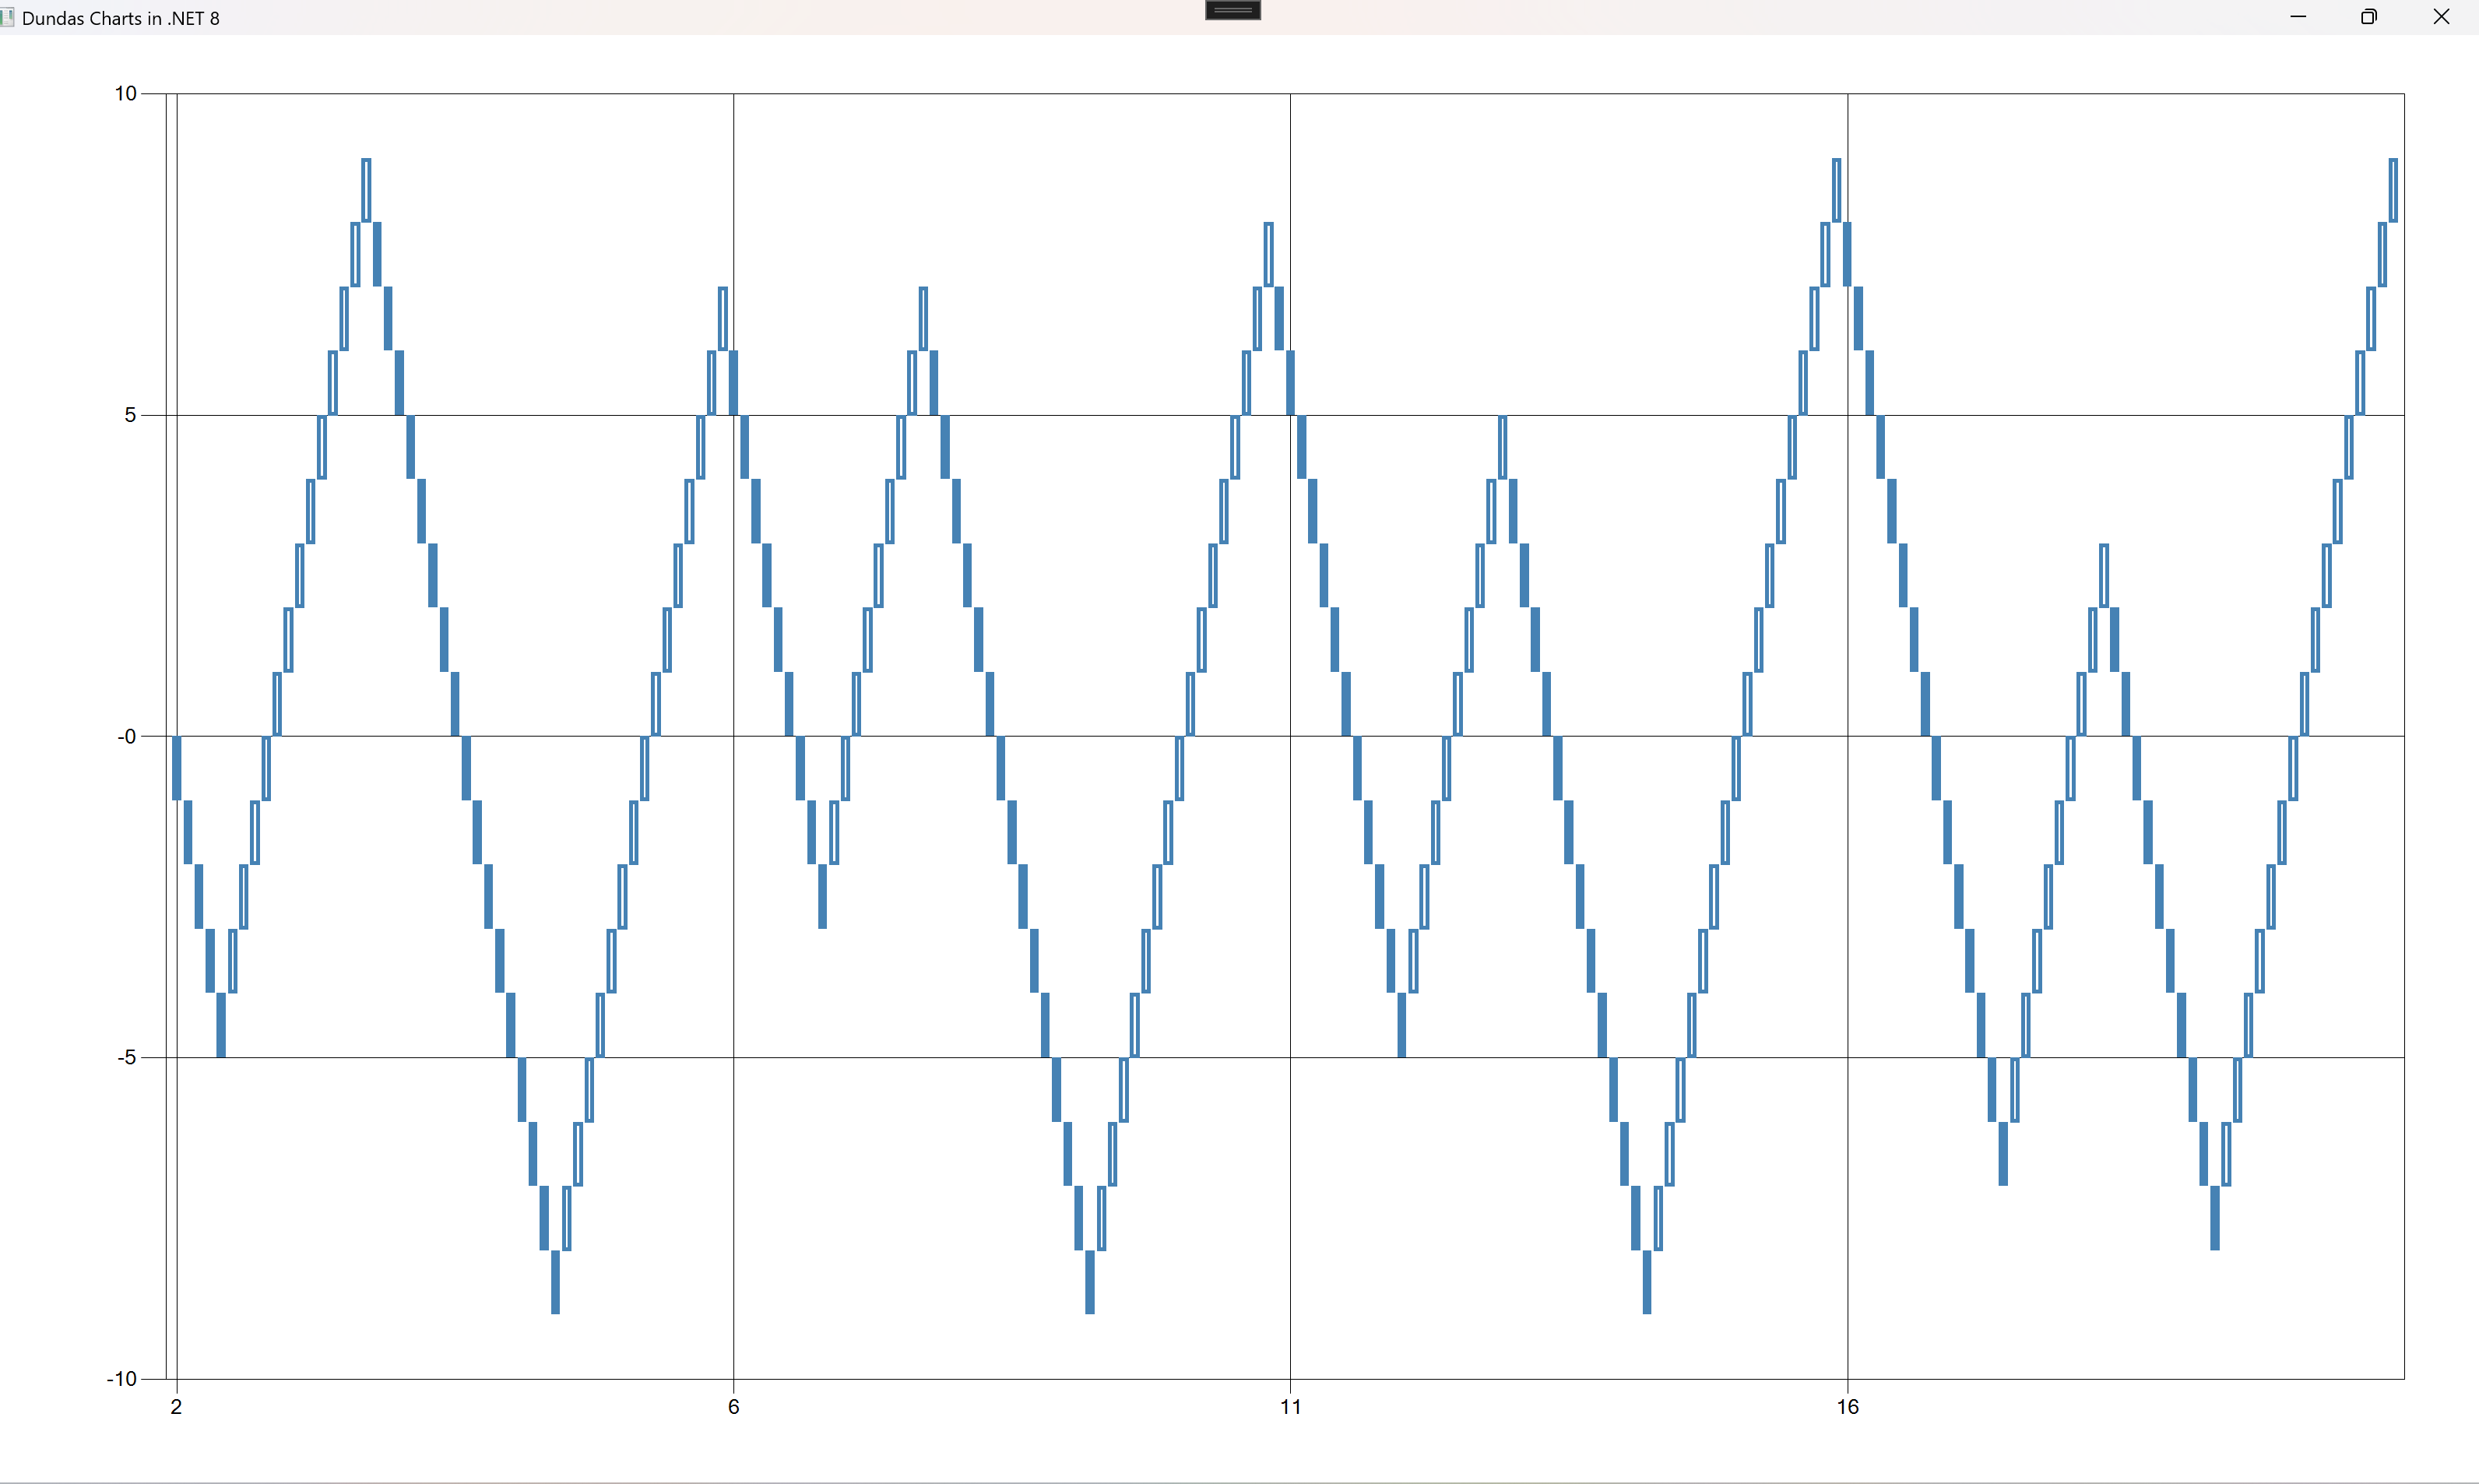
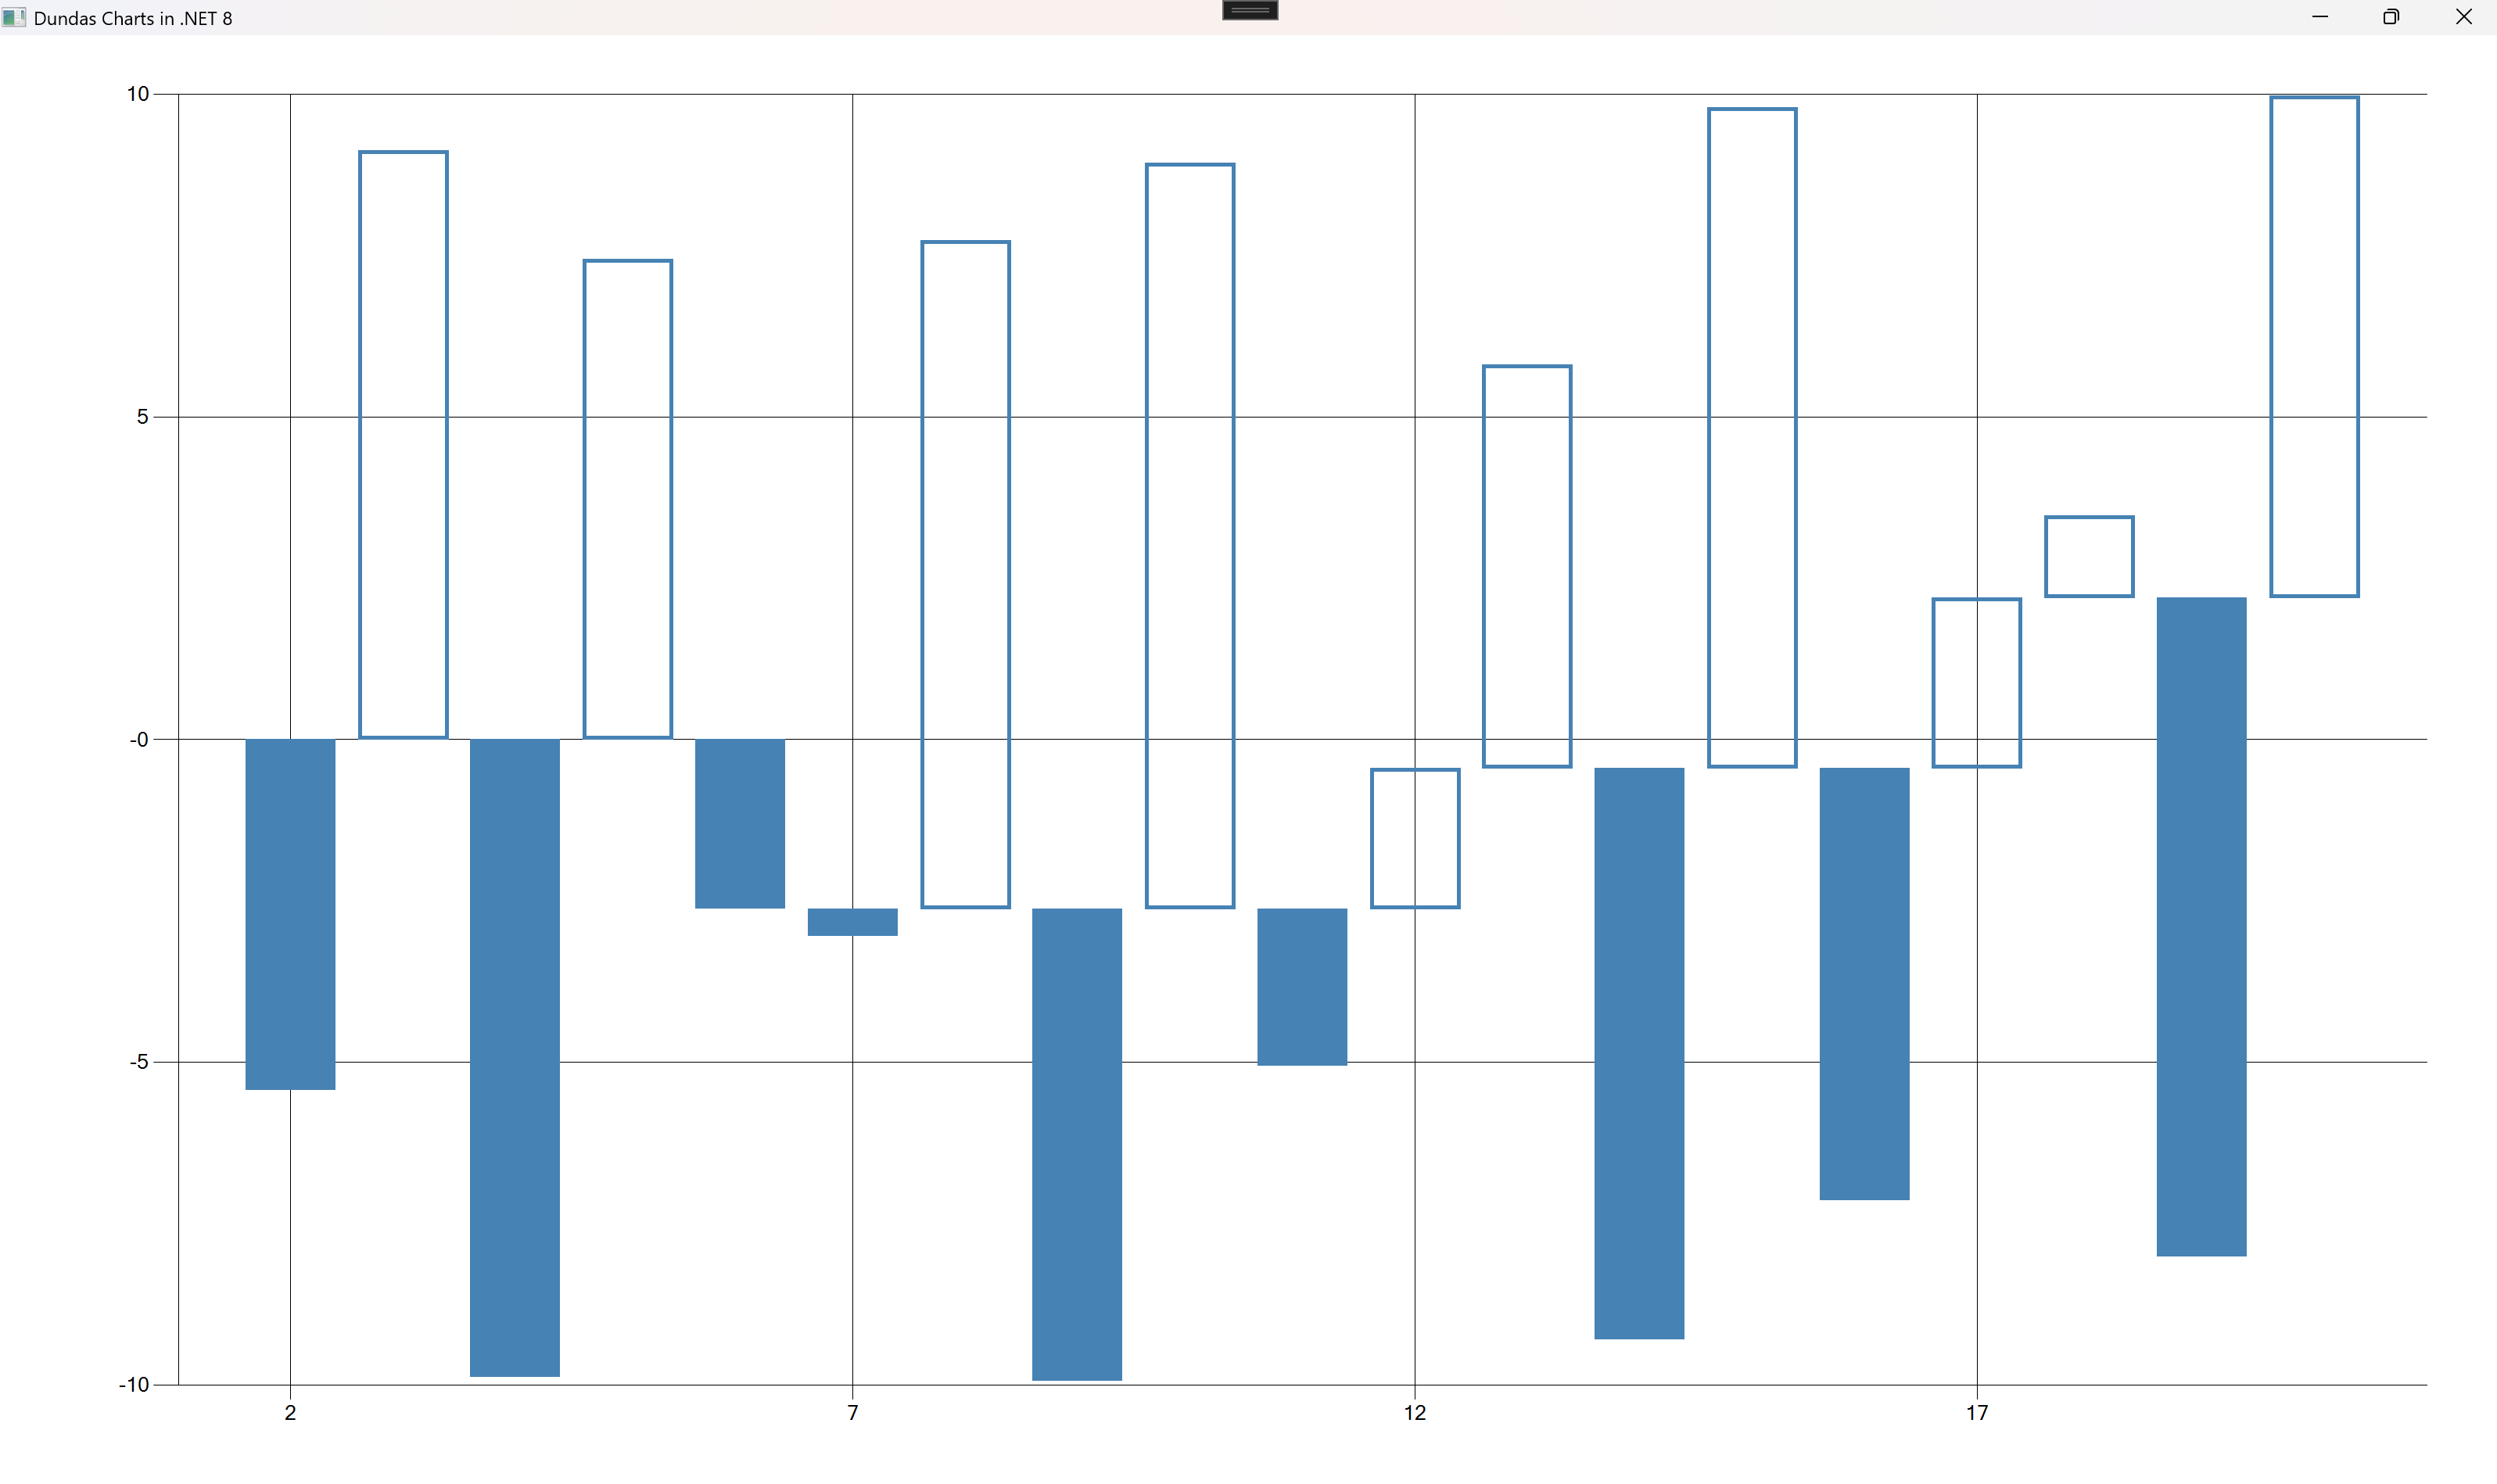
series.ChartType = SeriesChartType.ThreeLineBreak;
![]()
//xaml
<Window x:Class="WpfApp50.MainWindow"
        xmlns="http://schemas.microsoft.com/winfx/2006/xaml/presentation"
        xmlns:x="http://schemas.microsoft.com/winfx/2006/xaml"
        xmlns:d="http://schemas.microsoft.com/expression/blend/2008"
        xmlns:mc="http://schemas.openxmlformats.org/markup-compatibility/2006"
        xmlns:local="clr-namespace:WpfApp50"
        mc:Ignorable="d"
        xmlns:winforms="clr-namespace:System.Windows.Forms;assembly=System.Windows.Forms"
        xmlns:wfi="clr-namespace:System.Windows.Forms.Integration;assembly=WindowsFormsIntegration"
        xmlns:winFormChart="clr-namespace:System.Windows.Forms.DataVisualization.Charting;assembly=System.Windows.Forms.DataVisualization"
        Title="Dundas Charts in .NET 8"
        WindowState="Maximized">
    <Grid>
        <wfi:WindowsFormsHost Name="windowsFormsHost">
            <!-- Chart will be added programmatically -->
            <winFormChart:Chart x:Name="dundasChart"/>
        </wfi:WindowsFormsHost>
    </Grid>
</Window>


//cs
using System.Text;
using System.Windows;
using System.Windows.Controls;
using System.Windows.Data;
using System.Windows.Documents;
using System.Windows.Forms.DataVisualization.Charting;
using System.Windows.Forms.Integration;
using System.Windows.Input;
using System.Windows.Media;
using System.Windows.Media.Imaging;
using System.Windows.Navigation;
using System.Windows.Shapes;

namespace WpfApp50
{
    /// <summary>
    /// Interaction logic for MainWindow.xaml
    /// </summary>
    public partial class MainWindow : Window
    {
        //private Chart dundasChart2;

        public MainWindow()
        {
            InitializeComponent();
            InitializeDundasChart();
        }

        private void InitializeDundasChart()
        {
            Random rnd = new Random();
            // Create the WinForms Chart control
            dundasChart = new Chart
            {
                Dock = System.Windows.Forms.DockStyle.Fill
            };

            // Add a chart area
            var chartArea = new ChartArea();
            dundasChart.ChartAreas.Add(chartArea);

            // Create and configure series
            var series = new Series
            {
                Name = "DataSeries",
                ChartType = SeriesChartType.Column,
                Color = System.Drawing.Color.SteelBlue,
                //MarkerStyle = MarkerStyle.Circle,
                BorderWidth = 5
            };

        //    public enum SeriesChartType
        //{
        //    Point = 0,
        //    FastPoint = 1,
        //    Bubble = 2,
        //    Line = 3,
        //    Spline = 4,
        //    StepLine = 5,
        //    FastLine = 6,
        //    Bar = 7,
        //    StackedBar = 8,
        //    StackedBar100 = 9,
        //    Column = 10,
        //    StackedColumn = 11,
        //    StackedColumn100 = 12,
        //    Area = 13,
        //    SplineArea = 14,
        //    StackedArea = 15,
        //    StackedArea100 = 16,
        //    Pie = 17,
        //    Doughnut = 18,
        //    Stock = 19,
        //    Candlestick = 20,
        //    Range = 21,
        //    SplineRange = 22,
        //    RangeBar = 23,
        //    RangeColumn = 24,
        //    Radar = 25,
        //    Polar = 26,
        //    ErrorBar = 27,
        //    BoxPlot = 28,
        //    Renko = 29,
        //    ThreeLineBreak = 30,
        //    Kagi = 31,
        //    PointAndFigure = 32,
        //    Funnel = 33,
        //    Pyramid = 34
        //}
        series.ChartType = SeriesChartType.ThreeLineBreak;

            // Add sample data
            for (int i = 0; i < 20; i++)
            {
                series.Points.AddXY((i + 1).ToString(), 10 * Math.Sin(i * 10));
            }


            dundasChart.Series.Add(series);

            // Add chart to WindowsFormsHost
            windowsFormsHost.Child = dundasChart;
        }
    }
}


 浙公网安备 33010602011771号