写入图标到Excel
写入图标到Excel
#写入图标到Excel
import xlsxwriter #导入模块

#创建工作簿对象
wb = xlsxwriter.Workbook("data.xlsx")

#创建格式对象
cell_format = wb.add_format({'bold':True})  #第一种方式

cell_format1 = wb.add_format()  #第二种方式
cell_format1.set_bold()  #默认为加粗
cell_format1.set_font_color('blue')  #设置文本颜色为蓝色
cell_format1.set_font_size(14)    #设置就文本的颜色
cell_format1.set_align("center")  #设置对齐方式

cell_format2 = wb.add_format()   #设置格式
cell_format2.set_bg_color("#808080")   #设置背景颜色

# 创建工作表
sheet = wb.add_worksheet("newsheet")

#写入单个单元格数据
sheet.write(0,0,"2020工作表",cell_format)  #设置格式为方式一的

#合并单元格并写入
sheet.merge_range(1,0,2,2,"第一学期",cell_format1) #设置格式为方式二的

#数据
data = (
        ["一月份",500,450],
        ["二月份",500,450],
        ["三月份",500,450],
        ["四月份",500,450],
        ["五月份",500,450],
        ["六月份",500,450]
    )
#一行的数据写入
sheet.write_row(3,0,["月份","预期销售额","实际销售额"],cell_format2)  #设置背景颜色

#依次将数据写入
for index,item in enumerate(data):
    sheet.write_row(index+4,0,item)
#写入Excel公式
sheet.write(7,1,"=sum(B5:B7)")
sheet.write(8,2,"=sum(C5:C7)")

#写入超链接
sheet.write_url(9,0,"http://www.baidu.com",string="更多信息")
#插入图片
sheet.insert_image(10,0,"demo.jpeg")

#创建图表对象
chart = wb.add_chart({'type':'column'})   #创建图表对象,类型为柱状
chart.set_title({'name':'第一季度销售额'})  #设置图表标题
chart.set_x_axis({'name':'月份'})   #设置x轴标注
chart.set_y_axis({'name':'销售额'})   #设置y轴标注
chart.add_series({
       'name':'预销售名额', #
       'categories':'=newsheet!$A$5:$A$7',#单元格标识获取
       'values': ['newsheet',4,1,6,1]  #工作表名 起始行列 结束行列
    })
chart.add_series({
       'name':'实际销售名额', #
       'categories':'=newsheet!$A$5:$A$7',#单元格标识获取
       'values': ['newsheet',4,2,6,2], #工作表名 起始行列 结束行列
       'data_labels':{'value':True}  #数据提示值
    })

#插入到表格
sheet.insert_chart('A23',chart)    #位置 图表

wb.close()
在表格数据完成的情况下首先创建图表对象
#创建图表对象
chart = wb.add_chart({'type':'column'})   #创建图表对象,类型为柱状
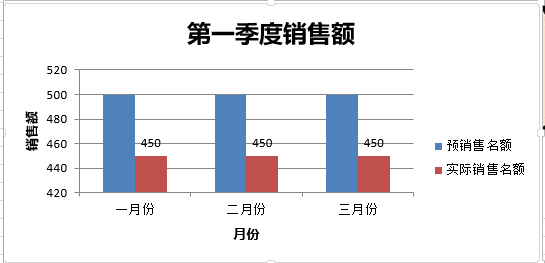
再次添加图表的标题、设置X轴和Y轴的标注分别为月份和销售额
chart.set_title({'name':'第一季度销售额'})  #设置图表标题
chart.set_x_axis({'name':'月份'})   #设置x轴标注
chart.set_y_axis({'name':'销售额'})   #设置y轴标注
然后添加数据使用图表的add_series添加参数
chart.add_series({
       'name':'预销售名额', #
       'categories':'=newsheet!$A$5:$A$7',#=工作表名!单元格标识获取
       'values': ['newsheet',4,1,6,1]  #工作表名 起始行列 结束行列
    })
最后将图表添加到工作表中
#插入到表格
sheet.insert_chart('A23',chart)    #位置 图表
M54


 浙公网安备 33010602011771号