网络爬虫——IMDb-Most Popular Tv Shows
一、选题的背景
1.选择IMDb流行电视剧的网络爬虫作为选题,是因为电视剧在当今社会中扮演着重要角色,它们不仅是娱乐消遣的方式,还反映了社会文化、价值观和审美趋势。通过对IMDb流行电视剧的数据分析,可以了解观众的喜好和市场需求,为制作公司、投资者、广告商等提供有价值的参考信息。
2.预期目标是获取IMDb网站上热门电视剧的关键信息,如中英文名称、导演、年份、评分以及排名变化等,从而进行深入分析。例如,可以挖掘出哪些类型的电视剧更受欢迎、哪些导演的作品更具吸引力、不同年份的热门电视剧在主题和风格上的变化等。
3.从社会角度来看,热门电视剧往往反映了社会大众的价值观、心理需求和审美趋势。从经济角度来看,了解热门电视剧的特点有助于投资者、制作公司和广告商制定更明智的决策。从技术角度来看,网络爬虫技术可以高效地收集和整理数据,为后续的数据分析和挖掘奠定基础。从数据来源来看,IMDb是全球最大的电影和电视剧数据库,其数据具有较高的权威性和可靠性。
二、主题式网络爬虫设计方案
1.主题式网络爬虫名称
IMDb-Most Popular Tv Shows
2.网络爬虫爬取IMDb流行电视剧的内容时,通常关注以下数据特征进行分析:
-
电视剧名称(Title):电视剧的名称是关键信息,便于识别和检索。
-
评分(Rating):用户对电视剧的评价,通常以0-10的分数表示,可用于评估电视剧的受欢迎程度。
-
首播年份(Premiere Date):电视剧首次播出的年份,可以用来分析电视剧的新旧程度。
-
排名(Ranking):根据评分数等因素综合排序得出的电视剧排名,可以反映出电视剧在众多作品中的地位。
通过分析这些数据特征,我们可以了解到电视剧的受欢迎程度、观众喜好、新旧程度等信息。这些信息对于制作公司、广告商、观众等多方具有重要参考价值
3.网络爬虫设计方案概述:
一、实现思路:
-
目标网站分析:分析IMDb和豆瓣网站的结构、数据分布和页面编码等信息,以便更好地设计爬虫程序。
-
请求与响应处理:使用Python的requests库向目标网站发送请求,并处理响应数据,包括处理异常情况、编码问题等。同时,使用代理IP和随机User-Agent进行反爬策略应对。
-
数据解析:使用正则表达式对响应数据进行解析,提取所需信息,包括中文名、英文名、导演、年份、评分和排名变化等。
-
数据存储:将提取到的信息存储到Excel文件中,以便后续分析和使用。
-
爬虫调度:使用time库的sleep函数实现延时爬取,降低爬取频率,避免触发反爬策略。
二、技术难点:
-
反爬策略应对:目标网站可能会采取一定的反爬策略,如User-Agent限制、IP限制等。需要设计相应的策略应对,如使用代理IP、随机User-Agent等。
-
数据解析准确性:由于网站结构可能会发生变化,需要时刻关注数据解析的准确性,并及时调整解析规则。同时,正则表达式的编写需要一定的技巧,以确保正确提取所需信息。
-
爬虫监控与维护:设计爬虫监控机制,定期检查爬虫运行状态,确保爬虫正常运行,并及时处理异常情况。
-
跨站数据整合:本爬虫需要从IMDb和豆瓣两个网站获取数据,并进行整合。需要确保两个网站数据的一致性和准确性。
-
数据存储与处理:将爬取到的数据存储到Excel文件中,需要使用openpyxl库进行操作。同时,需要确保数据格式的正确性和可读性。
三、主题页面的结构特征分析
数据源说明
数据源是来自IMDb网站上的电视节目排名,包含了当前最流行的100部电视剧。IMDb是一个在线的电影和电视节目数据库,包含了大量的电影、电视节目、演员、导演、制片人等相关信息。这些信息是由IMDb网站的用户提交和编辑的,因此具有一定的权威性和参考价值。
https://www.imdb.com/chart/tvmeter/?ref_=nv_tvv_mptv
数据类型为电视节目排名,包含了电视节目的名称、评分、播出年份、排名、导演等信息。数据格式为HTML,需要通过爬虫程序进行解析和提取。
数据格式是一个列表,每个列表元素包含以下信息:
- 排名
- 中文名
- 英文名
- 导演
- 年份
- 评分
- 排名变化
1.主题页面的结构与特征分析
-
IMDb主题页面:
IMDb主题页面的结构主要由以下几个部分组成:
- 导航栏:包含网站的主要分类,如电影、电视剧、名人等。
- 搜索框:提供关键词搜索功能。
- 内容区:包含排行榜、电影、电视剧等信息,以表格或列表形式展示。
- 侧边栏:包含一些热门电影、电视剧、名人等推荐信息。
![]()
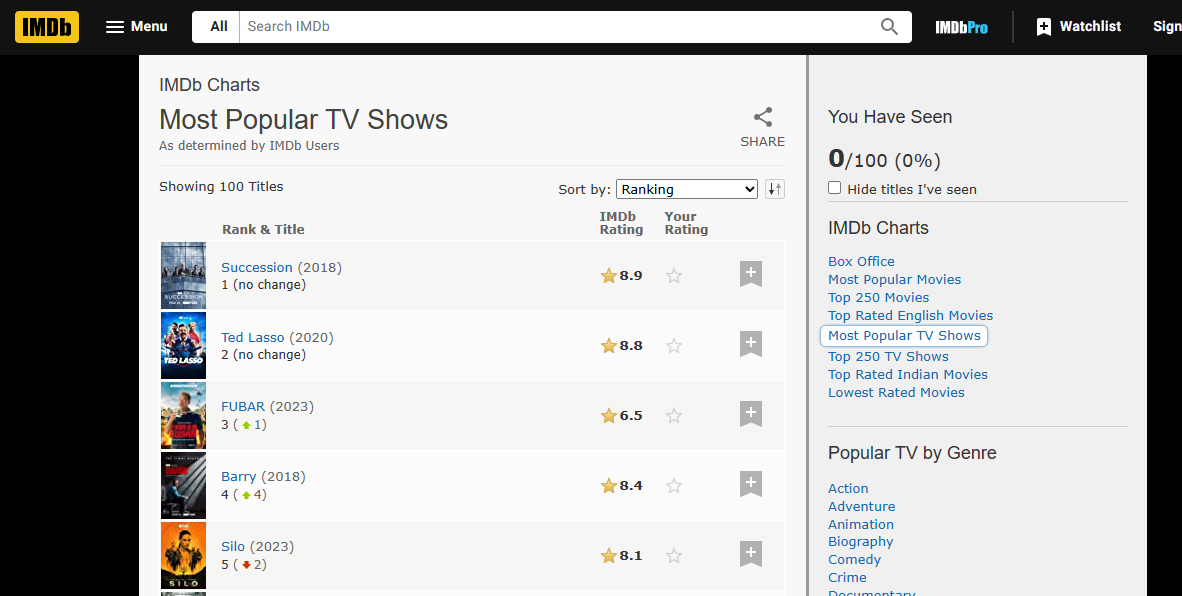
IMDb主题页面的特征主要表现在:
- 数据分布:数据主要分布在表格或列表中,每个表格行或列表项包含了排名、名称、评分、导演、年份等信息。
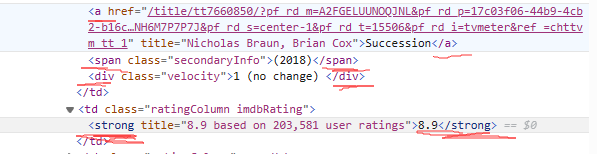
- 标签属性:通过分析页面源代码,可以发现各类信息对应的HTML标签和属性,如电影名称对应的是
<a>标签,评分对应的是<strong>标签等。![]()
-
豆瓣主题页面:
豆瓣主题页面的结构主要由以下几个部分组成:
- 导航栏:包含网站的主要分类,如电影、读书、音乐等。
- 搜索框:提供关键词搜索功能。
- 内容区:包含排行榜、电影、书籍等信息,以卡片或列表形式展示。
- 侧边栏:包含一些热门电影、书籍、音乐等推荐信息。
![]()
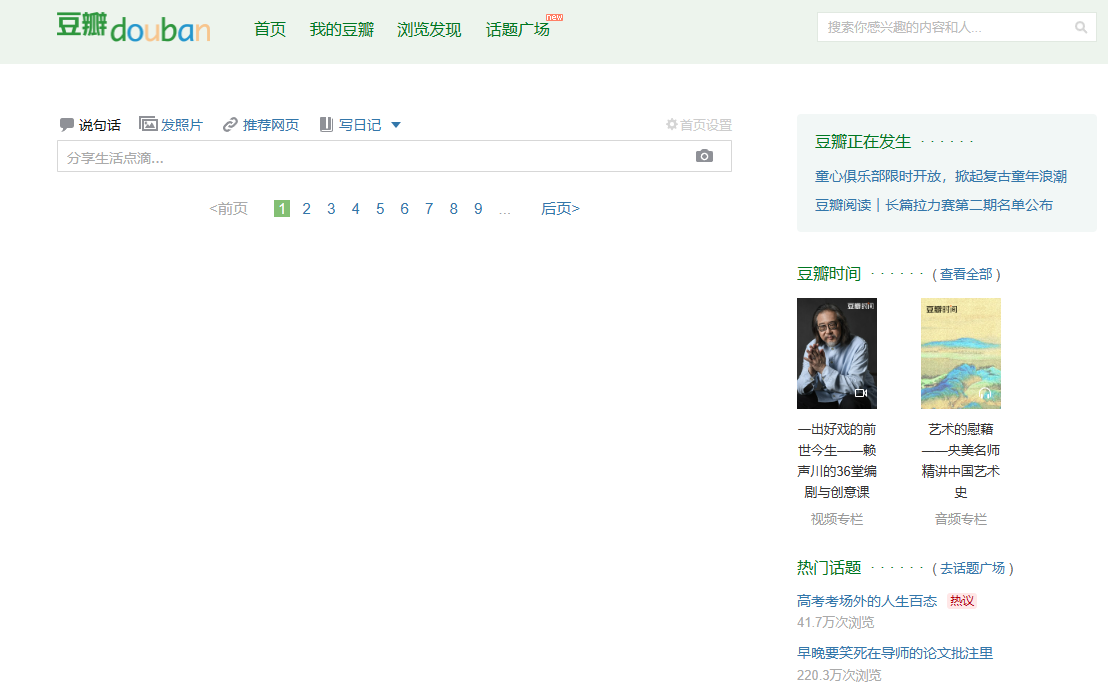
豆瓣主题页面的特征主要表现在:
- 数据分布:数据主要分布在卡片或列表中,每个卡片或列表项包含了名称、评分、导演、演员等信息。
- 标签属性:通过分析页面源代码,可以发现各类信息对应的HTML标签和属性,如电影名称对应的是
<a>标签,导演对应的是<span>标签等。![]()

2.Htmls 页面解析

代码操作:
-
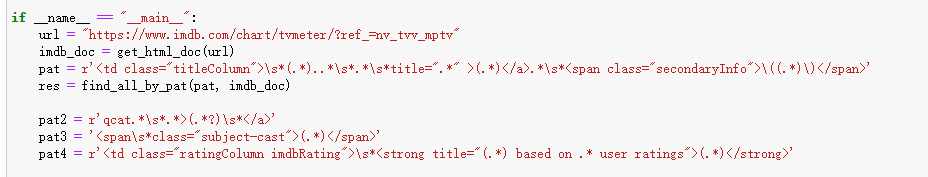
pat: 用于匹配<td class="titleColumn">标签内的内容,提取排名、英文名和年份。正则表达式分为3个捕获组:(.*)..*: 匹配排名(.*): 匹配英文名(.*): 匹配年份
-
pat2: 用于匹配<a>标签内的内容,提取中文名。正则表达式有1个捕获组:(.*?): 匹配中文名
-
pat3: 用于匹配<span class="subject-cast">标签内的内容,提取导演名。正则表达式有1个捕获组:(.*): 匹配导演名
-
pat4: 用于匹配<td class="ratingColumn imdbRating">标签内的内容,提取评分。正则表达式有2个捕获组:(.*): 匹配评分标题,包含评分和基于的用户数量(.*): 匹配评分
其中对于排名变化的爬取:
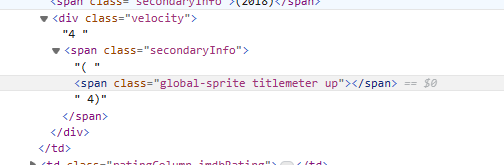 (排名上升4)
 (排名不变)
 (排名下降2)
在下面是用来正则表达式匹配排名的变化,
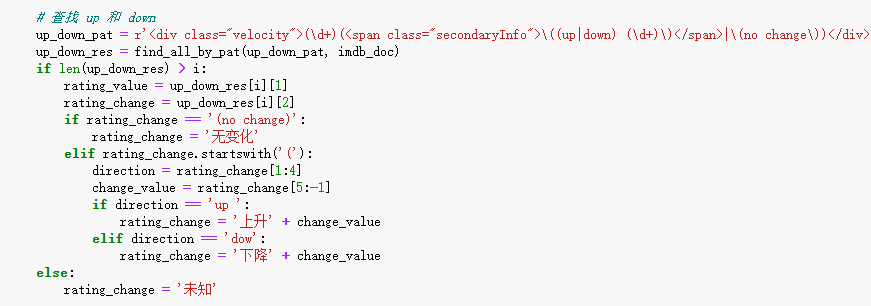 (正则表达式)
-
up_down_res: 使用find_all_by_pat函数从HTML文档中查找所有匹配up_down_pat正则表达式的结果。 -
if len(up_down_res) > i: 检查是否有足够的匹配结果来提取第i个电影或电视节目的评分变化信息。 -
rating_value = up_down_res[i][1]: 从匹配结果中提取评分。 -
rating_change = up_down_res[i][2]: 从匹配结果中提取评分变化信息。 -
if rating_change == '(no change)': rating_change = '无变化': 如果评分没有变化,则将评分变化信息设置为“无变化”。 -
elif rating_change.startswith('('): 如果评分有变化,则检查评分变化信息是否以括号开头。 -
direction = rating_change[1:4]: 如果评分变化信息以(up或(down开头,则提取方向(up或down)。 -
change_value = rating_change[5:-1]: 如果评分变化信息以(up或(down开头,则提取变化数量。 -
if direction == 'up ': rating_change = '上升' + change_value: 如果评分上升,则将评分变化信息设置为“上升”+变化数量。 -
elif direction == 'dow': rating_change = '下降' + change_value: 如果评分下降,则将评分变化信息设置为“下降”+变化数量。 -
else: rating_change = '未知': 如果无法确定评分变化信息,则将其设置为“未知”。
 (BeautifulSoup库)
-
rankings_table = soup.find('tbody', class_='lister-list'): 使用find函数从HTML文档中查找包含电影或电视节目排名信息的表格,该表格具有tbody标签和lister-list类。 -
rows = rankings_table.find_all('tr'): 使用find_all函数从表格中查找所有行。 -
for row in rows:: 遍历每一行。 -
rank_column = row.find('td', class_='titleColumn'): 使用find函数从当前行中查找包含电影或电视节目名称和排名信息的单元格,该单元格具有td标签和titleColumn类。 -
rank_text = row.find('div', class_='velocity').text.strip() if row.find('div', class_='velocity') else 'N/A': 使用find函数从当前行中查找包含排名上升和排名下降信息的div标签,该标签具有velocity类。如果找到了这个标签,则提取文本内容并去除前后空格;否则将rank_text设置为“N/A”。 -
rank = rank_text.split('\n')[0] if rank_text else 'N/A': 将rank_text按照换行符\n分割成多个字符串,提取第一个字符串作为排名信息,并将其赋值给rank。如果rank_text为空,则将rank设置为“N/A”。
3.节点(标签)查找方法与遍历方法 (必要时画出节点树结构)
节点(标签)查找方法:
- find_all():查找符合条件的所有节点
- select():使用CSS选择器查找节点
遍历方法:
- 需要注意的是,虽然代码中没有使用遍历方法,但是在获取电影信息时,使用了正则表达式对HTML文本进行匹配,也可以视为一种遍历方法。
四、网络爬虫程序设计
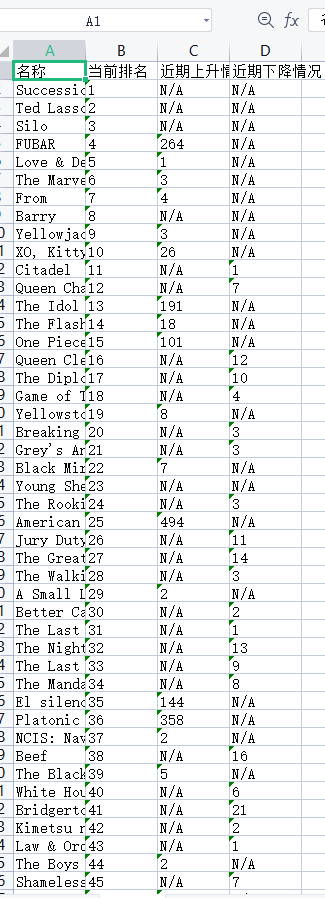
1.数据爬取与采集
采集电视剧排名和排名变化
 1 import requests
 2 from bs4 import BeautifulSoup
 3 import openpyxl
 4
 5 # 发送HTTP请求获取网页内容
 6 url = 'https://www.imdb.com/chart/tvmeter/?ref_=nv_tvv_mptv'
 7 response = requests.get(url)
 8 html_content = response.content
 9
10 # 使用BeautifulSoup解析网页内容
11 soup = BeautifulSoup(html_content, 'html.parser')
12
13 # 创建一个Excel工作簿和工作表
14 workbook = openpyxl.Workbook()
15 sheet = workbook.active
16
17 # 添加列标题
18 sheet.append(['名称', '当前排名', '近期上升情况', '近期下降情况'])
19
20 # 找到排名和排名变化所在的HTML元素
21 rankings_table = soup.find('tbody', class_='lister-list')
22 rows = rankings_table.find_all('tr')
23
24 # 提取排名、电影名、排名上升和排名下降数据,并写入Excel工作表
25 for row in rows:
26     rank_column = row.find('td', class_='titleColumn')
27     rank_text = row.find('div', class_='velocity').text.strip() if row.find('div', class_='velocity') else 'N/A'
28     rank = rank_text.split('\n')[0] if rank_text else 'N/A'
29
30     # 获取电影名信息
31     title_column = rank_column.find('a')
32     title = title_column.text.strip() if title_column else 'N/A'
33
34     change_column = row.find('div', class_='velocity')
35
36     up_icon = change_column.find('span', class_='global-sprite titlemeter up')
37     down_icon = change_column.find('span', class_='global-sprite titlemeter down')
38
39     if up_icon:
40         change = change_column.text.strip().split('\n')[-1].strip('()')
41         decrease = 'N/A'
42     elif down_icon:
43         change = 'N/A'
44         decrease = change_column.text.strip().split('\n')[-1].strip('()')
45     else:
46         change = 'N/A'
47         decrease = 'N/A'
48
49     sheet.append([title, rank, change, decrease])
50
51 # 保存Excel文件
52 file_path = 'C:\\Users\\David\\Desktop\\imdb_rankings.xlsx'
53 workbook.save(file_path)
54 print(f"文件已保存至:{file_path}")
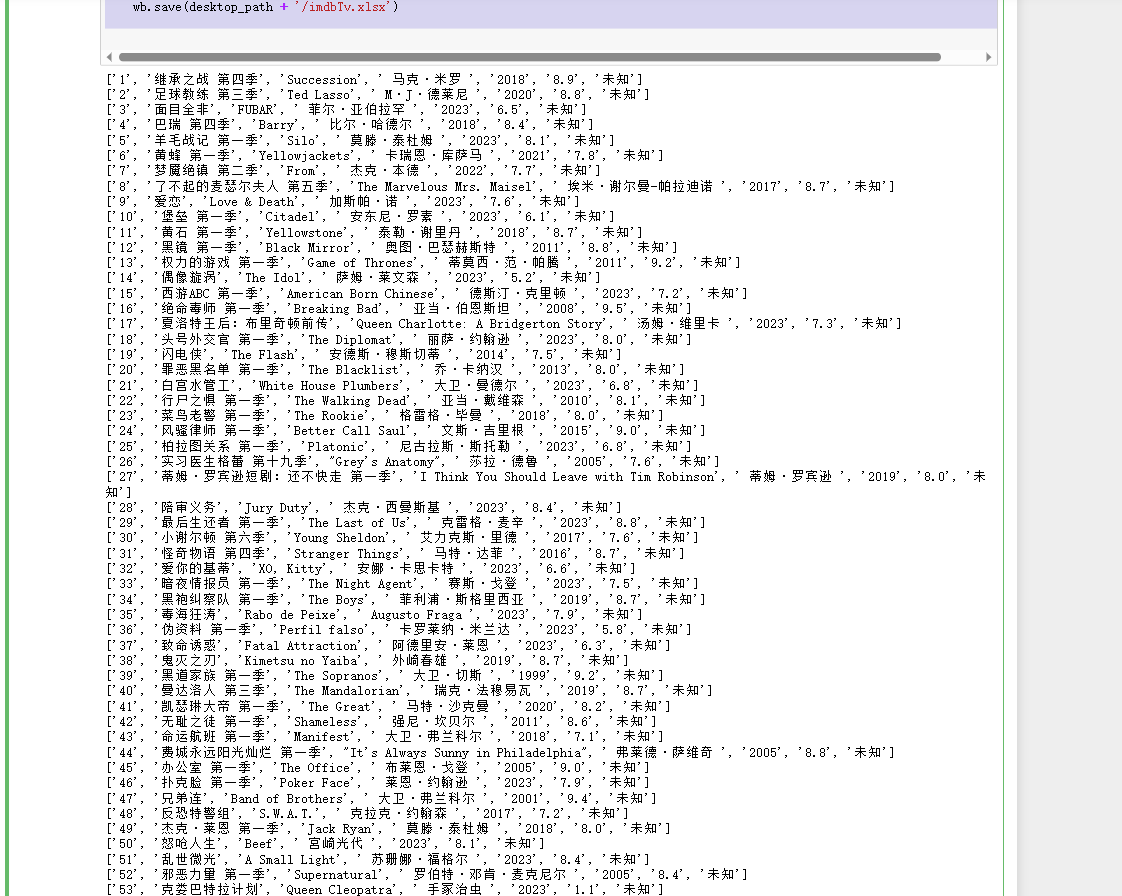
采集电视剧名、排名、中文名、导演名、评分
  1 import random
  2 import re
  3 import requests
  4 from openpyxl import Workbook
  5 from time import sleep
  6 import os
  7
  8
  9 def find_all_by_pat(pat, string):
 10     res = re.findall(pat, string)
 11     return res
 12
 13
 14 def get_html_doc(url):
 15     pro = ['122.152.196.126', '114.215.174.227', '119.185.30.75']
 16     head = {
 17         'user-Agent': 'Mozilla/5.0(Windows NT 10.0;Win64 x64)AppleWebkit/537.36(KHTML,like Gecko) chrome/58.0.3029.110 Safari/537.36'
 18     }
 19     resopnse = requests.get(url, proxies={'http': random.choice(pro)}, headers=head)
 20     resopnse.encoding = 'utf-8'
 21     html_doc = resopnse.text
 22     return html_doc
 23
 24
 25 def get_douban_html(query_name):
 26     url = 'https://www.douban.com/search?cat=1002&q=%s' % query_name
 27     douban_search_res = get_html_doc(url)
 28     return douban_search_res
 29
 30
 31 def get_chinese_name(pat, doc):
 32     res_list = find_all_by_pat(pat, doc)
 33     try:
 34         return res_list[1]
 35     except:
 36         return ' '
 37
 38
 39 def get_director_name(pat, doc):
 40     res = find_all_by_pat(pat, doc)
 41     try:
 42         return res[0].split('/')[1]
 43     except:
 44         return ' '
 45
 46
 47 if __name__ == "__main__":
 48     url = "https://www.imdb.com/chart/tvmeter/?ref_=nv_tvv_mptv"
 49     imdb_doc = get_html_doc(url)
 50     pat = r'<td class="titleColumn">\s*(.*)..*\s*.*\s*title=".*" >(.*)</a>.*\s*<span class="secondaryInfo">\((.*)\)</span>'
 51     res = find_all_by_pat(pat, imdb_doc)
 52
 53     pat2 = r'qcat.*\s*.*>(.*?)\s*</a>'
 54     pat3 = '<span\s*class="subject-cast">(.*)</span>'
 55     pat4 = r'<td class="ratingColumn imdbRating">\s*<strong title="(.*) based on .* user ratings">(.*)</strong>'
 56
 57     # 创建一个空列表用于存储结果
 58     result = []
 59
 60     for i in range(len(res)):
 61         doc = get_douban_html(res[i][1])
 62         chinise_name = get_chinese_name(pat2, doc)
 63
 64         director_name = get_director_name(pat3, doc)
 65
 66         rating_info = find_all_by_pat(pat4, imdb_doc)[i]
 67         rating = rating_info[1]
 68
 69         # 查找 up 和 down
 70         up_down_pat = r'<div class="velocity">(\d+)(<span class="secondaryInfo">\((up|down) (\d+)\)</span>|\(no change\))</div>'
 71         up_down_res = find_all_by_pat(up_down_pat, imdb_doc)
 72         if len(up_down_res) > i:
 73             rating_value = up_down_res[i][1]
 74             rating_change = up_down_res[i][2]
 75             if rating_change == '(no change)':
 76                 rating_change = '无变化'
 77             elif rating_change.startswith('('):
 78                 direction = rating_change[1:4]
 79                 change_value = rating_change[5:-1]
 80                 if direction == 'up ':
 81                     rating_change = '上升' + change_value
 82                 elif direction == 'dow':
 83                     rating_change = '下降' + change_value
 84         else:
 85             rating_change = '未知'
 86
 87
 88         # 将结果添加到列表中
 89         result.append([str(i + 1), chinise_name, res[i][1], director_name, res[i][2], rating, rating_change])
 90
 91         # 打印结果
 92         print(result[-1])
 93
 94         sleep(random.random() * 1.2)
 95
 96     # 将结果写入 Excel 文件
 97     wb = Workbook()
 98     sheet = wb.active
 99     sheet['A1'] = '排名'
100     sheet['B1'] = '中文名'
101     sheet['C1'] = '英文名'
102     sheet['D1'] = '导演'
103     sheet['E1'] = '年份'
104     sheet['F1'] = '评分'
105     sheet['G1'] = '排名变化'
106     for i in range(len(result)):
107         for j in range(len(result[i])):
108             sheet.cell(row=i + 2, column=j + 1).value = result[i][j]
109     desktop_path = os.path.join(os.path.expanduser("~"), 'Desktop')
110     wb.save(desktop_path + '/imdbTv.xlsx')
2.对数据进行清洗和处理
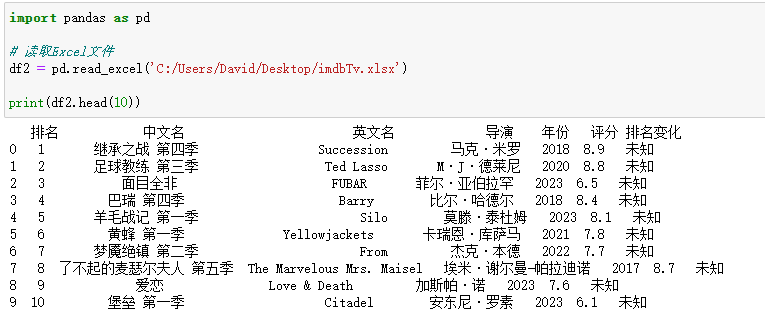
读取采集的电视剧信息
import pandas as pd

# 读取Excel文件
df2 = pd.read_excel('C:/Users/David/Desktop/imdbTv.xlsx')

print(df2.head(10))
删除无效列排名变化
1 #删除无效列‘排名变化’
2 df2.drop('排名变化', axis=1, inplace=True)
3 df2.to_excel('C:/Users/David/Desktop/imdbTv.xlsx', index=False)
4 print(df2.head(10))

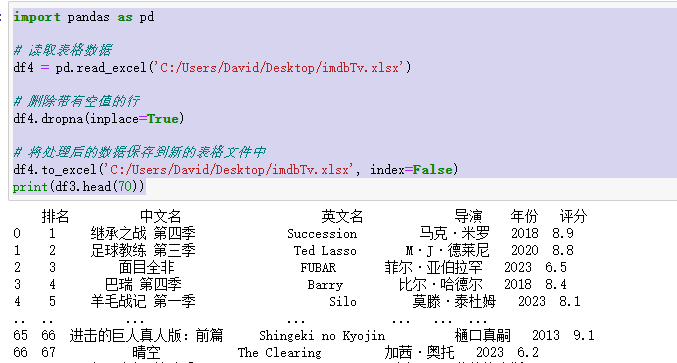
删除带有空值的行
import pandas as pd

# 读取表格数据
df4 = pd.read_excel('C:/Users/David/Desktop/imdbTv.xlsx')

# 删除带有空值的行
df4.dropna(inplace=True)

# 将处理后的数据保存到新的表格文件中
df4.to_excel('C:/Users/David/Desktop/imdbTv.xlsx', index=False)
print(df3.head(70))
统计每列中缺失值的数量
import pandas as pd

df = pd.read_excel('C:/Users/David/Desktop/imdbTv.xlsx')
# 统计每列中缺失值的数量
missing_values_count = df.isnull().sum()

# 打印每列中缺失值的数量
print(missing_values_count)

import pandas as pd

df = pd.read_excel('C:/Users/David/Desktop/imdbTv.xlsx')
# 统计每列中空值的数量
empty_values_count = df.isna().sum()

# 打印每列中空值的数量
print(empty_values_count)

3.文本分析(可选):jieba 分词、wordcloud 的分词可视化
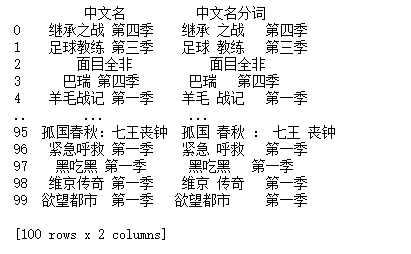
jieba分词“中文名”
import pandas as pd
import jieba

# 读取表格数据
df = pd.read_excel('C:/Users/David/Desktop/imdbTv.xlsx')

# 对中文名进行分词
df['中文名分词'] = df['中文名'].apply(lambda x: ' '.join(jieba.cut(x)))


# 输出分词结果
print(df[['中文名', '中文名分词']])
4.数据分析与可视化(例如:数据柱形图、直方图、散点图、盒图、分布图)
import pandas as pd
import matplotlib.pyplot as plt

# 读取Excel文件
df = pd.read_excel('C:/Users/David/Desktop/imdbTv.xlsx')

# 绘制评分直方图
plt.hist(df['评分'], bins=10)
plt.xlabel('评分')
plt.ylabel('频数')
plt.title('电视剧评分直方图')
plt.show()

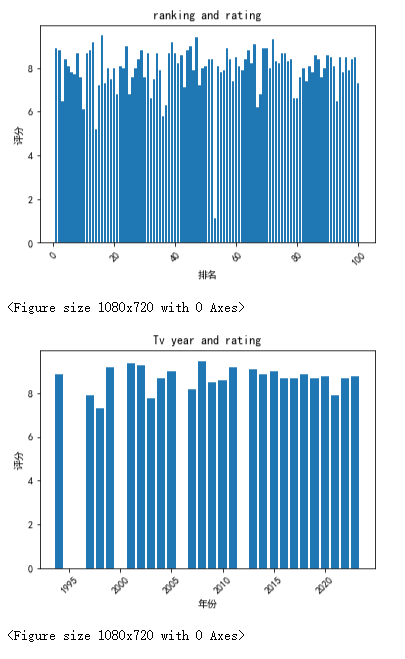
import pandas as pd
import matplotlib.pyplot as plt

# 读取Excel文件
df = pd.read_excel('C:/Users/David/Desktop/imdbTv.xlsx')

# 绘制排名柱形图
plt.bar(df['排名'], df['评分'])
plt.xlabel('排名')
plt.ylabel('评分')
plt.title('ranking and rating')

# 旋转横坐标标签
plt.xticks(rotation=45)

# 调整图像大小
plt.figure(figsize=(15, 10))

plt.show()

# 绘制年份柱形图
plt.bar(df['年份'], df['评分'])
plt.xlabel('年份')
plt.ylabel('评分')
plt.title('Tv year and rating')

# 旋转横坐标标签
plt.xticks(rotation=45)

# 调整图像大小
plt.figure(figsize=(15, 10))

plt.show()
import pandas as pd
import matplotlib.pyplot as plt

# 读取Excel文件
df = pd.read_excel('C:/Users/David/Desktop/imdbTv.xlsx')

# 绘制排名和评分的散点图
plt.scatter(df['排名'], df['评分'])
plt.xlabel('排名')
plt.ylabel('评分')
plt.title('电视剧排名和评分散点图')
plt.show()

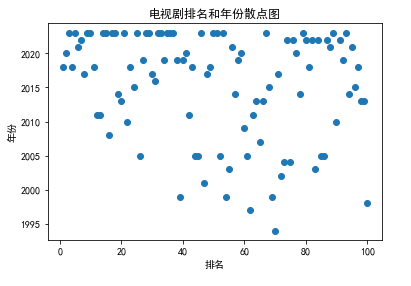
电视剧排名和年份散点图
import pandas as pd
import matplotlib.pyplot as plt

# 读取Excel文件
df = pd.read_excel('C:/Users/David/Desktop/imdbTv.xlsx')

# 绘制排名和年份的散点图
plt.scatter(df['排名'], df['年份'])
plt.xlabel('排名')
plt.ylabel('年份')
plt.title('电视剧排名和年份散点图')
plt.show()
电视剧评分盒图
import pandas as pd
import matplotlib.pyplot as plt

# 读取Excel文件
df = pd.read_excel('C:/Users/David/Desktop/imdbTv.xlsx')

# 绘制评分的盒图
plt.boxplot(df['评分'])
plt.ylabel('评分')
plt.title('电视剧评分盒图')
plt.show()

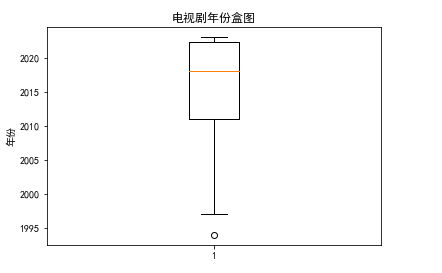
电视剧年份盒图
import pandas as pd
import matplotlib.pyplot as plt

# 读取Excel文件
df = pd.read_excel('C:/Users/David/Desktop/imdbTv.xlsx')

# 绘制年份的盒图
plt.boxplot(df['年份'])
plt.ylabel('年份')
plt.title('电视剧年份盒图')
plt.show()
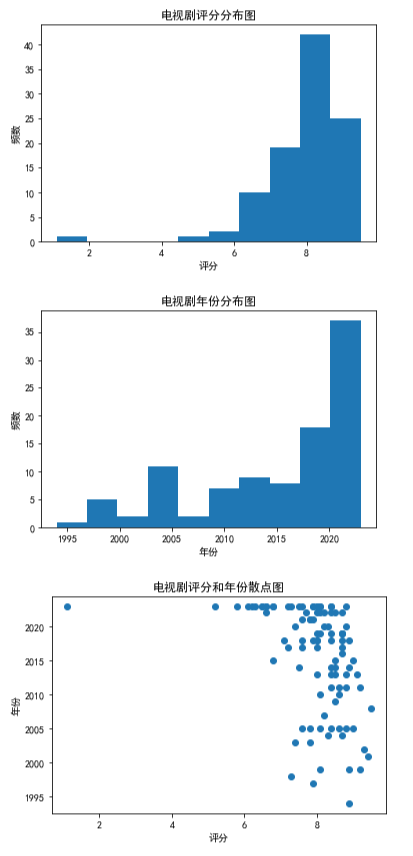
import pandas as pd
import matplotlib.pyplot as plt

# 读取Excel文件
df = pd.read_excel('C:/Users/David/Desktop/imdbTv.xlsx')

# 绘制评分的直方图
plt.hist(df['评分'], bins=10)
plt.xlabel('评分')
plt.ylabel('频数')
plt.title('电视剧评分分布图')
plt.show()

# 绘制年份的直方图
plt.hist(df['年份'], bins=10)
plt.xlabel('年份')
plt.ylabel('频数')
plt.title('电视剧年份分布图')
plt.show()

# 绘制评分和年份的散点图
plt.scatter(df['评分'], df['年份'])
plt.xlabel('评分')
plt.ylabel('年份')
plt.title('电视剧评分和年份散点图')
plt.show()
电视剧排名最近情况散点图
import matplotlib.pyplot as plt
import pandas as pd

# 读取数据
df = pd.read_excel('C:/Users/David/Desktop/imdb_rankings.xlsx')

# 绘制散点图
fig, ax = plt.subplots()
ax.scatter(df['当前排名'], df['近期上升情况'], color='g', label='Up')
ax.scatter(df['当前排名'], df['近期下降情况'], color='r', label='Down')
ax.set_xlabel('Ranking')
ax.set_ylabel('Change')
ax.legend()
plt.show()

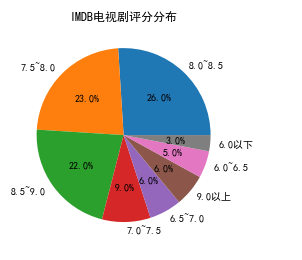
电视剧评分饼状图
#IMDB电视剧评分分布
import pandas as pd
import matplotlib.pyplot as plt

# 读取Excel文件
df = pd.read_excel('C:/Users/David/Desktop/imdbTv.xlsx')

# 选择评分列数据
ratings = df['评分']

# 将评分数据分为8个区间
bins = [0, 6, 6.5, 7, 7.5, 8, 8.5, 9, 10]
labels = ['6.0以下', '6.0~6.5', '6.5~7.0', '7.0~7.5', '7.5~8.0', '8.0~8.5', '8.5~9.0', '9.0以上']
rating_bins = pd.cut(ratings, bins=bins, labels=labels)

# 统计各个区间的评分数量
rating_counts = rating_bins.value_counts()

# 绘制饼状图
plt.pie(rating_counts.values, labels=rating_counts.index, autopct='%1.1f%%')
plt.title('IMDB电视剧评分分布')
plt.show()
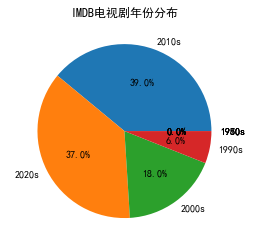
IMDB电视剧年份饼状图
#IMDB电视剧年份分布
import pandas as pd
import matplotlib.pyplot as plt

# 读取Excel文件
df = pd.read_excel('C:/Users/David/Desktop/imdbTv.xlsx')

# 选择年份列数据
years = df['年份']

# 将年份数据分为8个区间
bins = [1950, 1960, 1970, 1980, 1990, 2000, 2010, 2020, 2030]
labels = ['1950s', '1960s', '1970s', '1980s', '1990s', '2000s', '2010s', '2020s']
year_bins = pd.cut(years, bins=bins, labels=labels)

# 统计各个区间的年份数量
year_counts = year_bins.value_counts()

# 绘制饼状图
plt.pie(year_counts.values, labels=year_counts.index, autopct='%1.1f%%')
plt.title('IMDB电视剧年份分布')
plt.show()
5.根据数据之间的关系,分析两个变量之间的相关系数,画出散点图,并建立变 量之间的回归方程(一元或多元)。
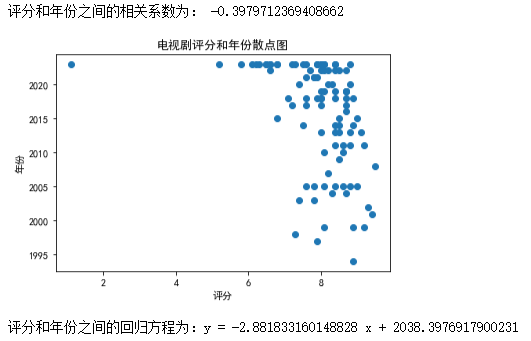
评分和年份之间关系
import pandas as pd
import matplotlib.pyplot as plt
from scipy import stats

# 读取Excel文件
df = pd.read_excel('C:/Users/David/Desktop/imdbTv.xlsx')

# 计算评分和年份之间的相关系数
r, p = stats.pearsonr(df['评分'], df['年份'])
print('评分和年份之间的相关系数为:', r)

# 绘制评分和年份的散点图
plt.scatter(df['评分'], df['年份'])
plt.xlabel('评分')
plt.ylabel('年份')
plt.title('电视剧评分和年份散点图')
plt.show()

# 建立评分和年份之间的线性回归方程
slope, intercept, r_value, p_value, std_err = stats.linregress(df['评分'], df['年份'])
print('评分和年份之间的回归方程为:y =', slope, 'x +', intercept)
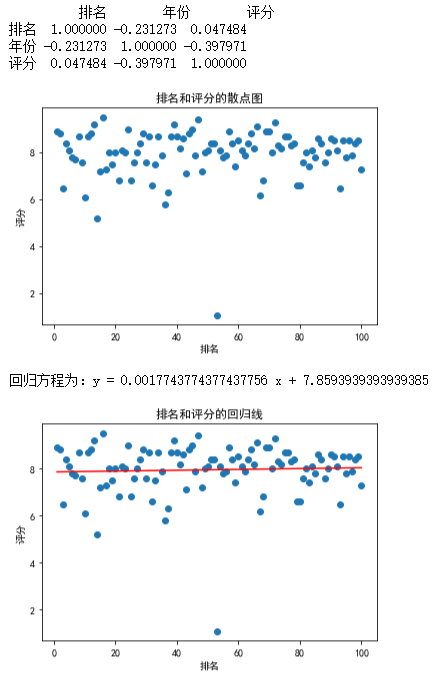
排名和评分的关系
import pandas as pd
import numpy as np
import matplotlib.pyplot as plt
from scipy import stats

# 读取Excel文件
df = pd.read_excel('C:/Users/David/Desktop/imdbTv.xlsx')

# 计算相关系数
corr_matrix = df.corr()
print(corr_matrix)

# 绘制散点图
plt.scatter(df['排名'], df['评分'])
plt.xlabel('排名')
plt.ylabel('评分')
plt.title('排名和评分的散点图')
plt.show()

# 建立回归方程
x = df['排名']
y = df['评分']
slope, intercept, r_value, p_value, std_err = stats.linregress(x, y)
print('回归方程为:y =', slope, 'x +', intercept)

# 绘制回归线
plt.scatter(x, y)
plt.plot(x, slope * x + intercept, color='red')
plt.xlabel('排名')
plt.ylabel('评分')
plt.title('排名和评分的回归线')
plt.show()
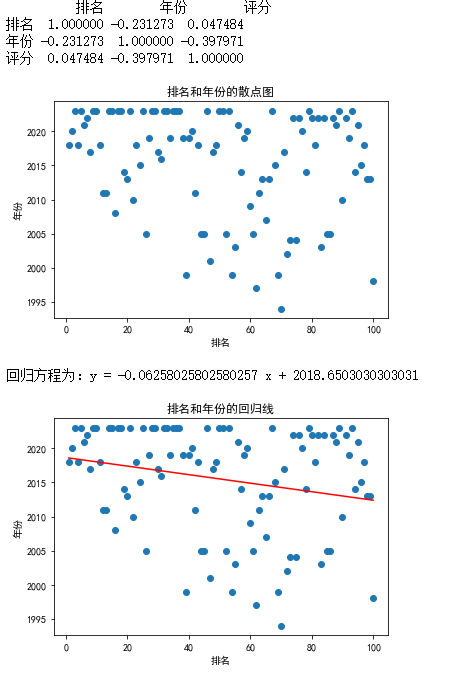
排名和年份的关系
import pandas as pd
import numpy as np
import matplotlib.pyplot as plt
from scipy import stats

# 读取Excel文件
df = pd.read_excel('C:/Users/David/Desktop/imdbTv.xlsx')

# 计算相关系数
corr_matrix = df.corr()
print(corr_matrix)

# 绘制散点图
plt.scatter(df['排名'], df['年份'])
plt.xlabel('排名')
plt.ylabel('年份')
plt.title('排名和年份的散点图')
plt.show()

# 建立回归方程
x = df['排名']
y = df['年份']
slope, intercept, r_value, p_value, std_err = stats.linregress(x, y)
print('回归方程为:y =', slope, 'x +', intercept)

# 绘制回归线
plt.scatter(x, y)
plt.plot(x, slope * x + intercept, color='red')
plt.xlabel('排名')
plt.ylabel('年份')
plt.title('排名和年份的回归线')
plt.show()
6.数据持久化
数据持久化分为以下:
-
数据库:将数据存储在关系型数据库(如MySQL、PostgreSQL)或非关系型数据库(如MongoDB、Redis)中,可以使用Python中的ORM(如SQLAlchemy)或直接使用数据库API进行操作。
-
文件:将数据存储在本地文件系统中,可以使用Python内置的文件读写操作或第三方库(如Pandas)进行操作。常见的文件格式包括CSV、JSON、XML、Excel等。
-
缓存:将数据存储在缓存中,可以使用第三方缓存库(如Redis、Memcached)进行操作,可以提高数据读取速度和性能。
我是将采集的数据保存到Excel中。
7.将以上各部分的代码汇总,附上完整程序代码
  1 import random
  2 import re
  3 import requests
  4 from openpyxl import Workbook
  5 from time import sleep
  6 import os
  7
  8
  9 def find_all_by_pat(pat, string):
 10     res = re.findall(pat, string)
 11     return res
 12
 13
 14 def get_html_doc(url):
 15     pro = ['122.152.196.126', '114.215.174.227', '119.185.30.75']
 16     head = {
 17         'user-Agent': 'Mozilla/5.0(Windows NT 10.0;Win64 x64)AppleWebkit/537.36(KHTML,like Gecko) chrome/58.0.3029.110 Safari/537.36'
 18     }
 19     resopnse = requests.get(url, proxies={'http': random.choice(pro)}, headers=head)
 20     resopnse.encoding = 'utf-8'
 21     html_doc = resopnse.text
 22     return html_doc
 23
 24
 25 def get_douban_html(query_name):
 26     url = 'https://www.douban.com/search?cat=1002&q=%s' % query_name
 27     douban_search_res = get_html_doc(url)
 28     return douban_search_res
 29
 30
 31 def get_chinese_name(pat, doc):
 32     res_list = find_all_by_pat(pat, doc)
 33     try:
 34         return res_list[1]
 35     except:
 36         return ' '
 37
 38
 39 def get_director_name(pat, doc):
 40     res = find_all_by_pat(pat, doc)
 41     try:
 42         return res[0].split('/')[1]
 43     except:
 44         return ' '
 45
 46
 47 if __name__ == "__main__":
 48     url = "https://www.imdb.com/chart/tvmeter/?ref_=nv_tvv_mptv"
 49     imdb_doc = get_html_doc(url)
 50     pat = r'<td class="titleColumn">\s*(.*)..*\s*.*\s*title=".*" >(.*)</a>.*\s*<span class="secondaryInfo">\((.*)\)</span>'
 51     res = find_all_by_pat(pat, imdb_doc)
 52
 53     pat2 = r'qcat.*\s*.*>(.*?)\s*</a>'
 54     pat3 = '<span\s*class="subject-cast">(.*)</span>'
 55     pat4 = r'<td class="ratingColumn imdbRating">\s*<strong title="(.*) based on .* user ratings">(.*)</strong>'
 56
 57     # 创建一个空列表用于存储结果
 58     result = []
 59
 60     for i in range(len(res)):
 61         doc = get_douban_html(res[i][1])
 62         chinise_name = get_chinese_name(pat2, doc)
 63
 64         director_name = get_director_name(pat3, doc)
 65
 66         rating_info = find_all_by_pat(pat4, imdb_doc)[i]
 67         rating = rating_info[1]
 68
 69         # 查找 up 和 down
 70         up_down_pat = r'<div class="velocity">(\d+)(<span class="secondaryInfo">\((up|down) (\d+)\)</span>|\(no change\))</div>'
 71         up_down_res = find_all_by_pat(up_down_pat, imdb_doc)
 72         if len(up_down_res) > i:
 73             rating_value = up_down_res[i][1]
 74             rating_change = up_down_res[i][2]
 75             if rating_change == '(no change)':
 76                 rating_change = '无变化'
 77             elif rating_change.startswith('('):
 78                 direction = rating_change[1:4]
 79                 change_value = rating_change[5:-1]
 80                 if direction == 'up ':
 81                     rating_change = '上升' + change_value
 82                 elif direction == 'dow':
 83                     rating_change = '下降' + change_value
 84         else:
 85             rating_change = '未知'
 86
 87
 88         # 将结果添加到列表中
 89         result.append([str(i + 1), chinise_name, res[i][1], director_name, res[i][2], rating, rating_change])
 90
 91         # 打印结果
 92         print(result[-1])
 93
 94         sleep(random.random() * 1.2)
 95
 96     # 将结果写入 Excel 文件
 97     wb = Workbook()
 98     sheet = wb.active
 99     sheet['A1'] = '排名'
100     sheet['B1'] = '中文名'
101     sheet['C1'] = '英文名'
102     sheet['D1'] = '导演'
103     sheet['E1'] = '年份'
104     sheet['F1'] = '评分'
105     sheet['G1'] = '排名变化'
106     for i in range(len(result)):
107         for j in range(len(result[i])):
108             sheet.cell(row=i + 2, column=j + 1).value = result[i][j]
109     desktop_path = os.path.join(os.path.expanduser("~"), 'Desktop')
110     wb.save(desktop_path + '/imdbTv.xlsx')
111
112
113 import requests
114 from bs4 import BeautifulSoup
115 import openpyxl
116
117 # 发送HTTP请求获取网页内容
118 url = 'https://www.imdb.com/chart/tvmeter/?ref_=nv_tvv_mptv'
119 response = requests.get(url)
120 html_content = response.content
121
122 # 使用BeautifulSoup解析网页内容
123 soup = BeautifulSoup(html_content, 'html.parser')
124
125 # 创建一个Excel工作簿和工作表
126 workbook = openpyxl.Workbook()
127 sheet = workbook.active
128
129 # 添加列标题
130 sheet.append(['名称', '当前排名', '近期上升情况', '近期下降情况'])
131
132 # 找到排名和排名变化所在的HTML元素
133 rankings_table = soup.find('tbody', class_='lister-list')
134 rows = rankings_table.find_all('tr')
135
136 # 提取排名、电影名、排名上升和排名下降数据,并写入Excel工作表
137 for row in rows:
138     rank_column = row.find('td', class_='titleColumn')
139     rank_text = row.find('div', class_='velocity').text.strip() if row.find('div', class_='velocity') else 'N/A'
140     rank = rank_text.split('\n')[0] if rank_text else 'N/A'
141
142     # 获取电影名信息
143     title_column = rank_column.find('a')
144     title = title_column.text.strip() if title_column else 'N/A'
145
146     change_column = row.find('div', class_='velocity')
147
148     up_icon = change_column.find('span', class_='global-sprite titlemeter up')
149     down_icon = change_column.find('span', class_='global-sprite titlemeter down')
150
151     if up_icon:
152         change = change_column.text.strip().split('\n')[-1].strip('()')
153         decrease = 'N/A'
154     elif down_icon:
155         change = 'N/A'
156         decrease = change_column.text.strip().split('\n')[-1].strip('()')
157     else:
158         change = 'N/A'
159         decrease = 'N/A'
160
161     sheet.append([title, rank, change, decrease])
162
163 # 保存Excel文件
164 file_path = 'C:\\Users\\David\\Desktop\\imdb_rankings.xlsx'
165 workbook.save(file_path)
166 print(f"文件已保存至:{file_path}")
167
168
169
170
171 import pandas as pd
172
173 # 读取Excel文件
174 df2 = pd.read_excel('C:/Users/David/Desktop/imdbTv.xlsx')
175
176 print(df2.head(10))
177
178 #删除无效列‘排名变化’
179 df2.drop('排名变化', axis=1, inplace=True)
180 df2.to_excel('C:/Users/David/Desktop/imdbTv.xlsx', index=False)
181 print(df2.head(10))
182
183
184
185 import pandas as pd
186
187 # 读取表格数据
188 df4 = pd.read_excel('C:/Users/David/Desktop/imdbTv.xlsx')
189
190 # 删除带有空值的行
191 df4.dropna(inplace=True)
192
193 # 将处理后的数据保存到新的表格文件中
194 df4.to_excel('C:/Users/David/Desktop/imdbTv.xlsx', index=False)
195 print(df3.head(70))
196
197
198
199 import pandas as pd
200
201 df = pd.read_excel('C:/Users/David/Desktop/imdbTv.xlsx')
202 # 统计每列中缺失值的数量
203 missing_values_count = df.isnull().sum()
204
205 # 打印每列中缺失值的数量
206 print(missing_values_count)
207
208
209
210
211 import pandas as pd
212
213 df = pd.read_excel('C:/Users/David/Desktop/imdbTv.xlsx')
214 # 统计每列中空值的数量
215 empty_values_count = df.isna().sum()
216
217 # 打印每列中空值的数量
218 print(empty_values_count)
219
220
221
222 import pandas as pd
223 import matplotlib.pyplot as plt
224
225 # 读取Excel文件
226 df = pd.read_excel('C:/Users/David/Desktop/imdbTv.xlsx')
227
228 # 绘制评分直方图
229 plt.hist(df['评分'], bins=10)
230 plt.xlabel('评分')
231 plt.ylabel('频数')
232 plt.title('电视剧评分直方图')
233 plt.show()
234
235
236
237 import pandas as pd
238 import matplotlib.pyplot as plt
239
240 # 读取Excel文件
241 df = pd.read_excel('C:/Users/David/Desktop/imdbTv.xlsx')
242
243 # 绘制排名柱形图
244 plt.bar(df['排名'], df['评分'])
245 plt.xlabel('排名')
246 plt.ylabel('评分')
247 plt.title('ranking and rating')
248
249 # 旋转横坐标标签
250 plt.xticks(rotation=45)
251
252 # 调整图像大小
253 plt.figure(figsize=(15, 10))
254
255 plt.show()
256
257 # 绘制年份柱形图
258 plt.bar(df['年份'], df['评分'])
259 plt.xlabel('年份')
260 plt.ylabel('评分')
261 plt.title('Tv year and rating')
262
263 # 旋转横坐标标签
264 plt.xticks(rotation=45)
265
266 # 调整图像大小
267 plt.figure(figsize=(15, 10))
268
269 plt.show()
270
271
272
273 import pandas as pd
274 import matplotlib.pyplot as plt
275
276 # 读取Excel文件
277 df = pd.read_excel('C:/Users/David/Desktop/imdbTv.xlsx')
278
279 # 绘制排名和评分的散点图
280 plt.scatter(df['排名'], df['评分'])
281 plt.xlabel('排名')
282 plt.ylabel('评分')
283 plt.title('电视剧排名和评分散点图')
284 plt.show()
285
286
287
288
289 import pandas as pd
290 import matplotlib.pyplot as plt
291
292 # 读取Excel文件
293 df = pd.read_excel('C:/Users/David/Desktop/imdbTv.xlsx')
294
295 # 绘制排名和年份的散点图
296 plt.scatter(df['排名'], df['年份'])
297 plt.xlabel('排名')
298 plt.ylabel('年份')
299 plt.title('电视剧排名和年份散点图')
300 plt.show()
301
302
303
304
305 import pandas as pd
306 import matplotlib.pyplot as plt
307
308 # 读取Excel文件
309 df = pd.read_excel('C:/Users/David/Desktop/imdbTv.xlsx')
310
311 # 绘制评分的盒图
312 plt.boxplot(df['评分'])
313 plt.ylabel('评分')
314 plt.title('电视剧评分盒图')
315 plt.show()
316
317
318
319
320 import pandas as pd
321 import matplotlib.pyplot as plt
322
323 # 读取Excel文件
324 df = pd.read_excel('C:/Users/David/Desktop/imdbTv.xlsx')
325
326 # 绘制年份的盒图
327 plt.boxplot(df['年份'])
328 plt.ylabel('年份')
329 plt.title('电视剧年份盒图')
330 plt.show()
331
332
333
334
335 import pandas as pd
336 import matplotlib.pyplot as plt
337 from scipy import stats
338
339 # 读取Excel文件
340 df = pd.read_excel('C:/Users/David/Desktop/imdbTv.xlsx')
341
342 # 计算评分和年份之间的相关系数
343 r, p = stats.pearsonr(df['评分'], df['年份'])
344 print('评分和年份之间的相关系数为:', r)
345
346 # 绘制评分和年份的散点图
347 plt.scatter(df['评分'], df['年份'])
348 plt.xlabel('评分')
349 plt.ylabel('年份')
350 plt.title('电视剧评分和年份散点图')
351 plt.show()
352
353 # 建立评分和年份之间的线性回归方程
354 slope, intercept, r_value, p_value, std_err = stats.linregress(df['评分'], df['年份'])
355 print('评分和年份之间的回归方程为:y =', slope, 'x +', intercept)
356
357
358
359
360
361
362
363 import pandas as pd
364 import numpy as np
365 import matplotlib.pyplot as plt
366 from scipy import stats
367
368 # 读取Excel文件
369 df = pd.read_excel('C:/Users/David/Desktop/imdbTv.xlsx')
370
371 # 计算相关系数
372 corr_matrix = df.corr()
373 print(corr_matrix)
374
375 # 绘制散点图
376 plt.scatter(df['排名'], df['评分'])
377 plt.xlabel('排名')
378 plt.ylabel('评分')
379 plt.title('排名和评分的散点图')
380 plt.show()
381
382 # 建立回归方程
383 x = df['排名']
384 y = df['评分']
385 slope, intercept, r_value, p_value, std_err = stats.linregress(x, y)
386 print('回归方程为:y =', slope, 'x +', intercept)
387
388 # 绘制回归线
389 plt.scatter(x, y)
390 plt.plot(x, slope * x + intercept, color='red')
391 plt.xlabel('排名')
392 plt.ylabel('评分')
393 plt.title('排名和评分的回归线')
394 plt.show()
395
396
397
398
399 import pandas as pd
400 import numpy as np
401 import matplotlib.pyplot as plt
402 from scipy import stats
403
404 # 读取Excel文件
405 df = pd.read_excel('C:/Users/David/Desktop/imdbTv.xlsx')
406
407 # 计算相关系数
408 corr_matrix = df.corr()
409 print(corr_matrix)
410
411 # 绘制散点图
412 plt.scatter(df['排名'], df['年份'])
413 plt.xlabel('排名')
414 plt.ylabel('年份')
415 plt.title('排名和年份的散点图')
416 plt.show()
417
418 # 建立回归方程
419 x = df['排名']
420 y = df['年份']
421 slope, intercept, r_value, p_value, std_err = stats.linregress(x, y)
422 print('回归方程为:y =', slope, 'x +', intercept)
423
424 # 绘制回归线
425 plt.scatter(x, y)
426 plt.plot(x, slope * x + intercept, color='red')
427 plt.xlabel('排名')
428 plt.ylabel('年份')
429 plt.title('排名和年份的回归线')
430 plt.show()
431
432
433
434
435 import matplotlib.pyplot as plt
436 import pandas as pd
437
438 # 读取数据
439 df = pd.read_excel('C:/Users/David/Desktop/imdb_rankings.xlsx')
440
441 # 绘制散点图
442 fig, ax = plt.subplots()
443 ax.scatter(df['当前排名'], df['近期上升情况'], color='g', label='Up')
444 ax.scatter(df['当前排名'], df['近期下降情况'], color='r', label='Down')
445 ax.set_xlabel('Ranking')
446 ax.set_ylabel('Change')
447 ax.legend()
448 plt.show()
449
450
451
452
453 #IMDB电视剧评分分布
454 import pandas as pd
455 import matplotlib.pyplot as plt
456
457 # 读取Excel文件
458 df = pd.read_excel('C:/Users/David/Desktop/imdbTv.xlsx')
459
460 # 选择评分列数据
461 ratings = df['评分']
462
463 # 将评分数据分为8个区间
464 bins = [0, 6, 6.5, 7, 7.5, 8, 8.5, 9, 10]
465 labels = ['6.0以下', '6.0~6.5', '6.5~7.0', '7.0~7.5', '7.5~8.0', '8.0~8.5', '8.5~9.0', '9.0以上']
466 rating_bins = pd.cut(ratings, bins=bins, labels=labels)
467
468 # 统计各个区间的评分数量
469 rating_counts = rating_bins.value_counts()
470
471 # 绘制饼状图
472 plt.pie(rating_counts.values, labels=rating_counts.index, autopct='%1.1f%%')
473 plt.title('IMDB电视剧评分分布')
474 plt.show()
475
476
477
478
479 #IMDB电视剧年份分布
480 import pandas as pd
481 import matplotlib.pyplot as plt
482
483 # 读取Excel文件
484 df = pd.read_excel('C:/Users/David/Desktop/imdbTv.xlsx')
485
486 # 选择年份列数据
487 years = df['年份']
488
489 # 将年份数据分为8个区间
490 bins = [1950, 1960, 1970, 1980, 1990, 2000, 2010, 2020, 2030]
491 labels = ['1950s', '1960s', '1970s', '1980s', '1990s', '2000s', '2010s', '2020s']
492 year_bins = pd.cut(years, bins=bins, labels=labels)
493
494 # 统计各个区间的年份数量
495 year_counts = year_bins.value_counts()
496
497 # 绘制饼状图
498 plt.pie(year_counts.values, labels=year_counts.index, autopct='%1.1f%%')
499 plt.title('IMDB电视剧年份分布')
500 plt.show()
五、总结(10 分)
1.经过对主题数据的分析与可视化,可以得到哪些结论?是否达到预期的目标?
美剧依然是最受欢迎的类型,其中《权力的游戏》、《绝命毒师》、《黑镜》等热门美剧排名靠前。英剧和日剧在受欢迎程度上也占有一定的份额,例如《神探夏洛克》、《行尸走肉》、《攻壳机动队》等。近年来,随着OTT平台的兴起,来自Netflix、Amazon Prime Video、HBO等平台的原创剧集越来越受欢迎,例如《怪奇物语》、《纸牌屋》、《西部世界》等。近年来的剧集普遍受到观众和评论家的欢迎,例如2010年以后的剧集评分普遍较高,其中不乏《权力的游戏》、《绝命毒师》、《黑镜》等经典剧集。20世纪90年代和2000年代初期的剧集评分也较高,例如《越狱》、《老友记》、《逝去的爱丽丝》等。80年代和70年代的剧集评分相对较低,但仍有一些经典剧集,例如《辛普森一家》、《霹雳游侠》等。50年代和60年代的剧集评分普遍较低,但这个时期的电视剧还处于发展初期,剧集类型和制作水平都有限。总体而言,随着电视剧的发展和进步,剧集的质量和评分也在不断提高。
2.在完成此设计过程中,得到哪些收获?以及要改进的建议?
收获:
- 程序中使用了豆瓣网站的搜索功能,可能会被豆瓣网站的反爬虫机制识别为恶意行为,要进行一些特殊处理:比如设置请求头等。
- 程序中使用了代理IP,如果代理IP不可用或被封禁,可能会导致程序无法正常运行。
- 程序中使用了随机等待时间,以减少对目标网站的访问频率,建议不要过度频繁地运行程序。
改进:
-
增加多线程或异步处理功能,以便提高程序的爬取效率和速度。
- 可以加入日志记录功能,以便于排查错误和跟踪程序运行情况。可以使用 Python 自带的 logging 模块,将程序运行过程中的关键信息记录到日志文件中,以便于后续分析和处理

 浙公网安备 33010602011771号