cuBlas API Launch Latency 耗时异常分析记录
一、背景
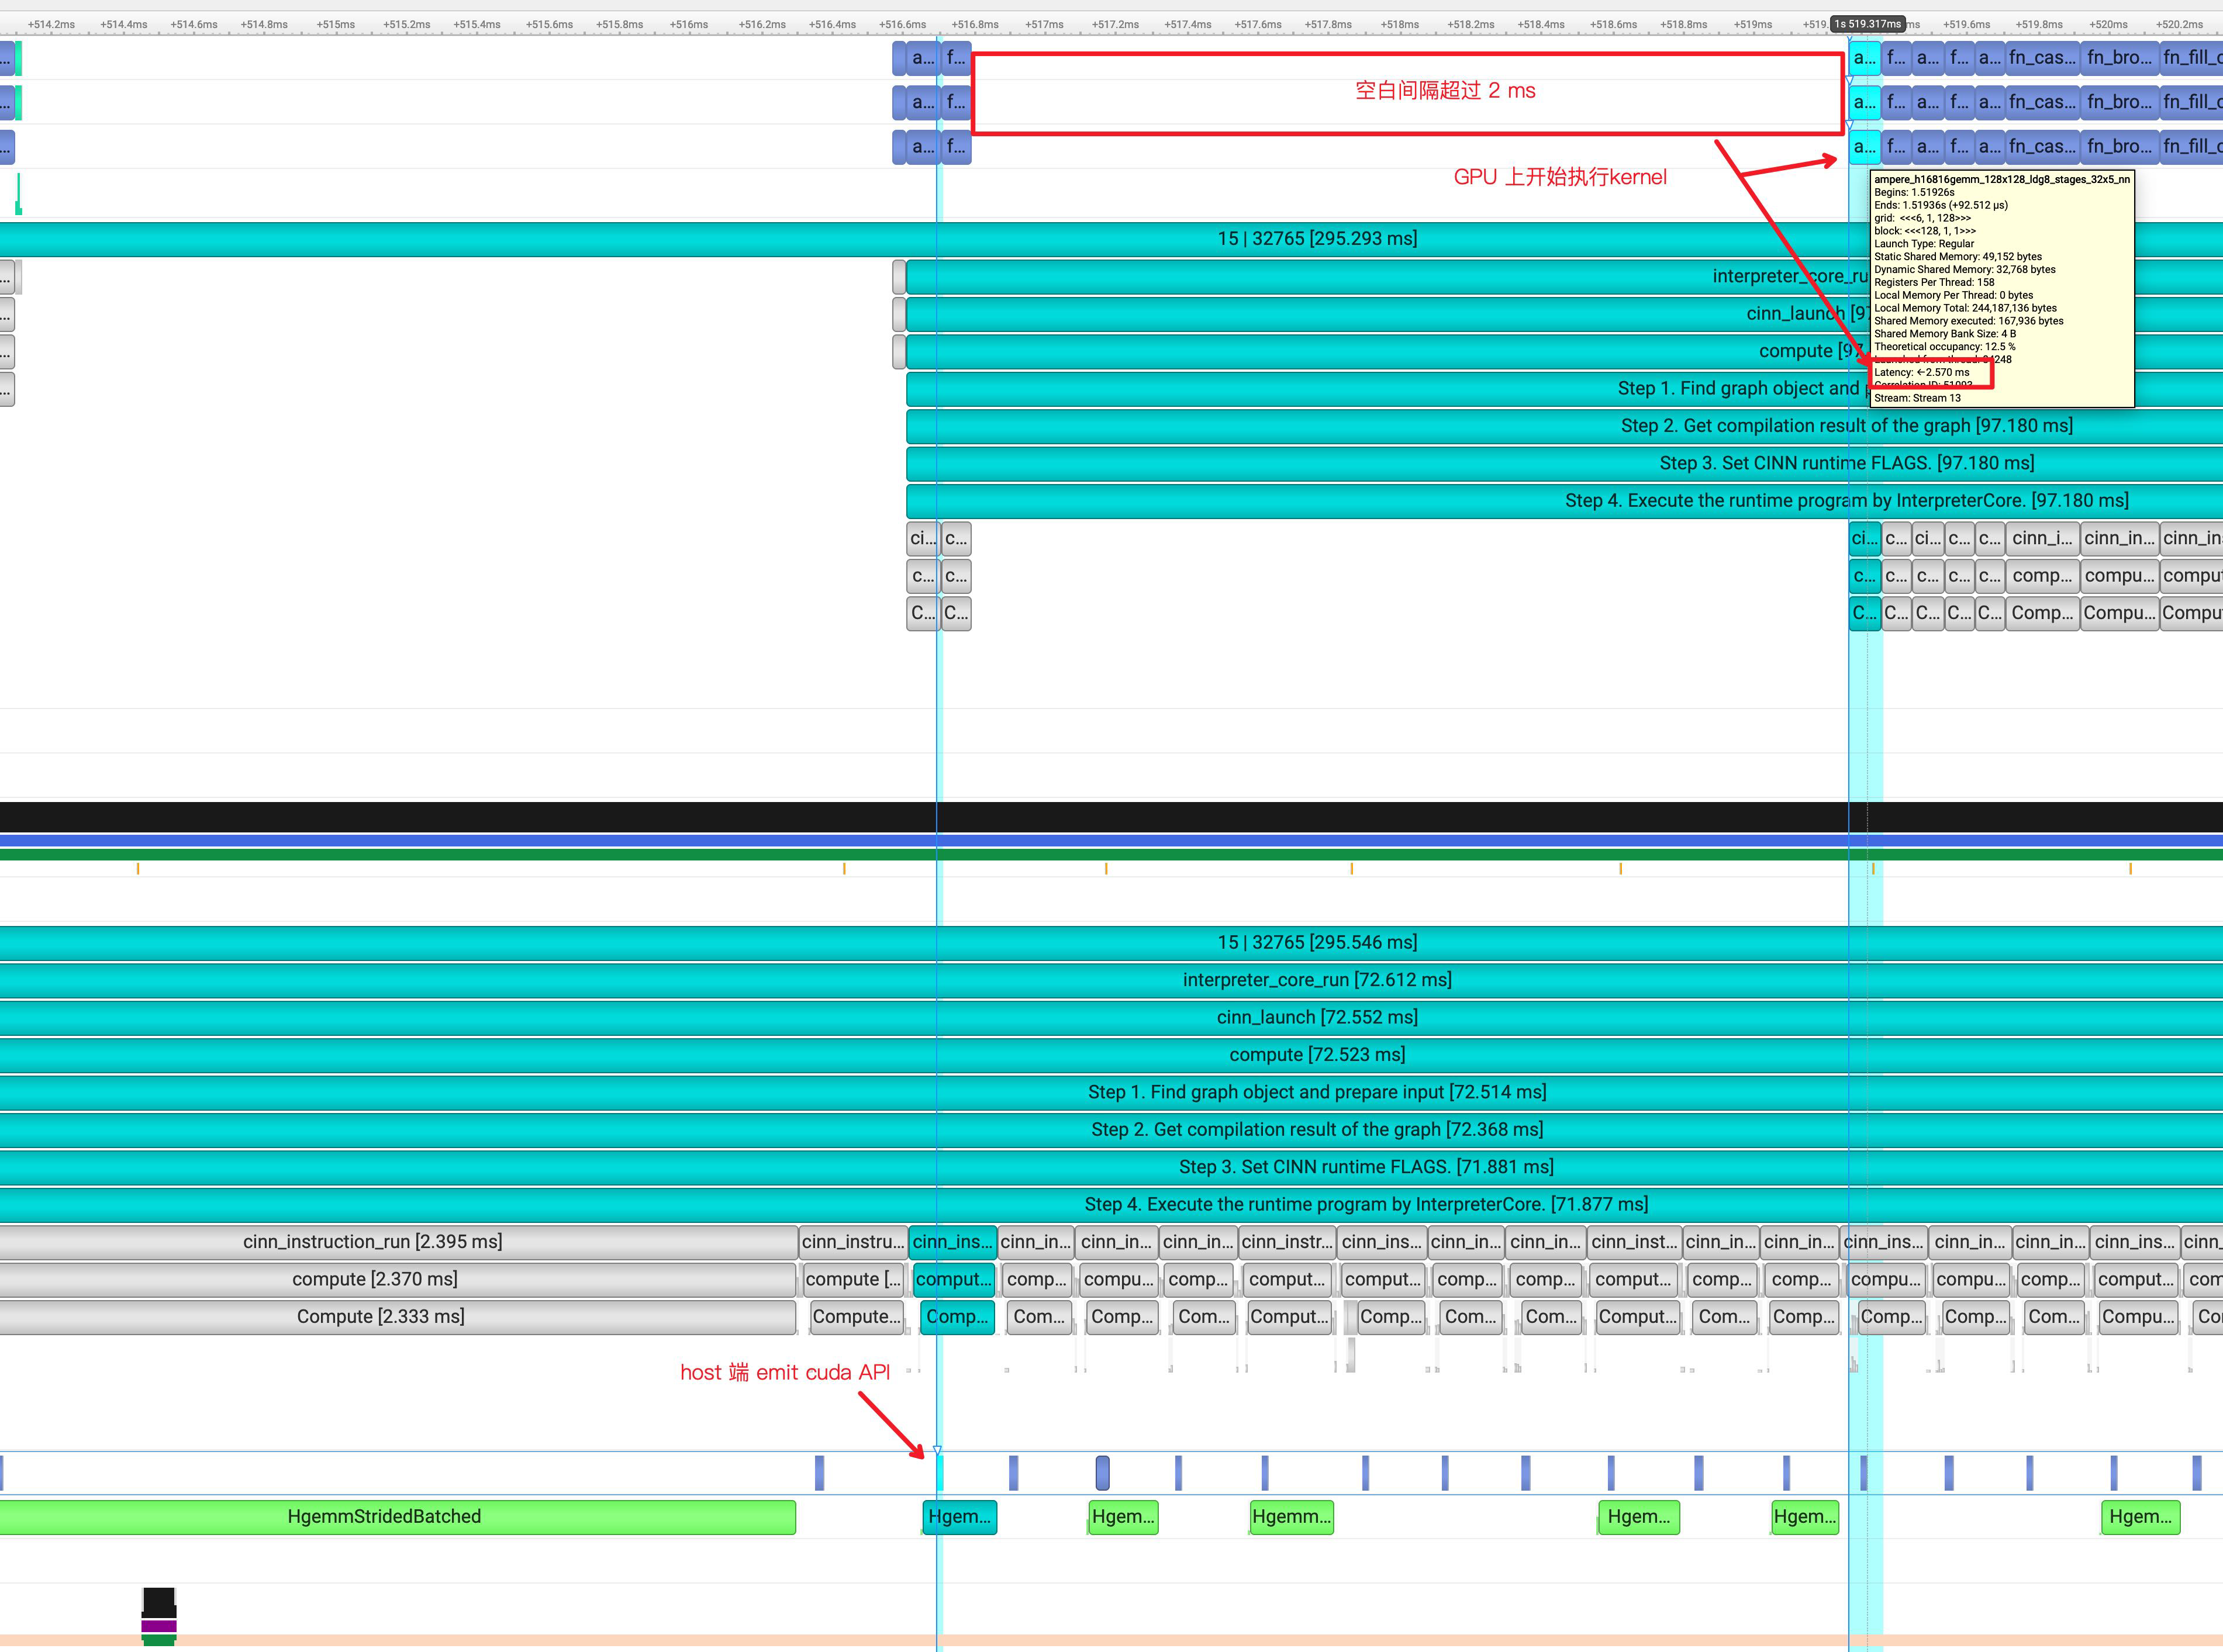
最近在做 AI 编译器生成 Kernel 支持 Bert 模型训练调优工作,在分析 bert 的timeline中发现,在每个 step 的前两个 cinn_instruction_run 之后,总是固定跟着一个 2.5 ms 左右的空白。但 HOST 端其实很早就 emit 了CUDA API,只是为什么 GPU 要有那个大的 Latency 后才执行呢?
从 Nvidia 官方论坛上可知,正常情况下一个 cuda kernel launch 的 Latency 在 us 级别。
- Nvidia 官方文档原文:CUDA kernel launch latency could be defined as the time range from the beginning of the launch API call to the beginning of the kernel execution. There are about 20 µs of launch latency. If the launch API call takes 10 µs on your system, you can only launch at most 100,000 kernels per second.
- Nvidia 官方论坛讨论:Kernel launch overhead is frequently cited as 5 microseconds. My understanding of the PCIe transactions is limited, but best I know a kernel launch requires at least two transactions: (1) host sending a kernel launch command to the GPU (2) GPU sending an acknowledgement back to the host.
二、研习 Nvidia 手册
2.1 官网手册
在Nvidia的官方文档中,Overhead 主要包括如下几个部分:
- CPU wrapper
- memory
- GPU lauch overhead
2.2 CPU wrapper
这部分要包含了在多线程下硬件上所有的 mutex-lock 相关的操作。若进行了 mutex 相关操作,在 Nsight Timeline 的 os runtime 那一行会出现 pthread_mutex_lock
原文: This includes any mutex-lock contention that occurs in the driver if doing multi-threaded launching. You can see if you are hitting mutex contention within the driver by collecting OS Runtime data, which shows any pthread_mutex_lock calls lasting above a user-settable threshold.

2.3 memory
这部分主要包括数据搬运的开销,如 H2D、D2H、D2D。
原文:This is the overhead of moving data back and forth from the CPU to the GPU, or from one GPU to another. For example, this would be the time it takes to read the input tensors and writing output to DRAM.
2.4 GPU launch overhead
这部分主要包括从「取一个command」到「GPU上开始执行」之间的时间开销。主要包括:
原文:This is the time it takes for the GPU to retrieve the command and begin executing it.
- GPU 上可能有不同的
context active,在执行一个新的应用程序时,需要进行「上下文」切换,比如 GPU 正在渲染 PC Desktop,则需要进行上下文切换以运行另一个 command 任务。若命中「上下文切换」,这会通过收集GPU Context Switch信息展示出来。(绿色表示没有进行切换) - GPU 可能被前面的 comman 给 blocked 阻塞住,触发等待操作
- CUDA 支持多 stream,且每个 stream 的 kernel 是序贯执行的,且 memcpys 必须按照顺序执行。
- GPU 必须按照优先级,优先执行优先级高的 kernel

这里从Nvidia的官方文档上,发现了一个很重要的信息:Nsight 会额外实时收集CPU 上的 IP/Backstrace 信息,就是上图的中黄色方框的sampling point,这个可以辅助判断当前时间节点 CPU 在做什么事情。
原文:Sampling data was also collected, as you can see by the orange/yellow marks below the thread state timeline. Each mark represents the point when a CPU IP/backtrace sample was collected. When this screenshot was captured, the mouse (not shown) was hovering on the sampling mark just above the left side of the tooltip. The tooltip shows the CPU IP/backtrace for that thread at that moment. Looking at the vectorAdd source code, you can easily see the application was checking the results of the GPU’s calculation.
三、 GLOG_v日志和源码
首先看下空白后面这个 Kernel 的代码:
function fn_broadcast_to_224_elementwise_add_225_reshape_264_transpose_303_1614_kernel (_linear_2__b_0, _var_1137, _var_1381)
if ((blockIdx.x < 12288)) {
  if ((threadIdx.x < 1024)) {
    var_1381[((1024 * blockIdx.x) + threadIdx.x)] = (var_1137[((((blockIdx.x % 96) / 8) * 64) + ((768 * (threadIdx.x / 64)) + (((blockIdx.x / 96) * 98304) + ((12288 * (blockIdx.x % 8)) + (threadIdx.x % 64)))))] + linear_2__b_0[(((threadIdx.x % 64) + (((blockIdx.x % 96) / 8) * 64)) % 768)])
  }
}
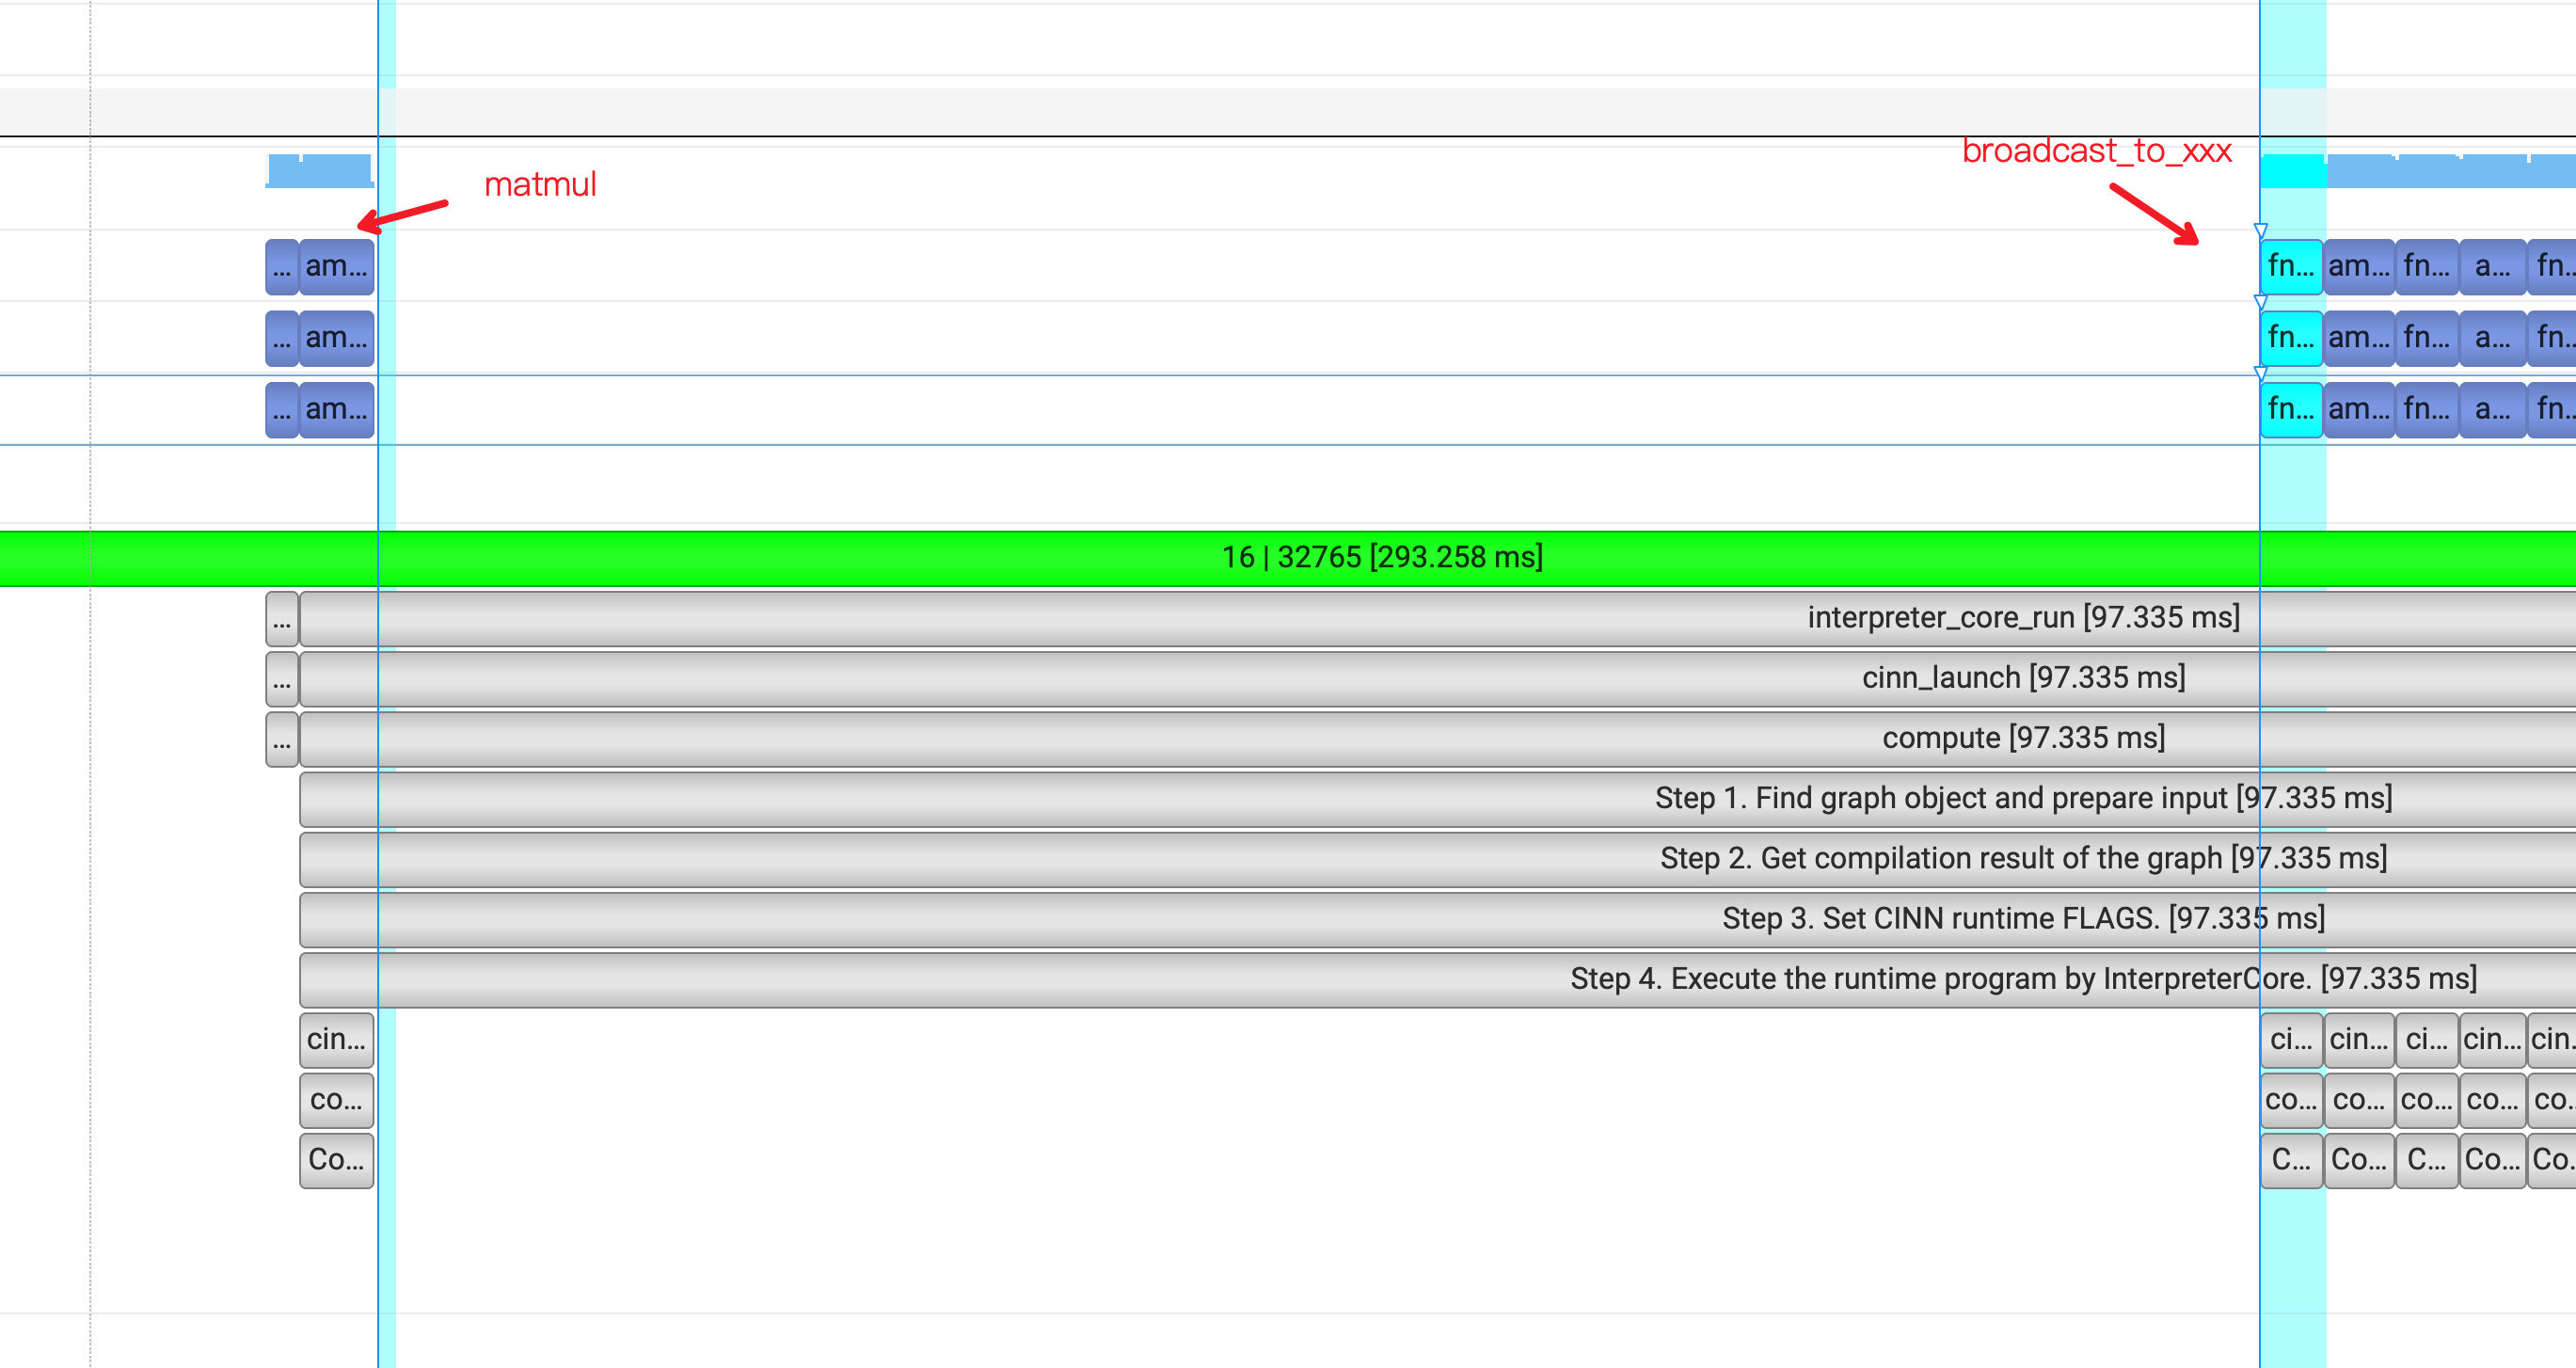
但是,通过分析不同 step 的初始空白,发现有不同的情况。在 Bert 模型训练中,前面的几个 Kernel 对应3个平行的 matmul + fn_broadcast_to_elementwise_add_reshape_transpose 组合对,我们下面简称为:matmul + fn_xx 吧:
- 场景一:
fn_xx之后出现大空白 - 场景二:
matmul之后出现大空白
由此可知,大空白的出现与 Kernel 不是强烈耦合的,可能有其他潜在的原因在里面,因为我们首先要找到「是什么因素影响了这个Latency」?
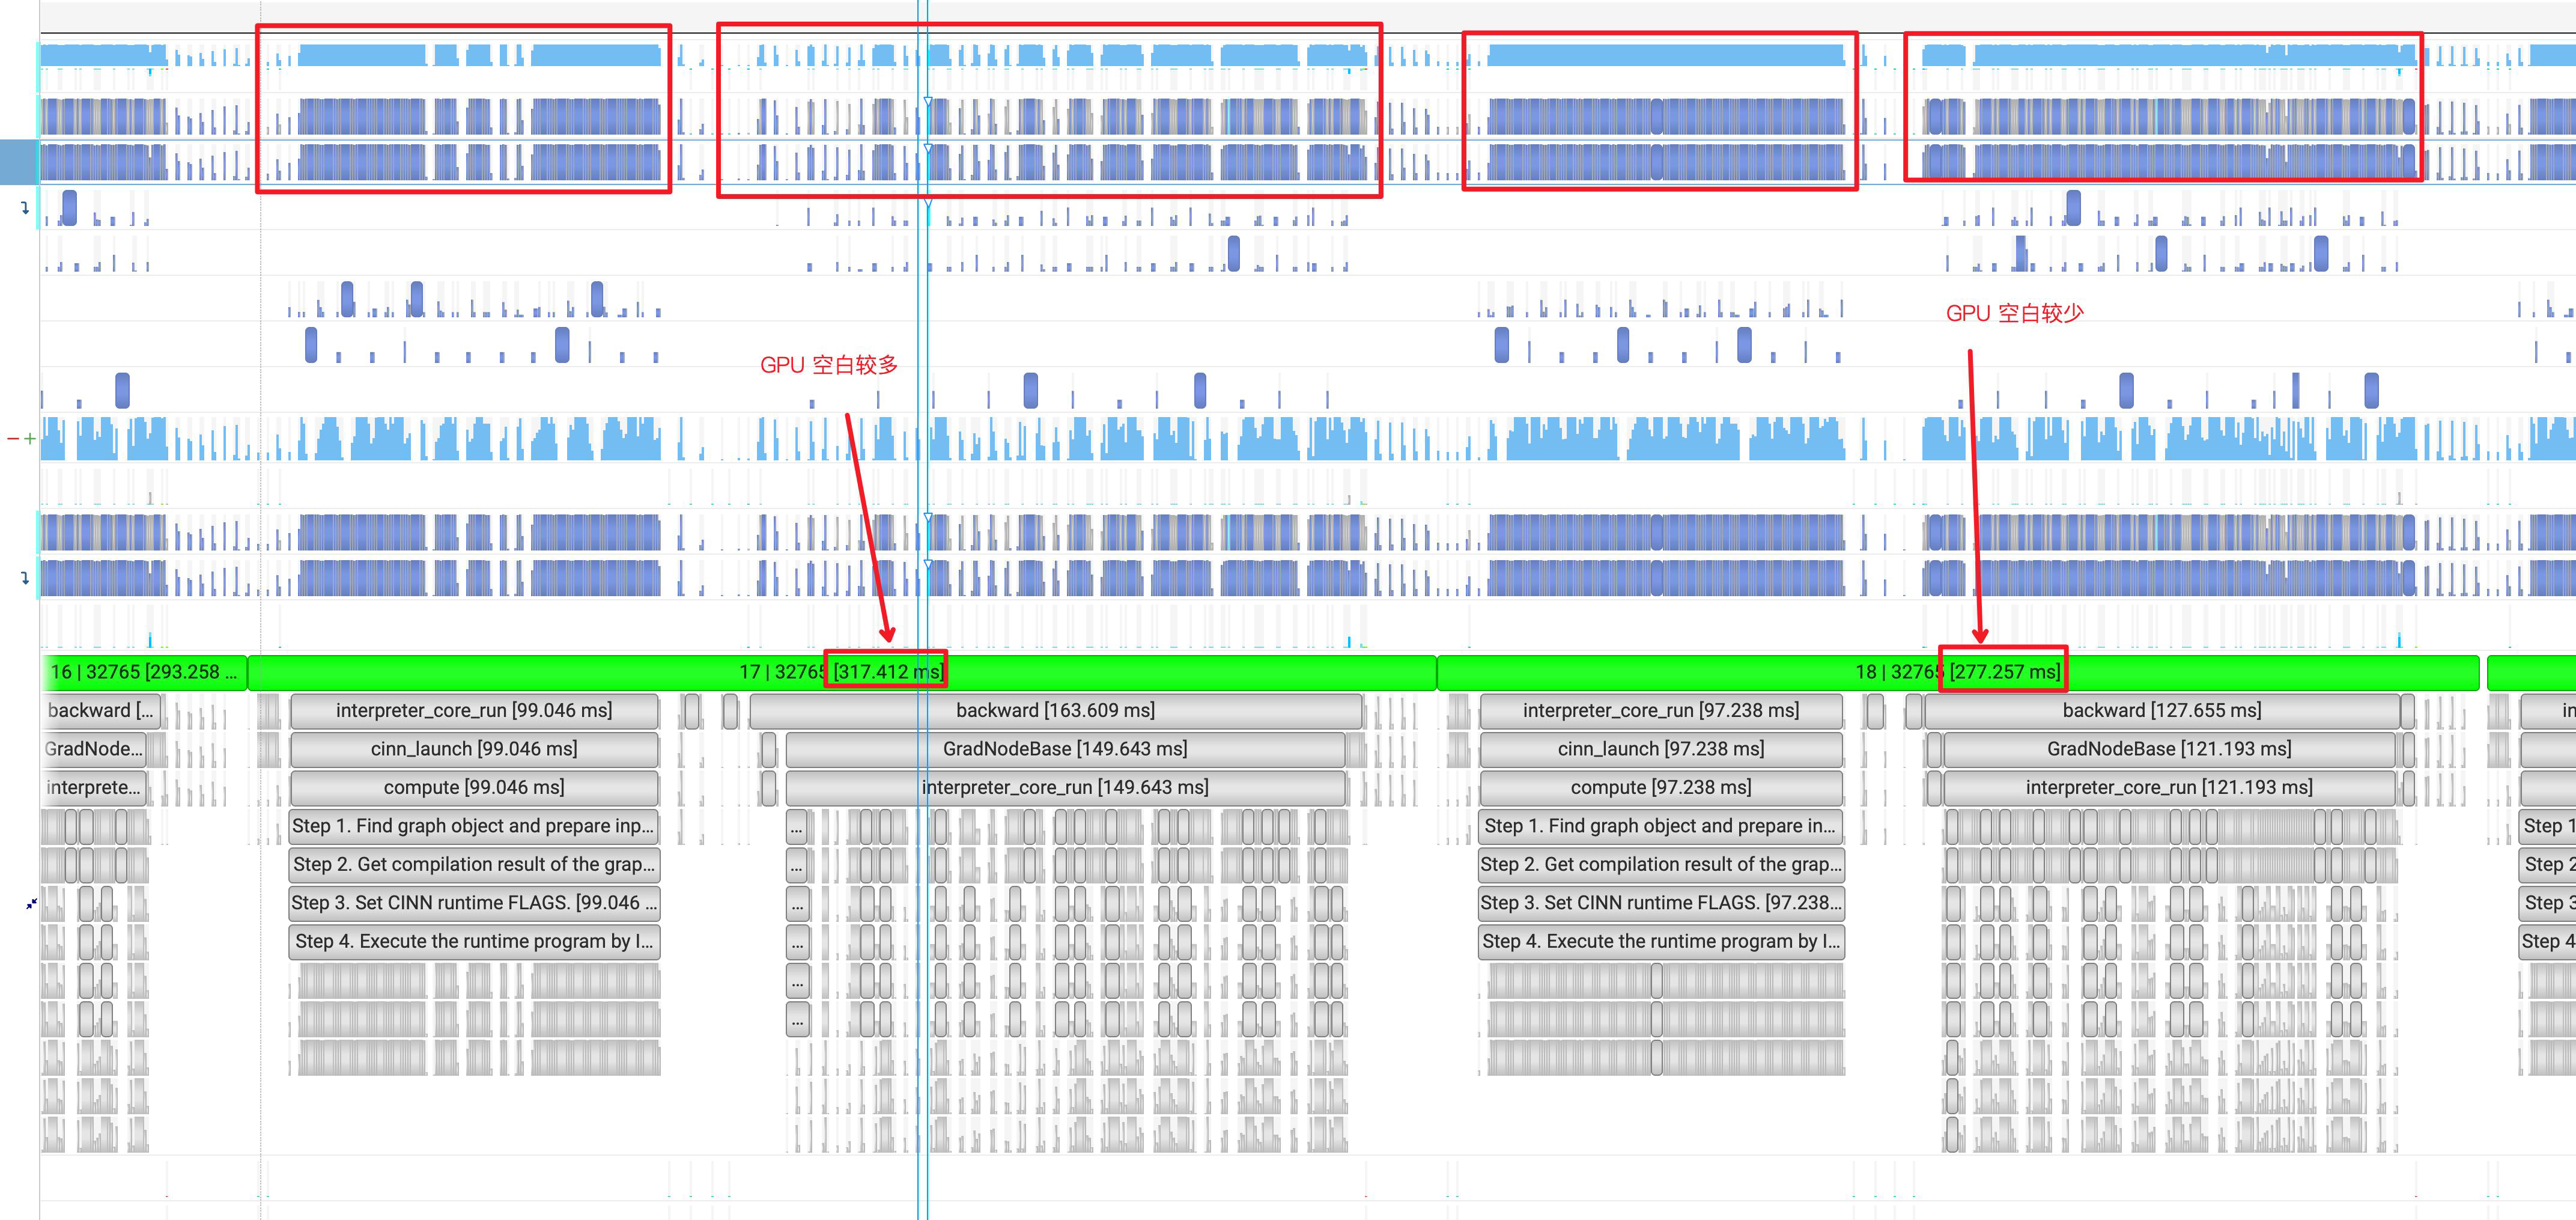
总览的看了不同step的timeline,发现不同step下的GPU 空白表现不稳定,有的step下GPU占用率会比较好,有的step下GPU空白会比较多,如下图:
四、新A100机器上交叉复测
详细分析了A100 机器 A 上的timeline,违背经验认知,故在之前分布式队列上下线的A100 机器 B 上安装 NSight 脚本交叉复测一组 Timeline 文件,排除机器的影响(A 是一个多人复用的开发机,B 机器使用的人比较少)
从 timeline上可以看出,在新的 A100 机器上,情况就比较简单了:稳定在第一个matmul 的 cublas API 之后,且 HgemmStridedBatched 的开销与空白时间严格对应。这一点跟 A机器上完全不同,从文档的最前面 timeline 来看,HgemmStridedBatched 的API 调用位置是与GPU stream的时间点是错开的。

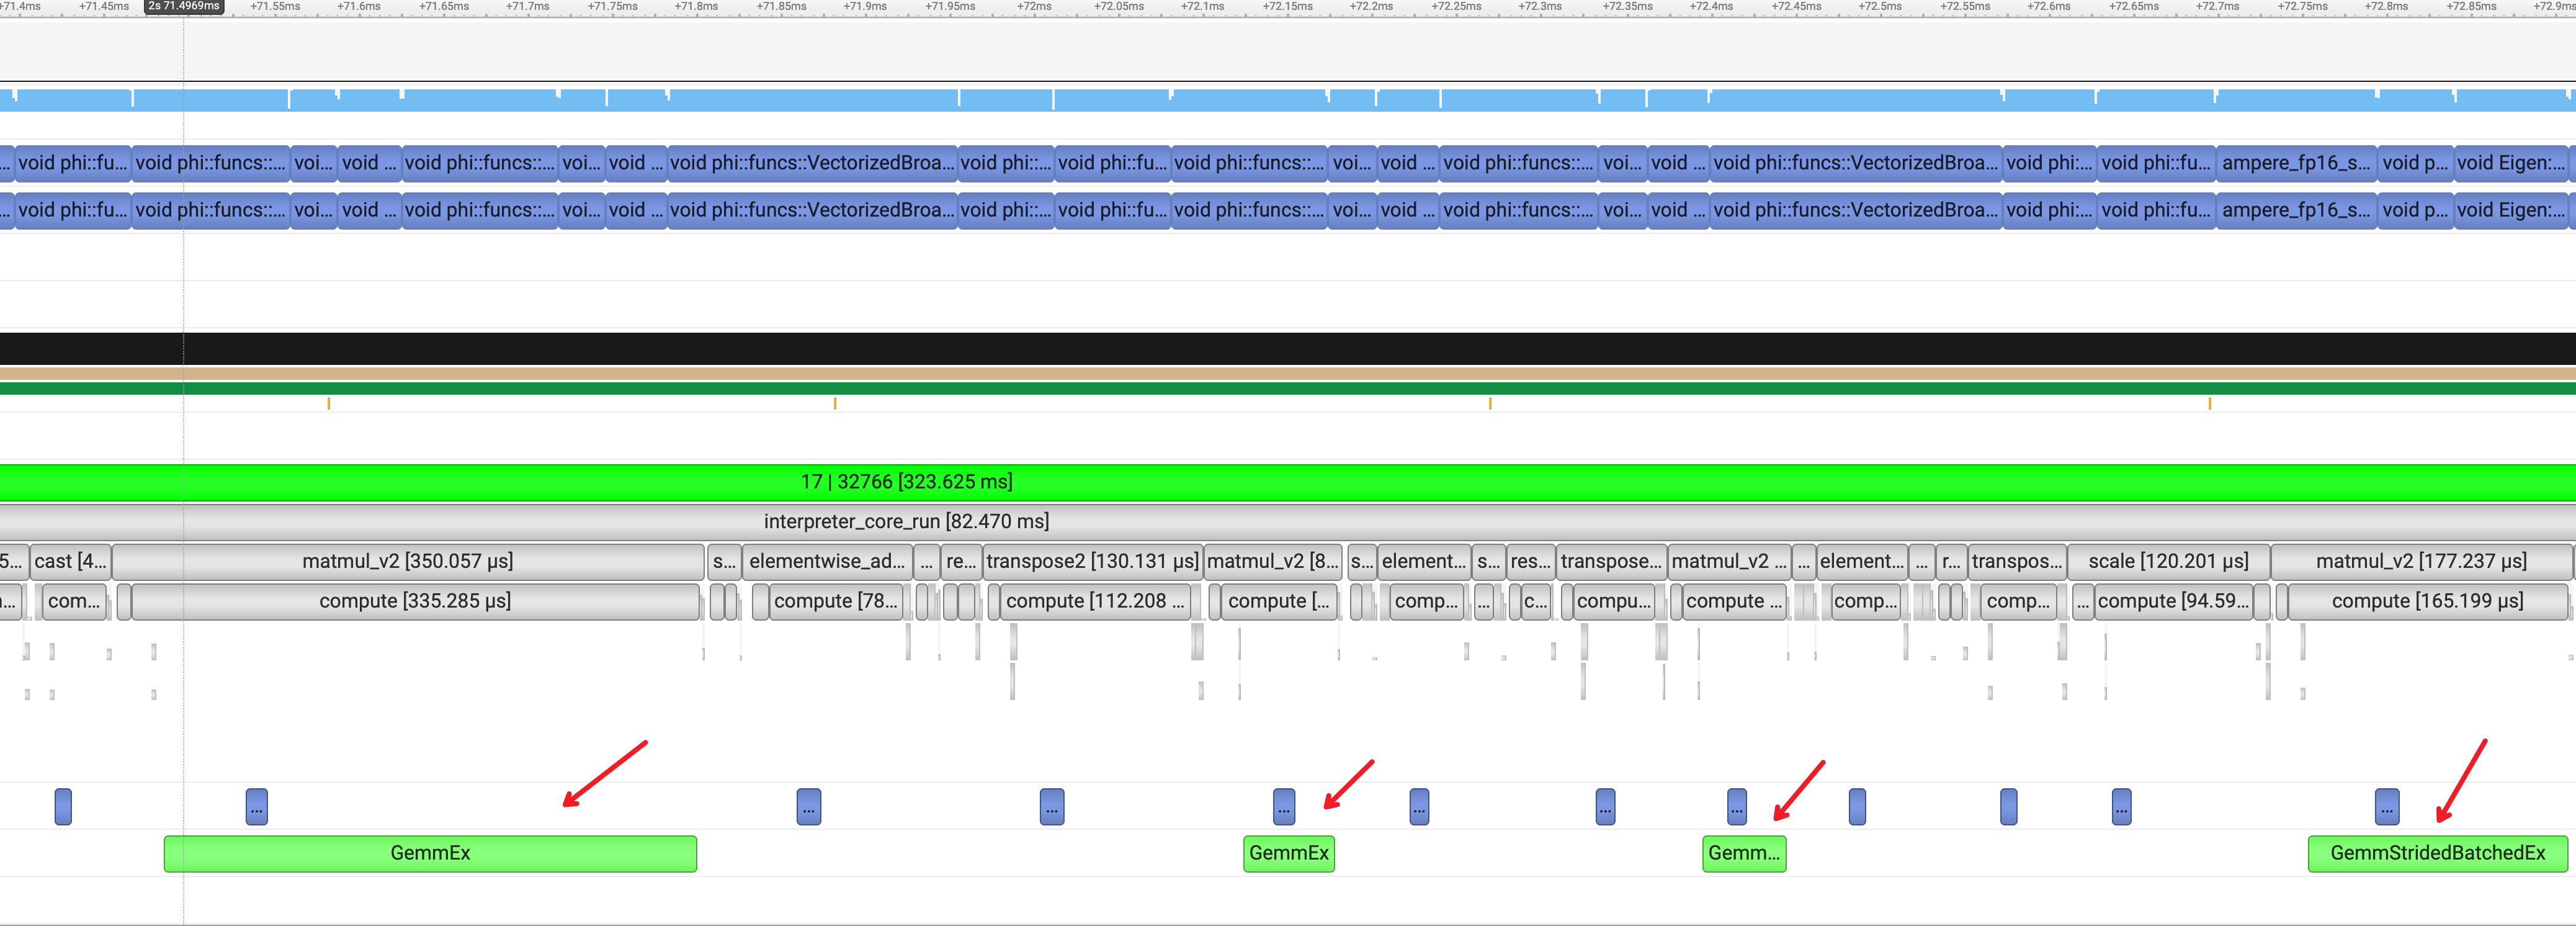
也许这个 HgemmStridedBatched 是一个可以深入分析的思路。首先我们先对比下与原生动转静的 timeline 里的 Kernel,从下图可以看处,主要包括两大类:
- GemmEx
- GemmStridedBatchedEx
CINN 里统一使用的 HgemmStridedBatched 查看了相关API调用的入口函数源码,在函数各个分支里添加了VLOG,输出必要的信息,查看走了哪些分支:
void cinn_call_cublas(void *v_args,
                      int num_args,
                      bool trans_a,
                      bool trans_b,
                      bool trans_o,
                      float alpha,
                      float beta,
                      int a1,
                      int a2,
                      int a3,
                      int a4,
                      int b1,
                      int b2,
                      int b3,
                      int b4,
                      void *stream) {

    // 省略
    CUBLAS_CALL(cublasGemmStridedBatched(cuda_dtype,
                                         cuhandle,
                                         trans_op_l,
                                         trans_op_r,
                                         m,
                                         n,
                                         k,
                                         alpha,
                                         lhs,
                                         ldl,
                                         stride_l,
                                         rhs,
                                         ldr,
                                         stride_r,
                                         beta,
                                         C,
                                         ldc,
                                         m * n,
                                         batch));

     // 省略

                      }
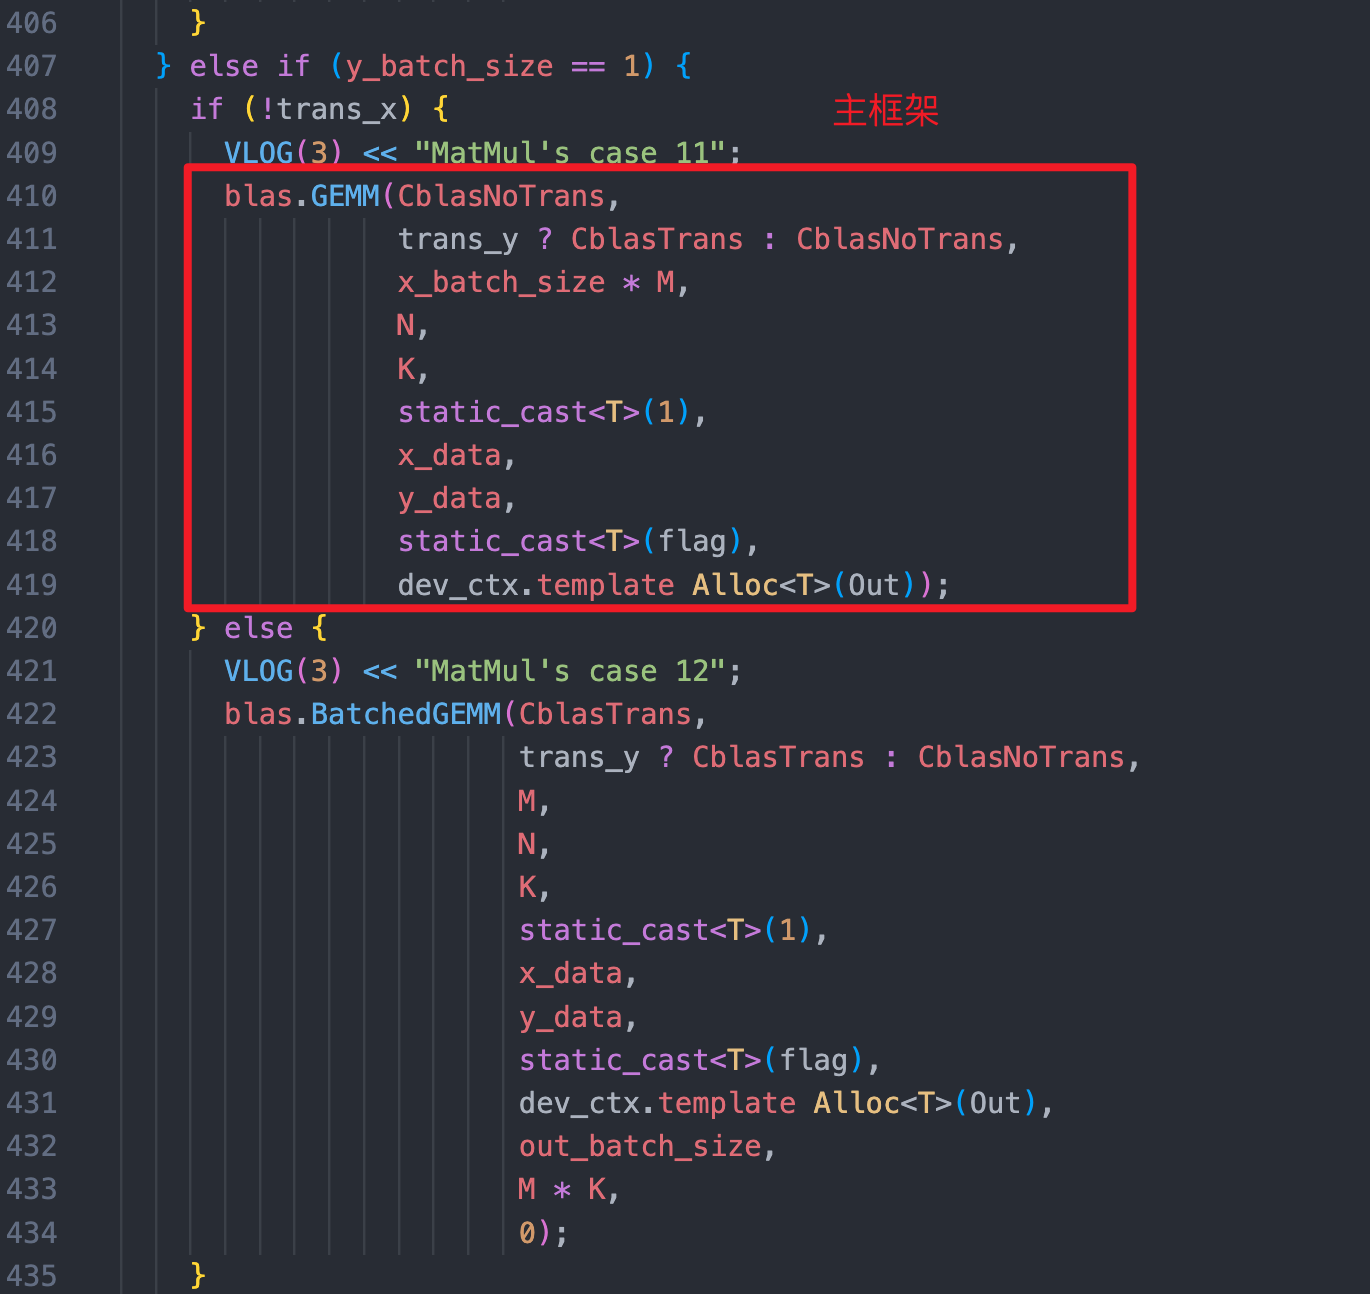
场景一:[128, 128, 768] * [768, 768] ,调用了 cublasGemmStridedBatched ,但主框架是调用的是 GemmEX ,不太符合预期
I0508 09:34:19.758335 99667 cuda_util.cc:134] a1: 1
I0508 09:34:19.758383 99667 cuda_util.cc:135] a2: 128
I0508 09:34:19.758399 99667 cuda_util.cc:136] a3: 128
I0508 09:34:19.758404 99667 cuda_util.cc:137] a4: 768
I0508 09:34:19.758407 99667 cuda_util.cc:138] b1: 1
I0508 09:34:19.758412 99667 cuda_util.cc:139] b2: 1
I0508 09:34:19.758419 99667 cuda_util.cc:140] b3: 768
I0508 09:34:19.758422 99667 cuda_util.cc:141] b4: 768
I0508 09:34:19.758430 99667 cuda_util.cc:183] call cublasGemmStridedBatched with batch 128, isl: 0 isr: 98304
场景二:[128, 12, 128, 64] * [128, 12, 128 ,64] ,shape相同,trans_b = True ,符合预期。
I0508 09:47:09.494791 100378 cuda_util.cc:134] a1: 128
I0508 09:47:09.494797 100378 cuda_util.cc:135] a2: 12
I0508 09:47:09.494799 100378 cuda_util.cc:136] a3: 128
I0508 09:47:09.494801 100378 cuda_util.cc:137] a4: 64
I0508 09:47:09.494804 100378 cuda_util.cc:138] b1: 128
I0508 09:47:09.494807 100378 cuda_util.cc:139] b2: 12
I0508 09:47:09.494809 100378 cuda_util.cc:140] b3: 128
I0508 09:47:09.494812 100378 cuda_util.cc:141] b4: 64
I0508 09:47:09.494813 100378 cuda_util.cc:142] trans_a: 0
I0508 09:47:09.494817 100378 cuda_util.cc:143] trans_b: 1
I0508 09:47:09.494818 100378 cuda_util.cc:144] trans_o: 0
I0508 09:47:09.494822 100378 cuda_util.cc:217] call cublasGemmStridedBatched sl: 8192 sr: 8192
场景三:[128, 12, 128, 128] * [128, 12, 128, 64] ,符合预期
I0508 09:47:09.495852 100378 cuda_util.cc:134] a1: 128
I0508 09:47:09.495857 100378 cuda_util.cc:135] a2: 12
I0508 09:47:09.495860 100378 cuda_util.cc:136] a3: 128
I0508 09:47:09.495862 100378 cuda_util.cc:137] a4: 128
I0508 09:47:09.495865 100378 cuda_util.cc:138] b1: 128
I0508 09:47:09.495867 100378 cuda_util.cc:139] b2: 12
I0508 09:47:09.495870 100378 cuda_util.cc:140] b3: 128
I0508 09:47:09.495872 100378 cuda_util.cc:141] b4: 64
I0508 09:47:09.495874 100378 cuda_util.cc:142] trans_a: 0
I0508 09:47:09.495877 100378 cuda_util.cc:143] trans_b: 0
I0508 09:47:09.495879 100378 cuda_util.cc:144] trans_o: 0
I0508 09:47:09.495882 100378 cuda_util.cc:217] call cublasGemmStridedBatched sl: 8192 sr: 16384
五、优化思路
5.1 最小复现样例
根据 Bert 里的模型结构抽离了最小代码case:
#!/usr/bin/env python3
# Please set "export PYTHONPATH=${CINN_ROOT}/build/python:${PYTHONPATH}" first
import paddle
import unittest
import numpy as np
import cinn
from cinn.frontend import *
from cinn.common import *
from op_test import OpTest

class TestGroup(unittest.TestCase):
  def test_group(self):
    builder = NetBuilder("matmul")
    x_shape = [128, 128, 768]
    y_shape = [768, 768]

    x = builder.create_input(Float16(),x_shape, "x")
    y = builder.create_input(Float16(), y_shape, "y")
    out = builder.matmul(
            x, y, transpose_x=False, transpose_y=False)

    feed_list = [x, y]
    fetch_list = [out]

    prog = builder.build()

    feed_data = [OpTest.random(shape=var.shape(), dtype=var.type()) for var in feed_list]
    result = prog.build_and_get_output(DefaultNVGPUTarget(), feed_list, feed_data, fetch_list)

    result = [res.numpy(DefaultNVGPUTarget()) for res in result]
    for i in range(len(result)):
      info_str = fetch_list[i].name()
      info_str += ", shape=" + str(result[i].shape)
      info_str += ", dtype=" + str(result[i].dtype) + ":\n"
      print(info_str)


if __name__ == "__main__":
  unittest.main()
5.2 修复 PR
修复思路,是参考主框架将其 y_batch_size=1 && trans_a = False 分支逻辑迁移到CINN中,见 PR:https://github.com/PaddlePaddle/CINN/pull/1407
5.3 收益测试
在 B 机器上测试 Bert 训练的收益:「无明显收益」。借助Nsight工具跑出了 timeline,经过分析发现「GPU空白依旧存在」。

5.4 咨询Nvidia同学
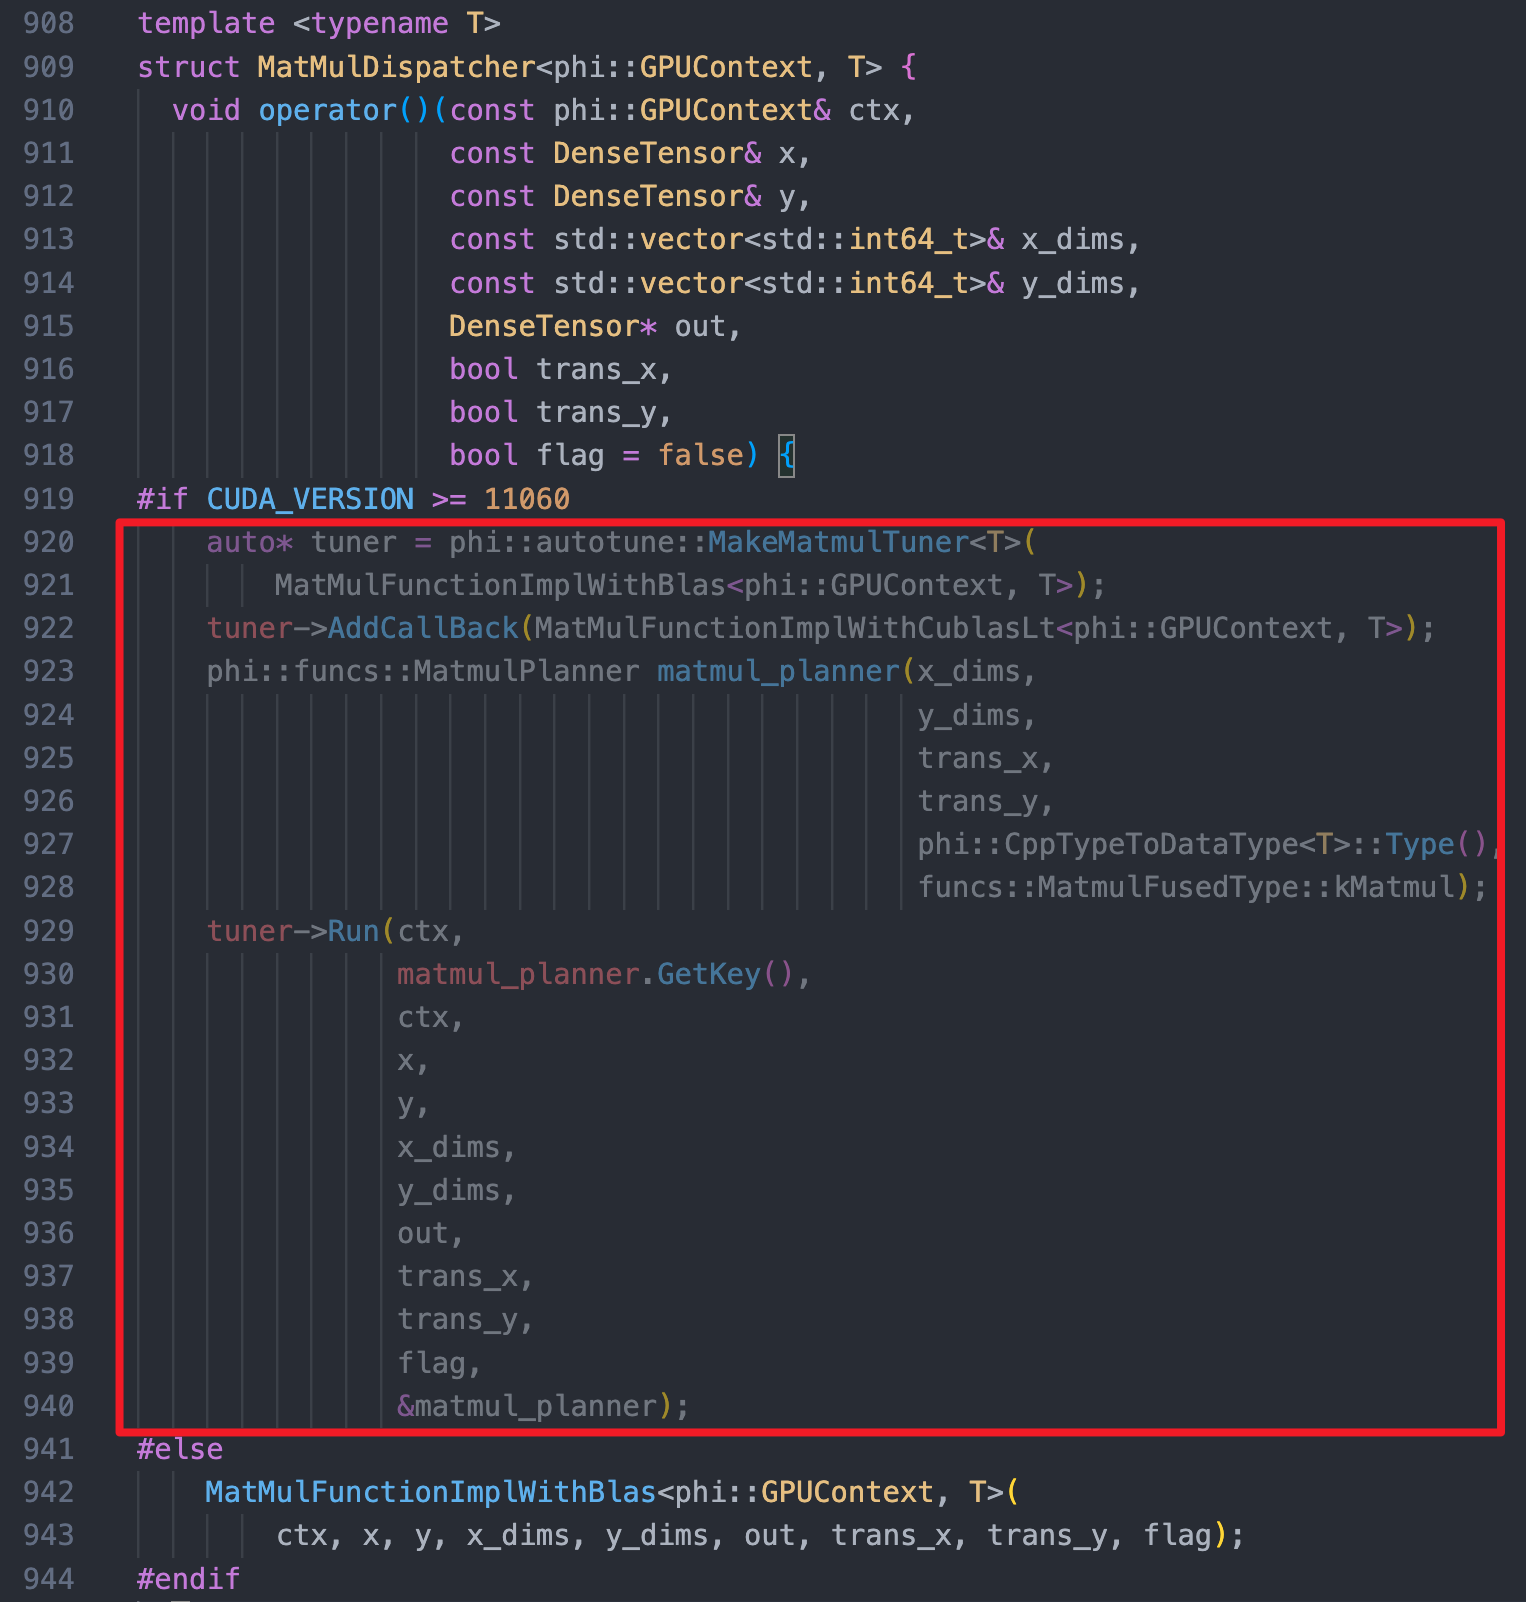
咨询了英伟达的同学,反馈说:「 cuBLAS 第一次將kernel 加載進內存,所以時間較長」,反馈主框架中引入了cublaslt,同时对api 内的deacriptor 创建进行了cache操作,可能有用,但CINN中是没有这个机制的。
要解决这个问题,可以参考主框架实现 AutoTune + Cache 机制:

 浙公网安备 33010602011771号