

7-Pandas的基本绘图函数之自定义图标样式
一、绘制子图----参数subplots
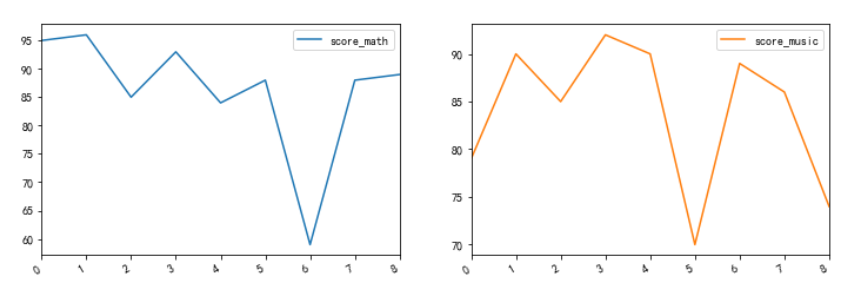
方法一:设置参数subplots = True即可自动创建子图,可通过参数layout来设置子图布局
df.plot(subplots=True,layout=(1,2),figsize=(12,4))
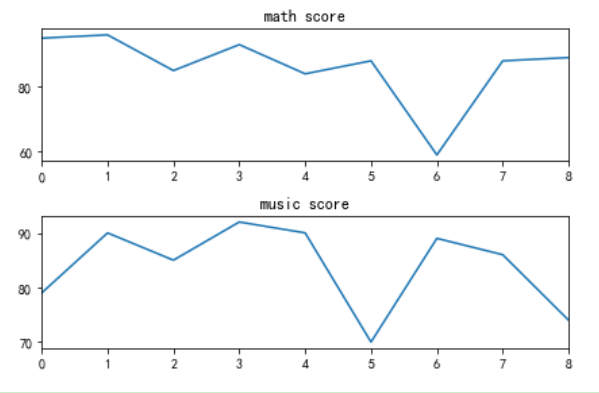
方法二:使用Matplotlib的方法,即plt.subbplots(nrows=2,ncols=2)或plt.subplot(2,2)
使用tight_layout()自动调整子图间距以免文字重叠
fig,axes = plt.subplots(2,1)
df['score_math'].plot(ax=axes[0])
axes[0].set_title('math score')

df['score_music'].plot(ax=axes[1])
axes[1].set_title('music score')

#自动调整子图间距,以免重叠
plt.tight_layout()
二、调整坐标轴
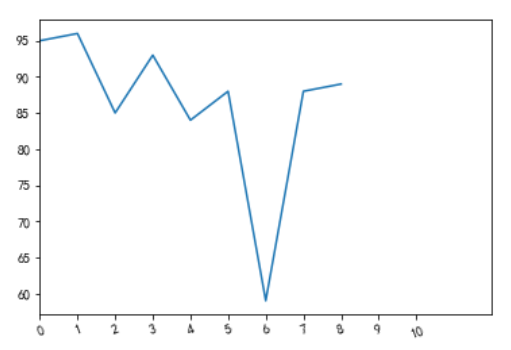
参数xticks设置主刻度标签,xlim设置坐标轴范围,y轴与x轴相同,如下:
plt.xticks()、plt.xlim()或
df['score_math'].plot(xticks=[0,1,2,3,4,5,6,7,8,9,10],rot=20,xlim=(0,12))
三、添加背景网格
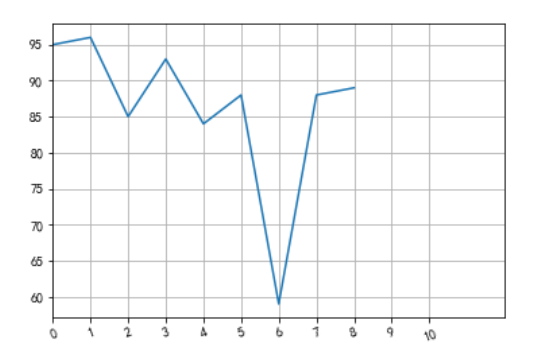
使用grid参数参加背景网格
df['score_math'].plot(xticks=[0,1,2,3,4,5,6,7,8,9,10],rot=20,xlim=(0,12))
plt.grid()
#或者
df['score_math'].plot(xticks=[0,1,2,3,4,5,6,7,8,9,10],rot=20,xlim=(0,12),grid=True)
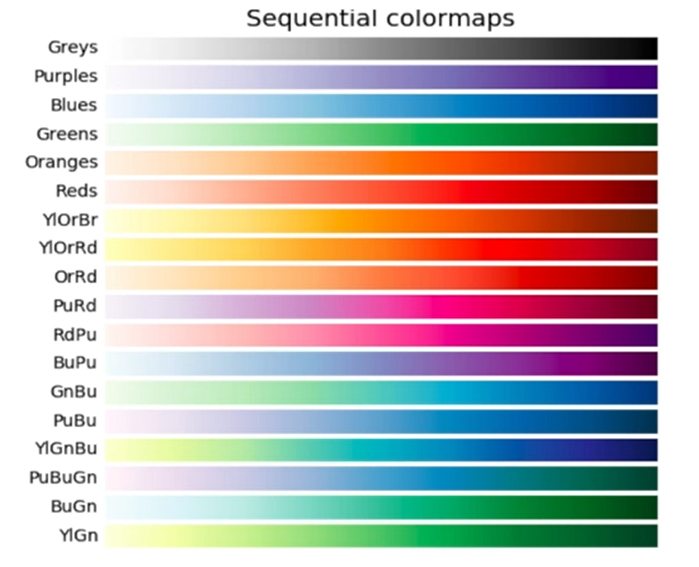
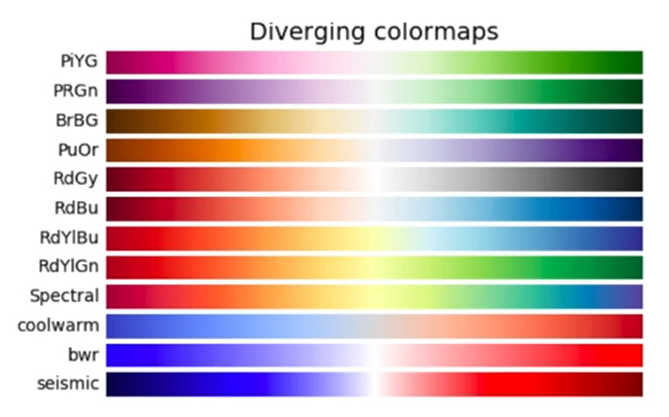
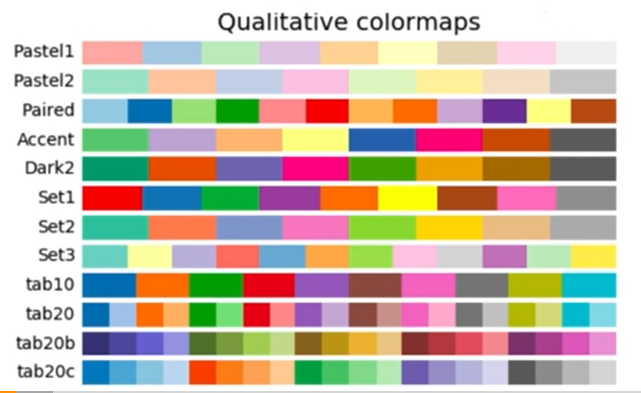
四、colormap
参数colormap传入Matplotlib内置色图的名称,即可设置不同的颜色
df.plot(colormap='Set3')


 浙公网安备 33010602011771号