两款基于Jquery的图表插件
一、EasyPieChart
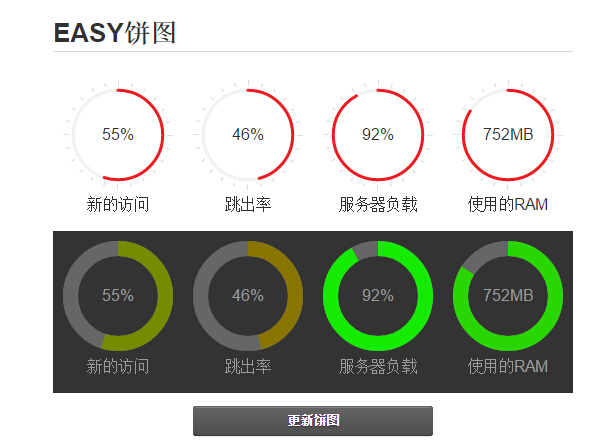
页面加载时,运行initPieChart()函数,调用easyPieChart()函数,显示出图表。
代码:
         var initPieChart = function() {
                $('.percentage').easyPieChart({
                    animate: 1000
                });
                $('.percentage-light').easyPieChart({
                    barColor: function(percent) {
                        percent /= 100;
                        return "rgb(" + Math.round(255 * (1-percent)) + ", " + Math.round(255 * percent) + ", 0)";
                    },
                    trackColor: '#666',
                    scaleColor: false,
                    lineCap: 'butt',
                    lineWidth: 15,
                    animate: 1000
                });
运行效果:根据不同的百分比,显示不同颜色的图表。
Demo下载地址:http://pan.baidu.com/s/1m4146
二、jQuery-Visualize
主要基于以下代码,不同的代码显示的效果也不同,可根据需要显示折线图、饼图、表格等,还可以显示总计(Total)。
$('table').visualize()
Demo下载地址:http://pan.baidu.com/s/1xZM26

 浙公网安备 33010602011771号