


第12章 决策树
12-1 什么是决策树
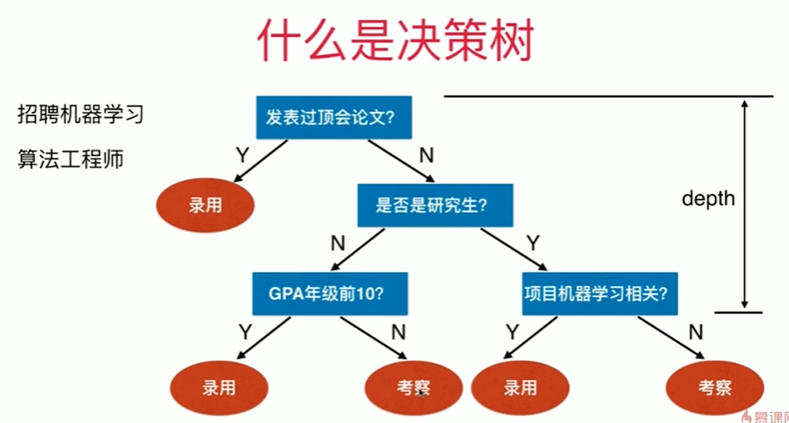
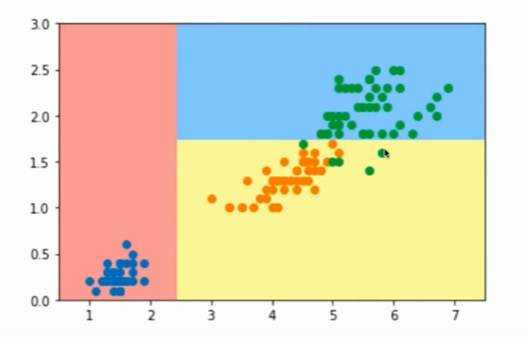
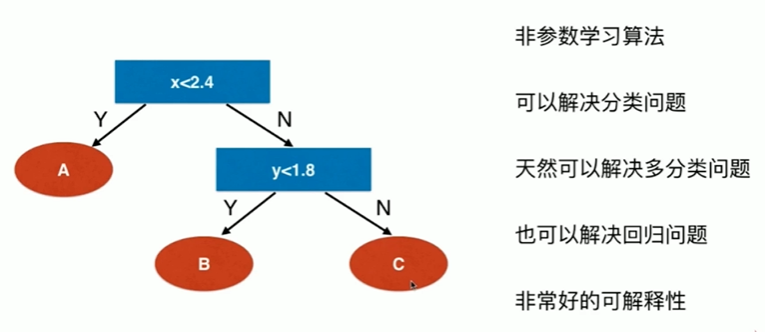

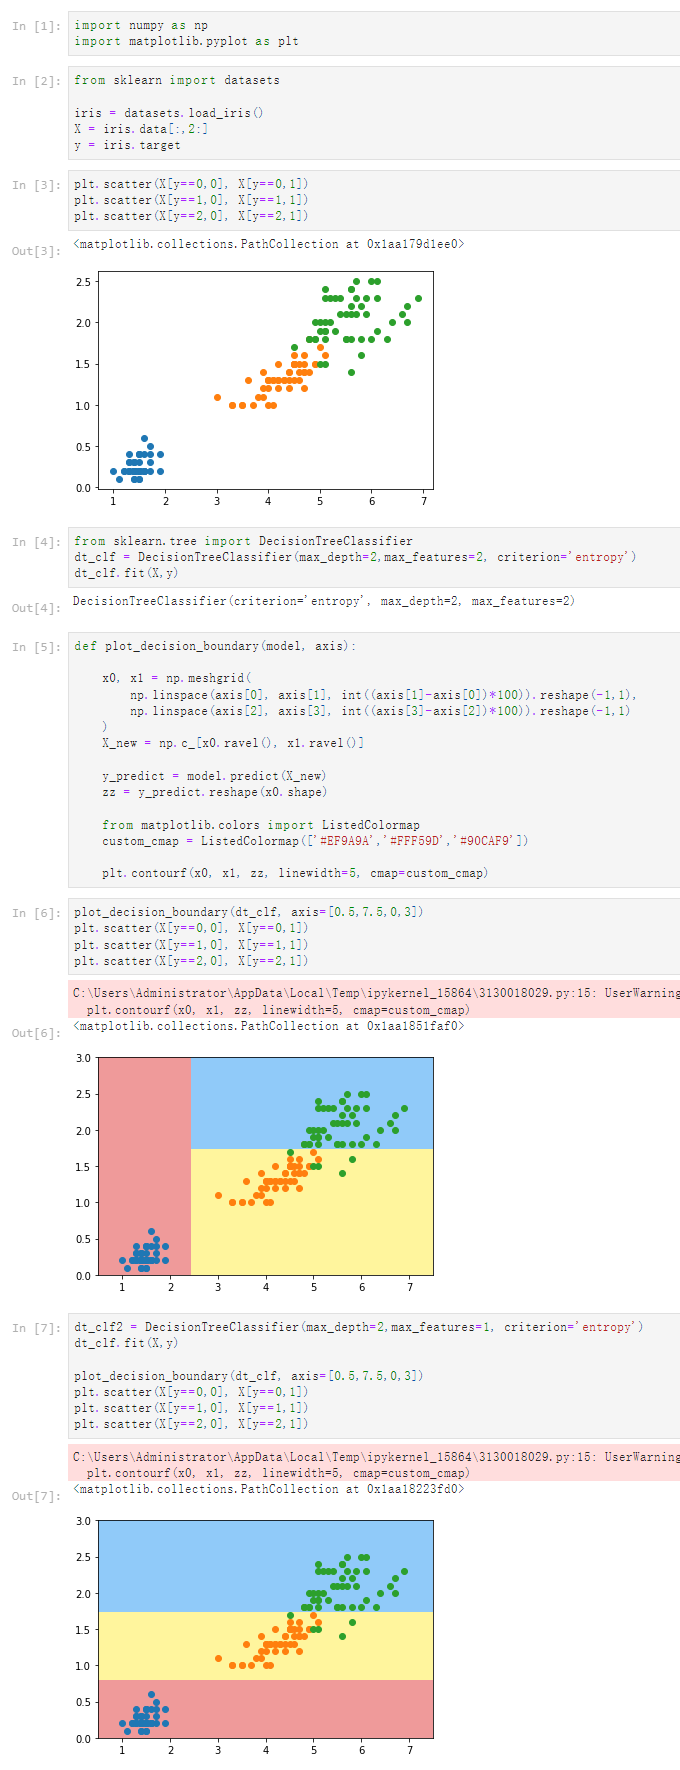
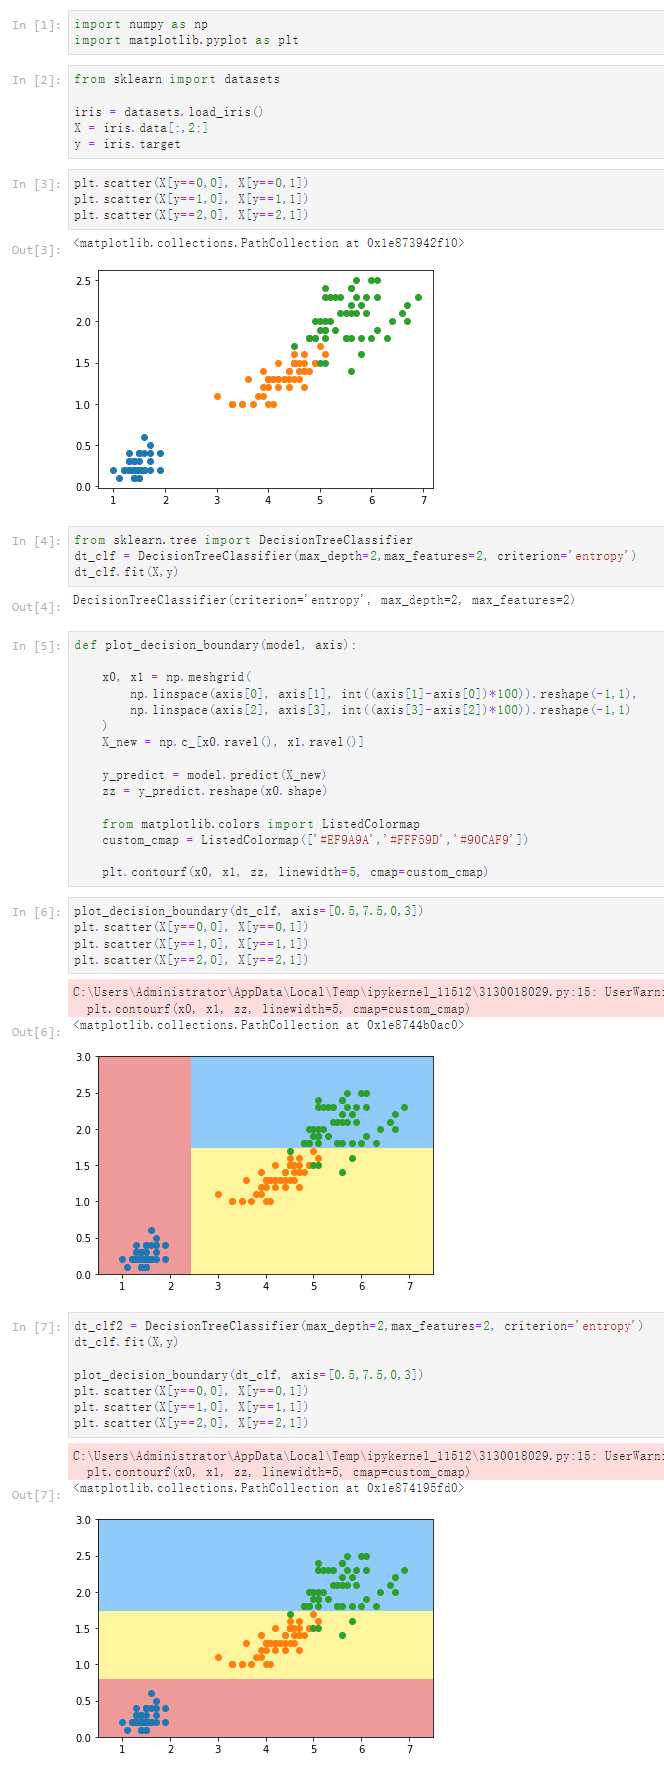
Notbook 示例
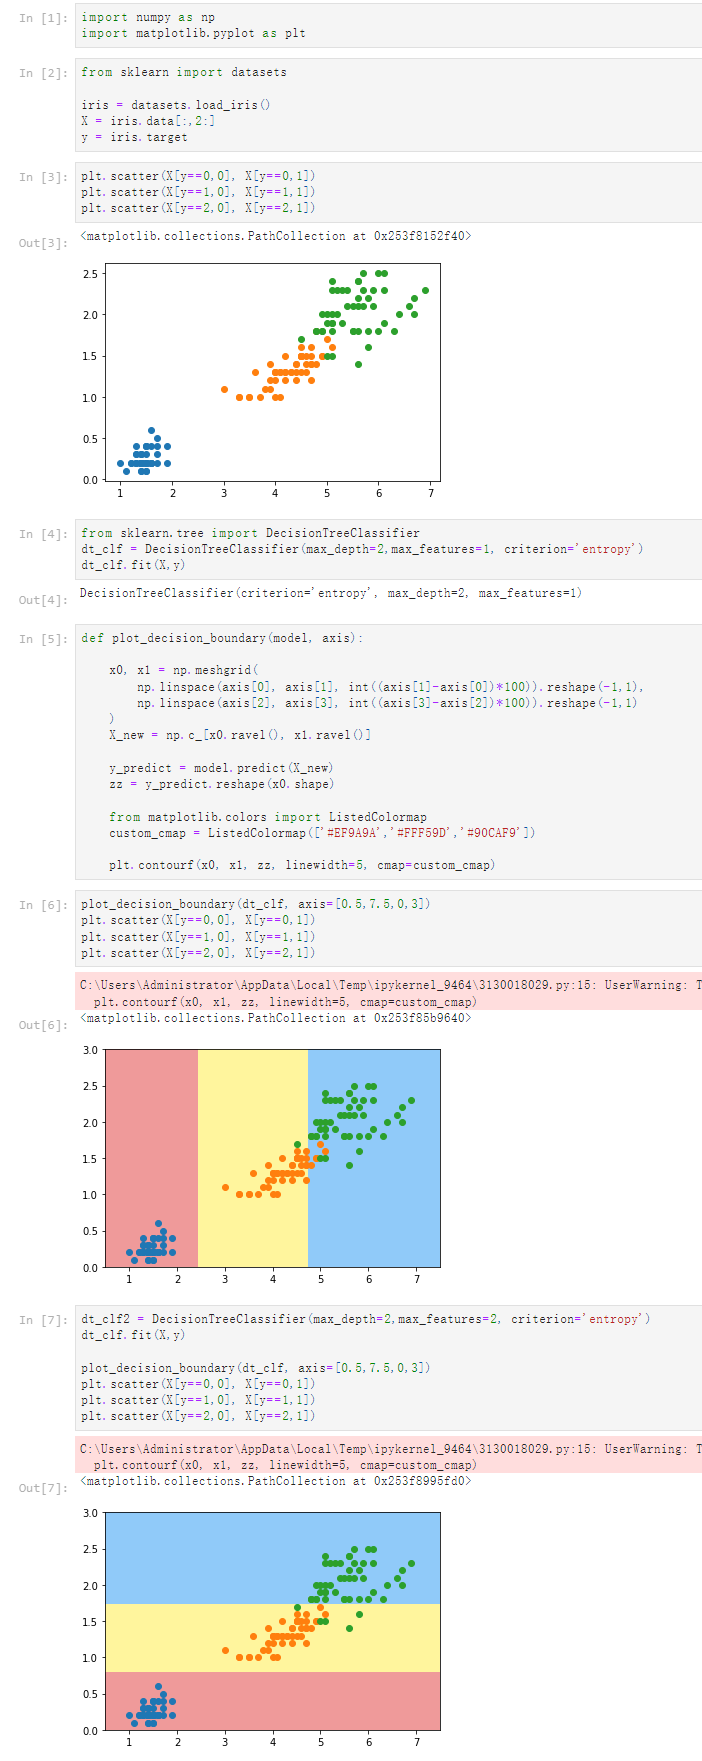
疑问:改变max_features 的值,图像具有一定随机性
notbook 源码
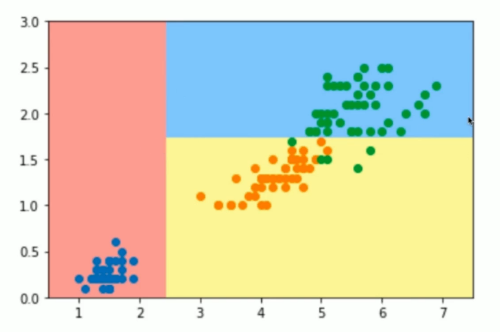
 1 [1]
 2 import numpy as np
 3 import matplotlib.pyplot as plt
 4 [2]
 5 from sklearn import datasets
 6
 7 iris = datasets.load_iris()
 8 X = iris.data[:,2:]
 9 y = iris.target
10 [3]
11 plt.scatter(X[y==0,0], X[y==0,1])
12 plt.scatter(X[y==1,0], X[y==1,1])
13 plt.scatter(X[y==2,0], X[y==2,1])
14 <matplotlib.collections.PathCollection at 0x2728e9a1ee0>
15
16 [4]
17 from sklearn.tree import DecisionTreeClassifier
18 dt_clf = DecisionTreeClassifier(max_depth=2,max_features=2, criterion='entropy')
19 dt_clf.fit(X,y)
20 DecisionTreeClassifier(criterion='entropy', max_depth=2, max_features=2)
21 [5]
22 def plot_decision_boundary(model, axis):
23
24     x0, x1 = np.meshgrid(
25         np.linspace(axis[0], axis[1], int((axis[1]-axis[0])*100)).reshape(-1,1),
26         np.linspace(axis[2], axis[3], int((axis[3]-axis[2])*100)).reshape(-1,1)
27     )
28     X_new = np.c_[x0.ravel(), x1.ravel()]
29
30     y_predict = model.predict(X_new)
31     zz = y_predict.reshape(x0.shape)
32
33     from matplotlib.colors import ListedColormap
34     custom_cmap = ListedColormap(['#EF9A9A','#FFF59D','#90CAF9'])
35
36     plt.contourf(x0, x1, zz, linewidth=5, cmap=custom_cmap)
37 [6]
38 plot_decision_boundary(dt_clf, axis=[0.5,7.5,0,3])
39 plt.scatter(X[y==0,0], X[y==0,1])
40 plt.scatter(X[y==1,0], X[y==1,1])
41 plt.scatter(X[y==2,0], X[y==2,1])
42 C:\Users\Administrator\AppData\Local\Temp\ipykernel_15136\3130018029.py:15: UserWarning: The following kwargs were not used by contour: 'linewidth'
43   plt.contourf(x0, x1, zz, linewidth=5, cmap=custom_cmap)
44
45 <matplotlib.collections.PathCollection at 0x2728f874df0>
46
47 [7]
48 dt_clf2 = DecisionTreeClassifier(max_depth=2,max_features=1, criterion='entropy')
49 dt_clf.fit(X,y)
50
51 plot_decision_boundary(dt_clf, axis=[0.5,7.5,0,3])
52 plt.scatter(X[y==0,0], X[y==0,1])
53 plt.scatter(X[y==1,0], X[y==1,1])
54 plt.scatter(X[y==2,0], X[y==2,1])
55 C:\Users\Administrator\AppData\Local\Temp\ipykernel_15136\3130018029.py:15: UserWarning: The following kwargs were not used by contour: 'linewidth'
56   plt.contourf(x0, x1, zz, linewidth=5, cmap=custom_cmap)
57
58 <matplotlib.collections.PathCollection at 0x2728f2036a0>
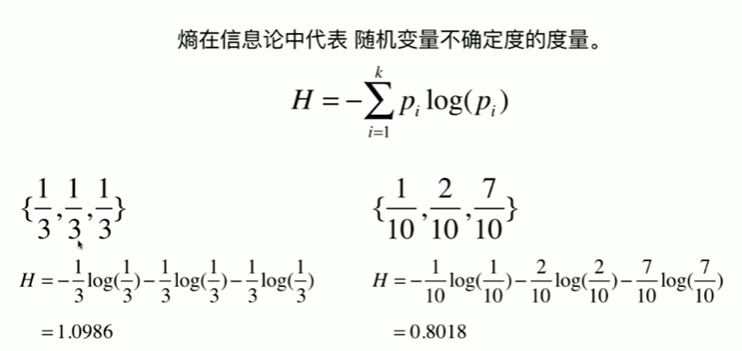
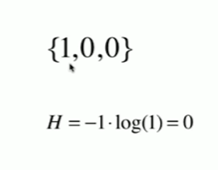
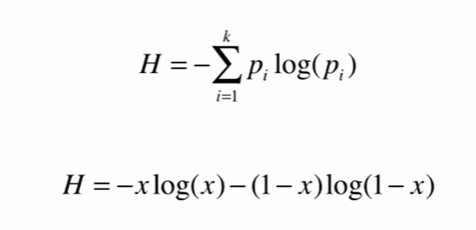
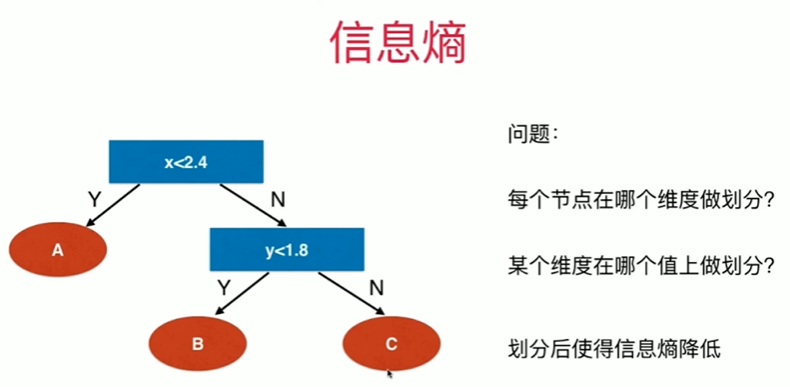
12-2 信息熵


Notbook 示例
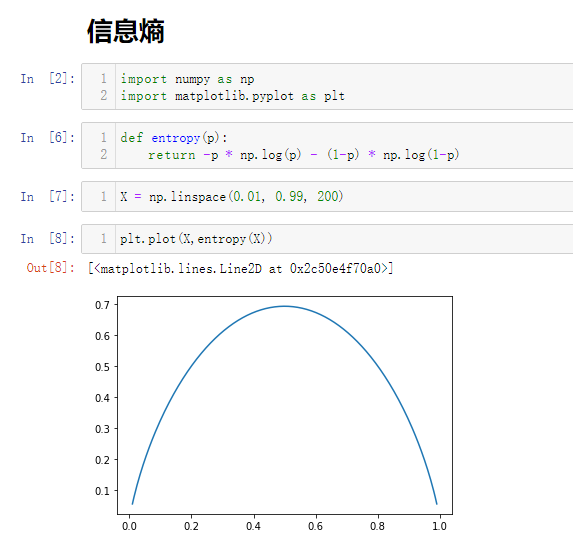
Notbook 源码
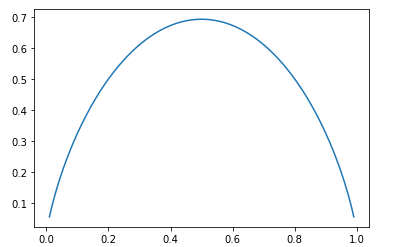
 1 信息熵
 2 [2]
 3 import numpy as np
 4 import matplotlib.pyplot as plt
 5 [6]
 6 def entropy(p):
 7     return -p * np.log(p) - (1-p) * np.log(1-p)
 8 [7]
 9 X = np.linspace(0.01, 0.99, 200)
10 [8]
11 plt.plot(X,entropy(X))
12 [<matplotlib.lines.Line2D at 0x2c50e4f70a0>]
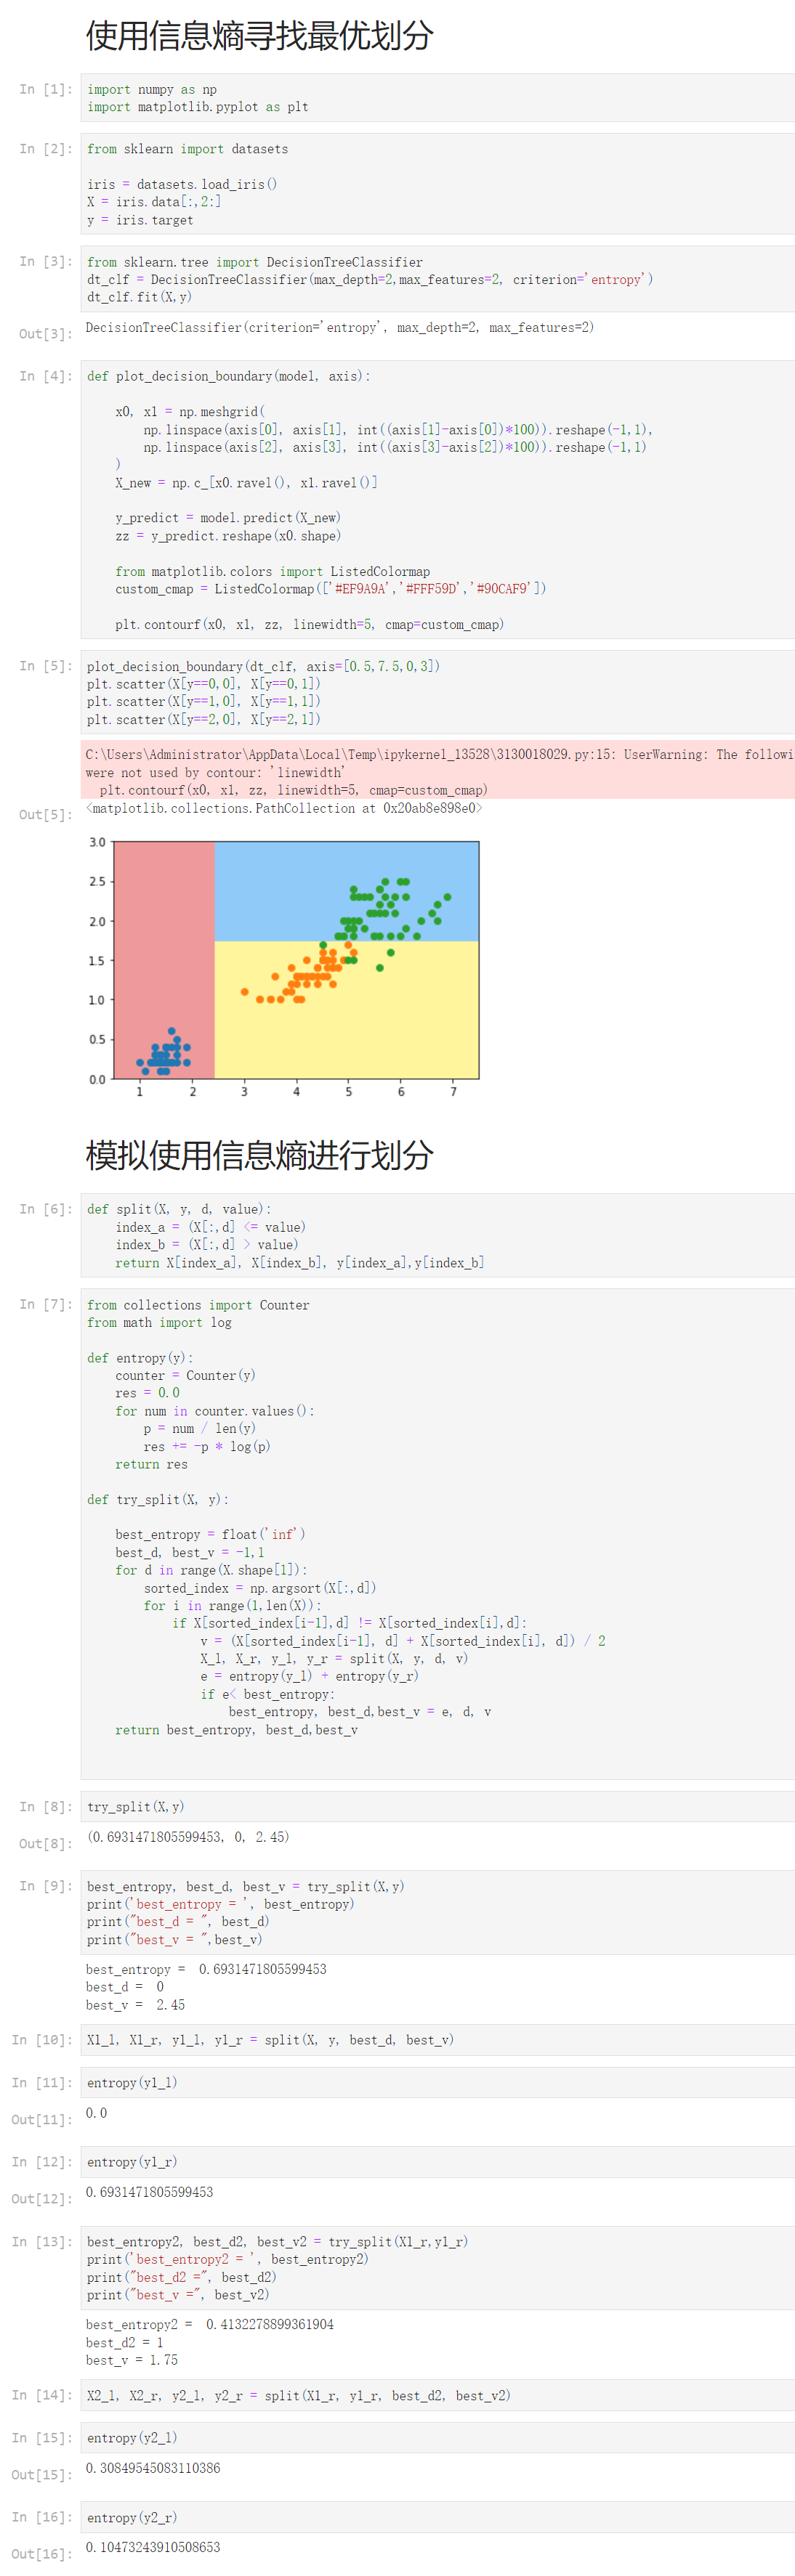
12-3 使用信息熵寻找最优划分
Notbook 示例
Notbook 源码
  1 使用信息熵寻找最优划分
  2 [1]
  3 import numpy as np
  4 import matplotlib.pyplot as plt
  5 [2]
  6 from sklearn import datasets
  7
  8 iris = datasets.load_iris()
  9 X = iris.data[:,2:]
 10 y = iris.target
 11 [3]
 12 from sklearn.tree import DecisionTreeClassifier
 13 dt_clf = DecisionTreeClassifier(max_depth=2,max_features=2, criterion='entropy')
 14 dt_clf.fit(X,y)
 15 DecisionTreeClassifier(criterion='entropy', max_depth=2, max_features=2)
 16 [4]
 17 def plot_decision_boundary(model, axis):
 18
 19     x0, x1 = np.meshgrid(
 20         np.linspace(axis[0], axis[1], int((axis[1]-axis[0])*100)).reshape(-1,1),
 21         np.linspace(axis[2], axis[3], int((axis[3]-axis[2])*100)).reshape(-1,1)
 22     )
 23     X_new = np.c_[x0.ravel(), x1.ravel()]
 24
 25     y_predict = model.predict(X_new)
 26     zz = y_predict.reshape(x0.shape)
 27
 28     from matplotlib.colors import ListedColormap
 29     custom_cmap = ListedColormap(['#EF9A9A','#FFF59D','#90CAF9'])
 30
 31     plt.contourf(x0, x1, zz, linewidth=5, cmap=custom_cmap)
 32 [5]
 33 plot_decision_boundary(dt_clf, axis=[0.5,7.5,0,3])
 34 plt.scatter(X[y==0,0], X[y==0,1])
 35 plt.scatter(X[y==1,0], X[y==1,1])
 36 plt.scatter(X[y==2,0], X[y==2,1])
 37 C:\Users\Administrator\AppData\Local\Temp\ipykernel_13528\3130018029.py:15: UserWarning: The following kwargs were not used by contour: 'linewidth'
 38   plt.contourf(x0, x1, zz, linewidth=5, cmap=custom_cmap)
 39
 40 <matplotlib.collections.PathCollection at 0x20ab8e898e0>
 41
 42 模拟使用信息熵进行划分
 43 [6]
 44 def split(X, y, d, value):
 45     index_a = (X[:,d] <= value)
 46     index_b = (X[:,d] > value)
 47     return X[index_a], X[index_b], y[index_a],y[index_b]
 48 [7]
 49 from collections import Counter
 50 from math import log
 51
 52 def entropy(y):
 53     counter = Counter(y)
 54     res = 0.0
 55     for num in counter.values():
 56         p = num / len(y)
 57         res += -p * log(p)
 58     return res
 59
 60 def try_split(X, y):
 61
 62     best_entropy = float('inf')
 63     best_d, best_v = -1,1
 64     for d in range(X.shape[1]):
 65         sorted_index = np.argsort(X[:,d])
 66         for i in range(1,len(X)):
 67             if X[sorted_index[i-1],d] != X[sorted_index[i],d]:
 68                 v = (X[sorted_index[i-1], d] + X[sorted_index[i], d]) / 2
 69                 X_l, X_r, y_l, y_r = split(X, y, d, v)
 70                 e = entropy(y_l) + entropy(y_r)
 71                 if e< best_entropy:
 72                     best_entropy, best_d,best_v = e, d, v
 73     return best_entropy, best_d,best_v
 74
 75
 76 [8]
 77 try_split(X,y)
 78 (0.6931471805599453, 0, 2.45)
 79 [9]
 80 best_entropy, best_d, best_v = try_split(X,y)
 81 print('best_entropy = ', best_entropy)
 82 print("best_d = ", best_d)
 83 print("best_v = ",best_v)
 84 best_entropy =  0.6931471805599453
 85 best_d =  0
 86 best_v =  2.45
 87
 88 [10]
 89 X1_l, X1_r, y1_l, y1_r = split(X, y, best_d, best_v)
 90 [11]
 91 entropy(y1_l)
 92 0.0
 93 [12]
 94 entropy(y1_r)
 95 0.6931471805599453
 96 [13]
 97 best_entropy2, best_d2, best_v2 = try_split(X1_r,y1_r)
 98 print('best_entropy2 = ', best_entropy2)
 99 print("best_d2 =", best_d2)
100 print("best_v =", best_v2)
101 best_entropy2 =  0.4132278899361904
102 best_d2 = 1
103 best_v = 1.75
104
105 [14]
106 X2_l, X2_r, y2_l, y2_r = split(X1_r, y1_r, best_d2, best_v2)
107 [15]
108 entropy(y2_l)
109 0.30849545083110386
110 [16]
111 entropy(y2_r)
112 0.10473243910508653
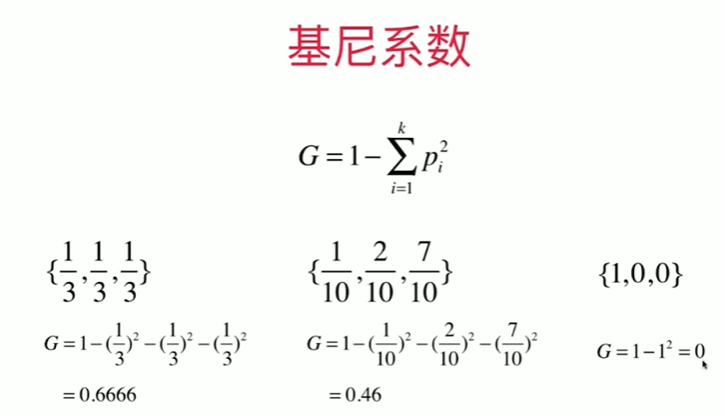
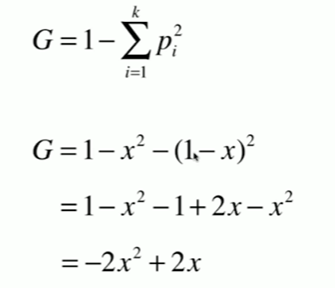
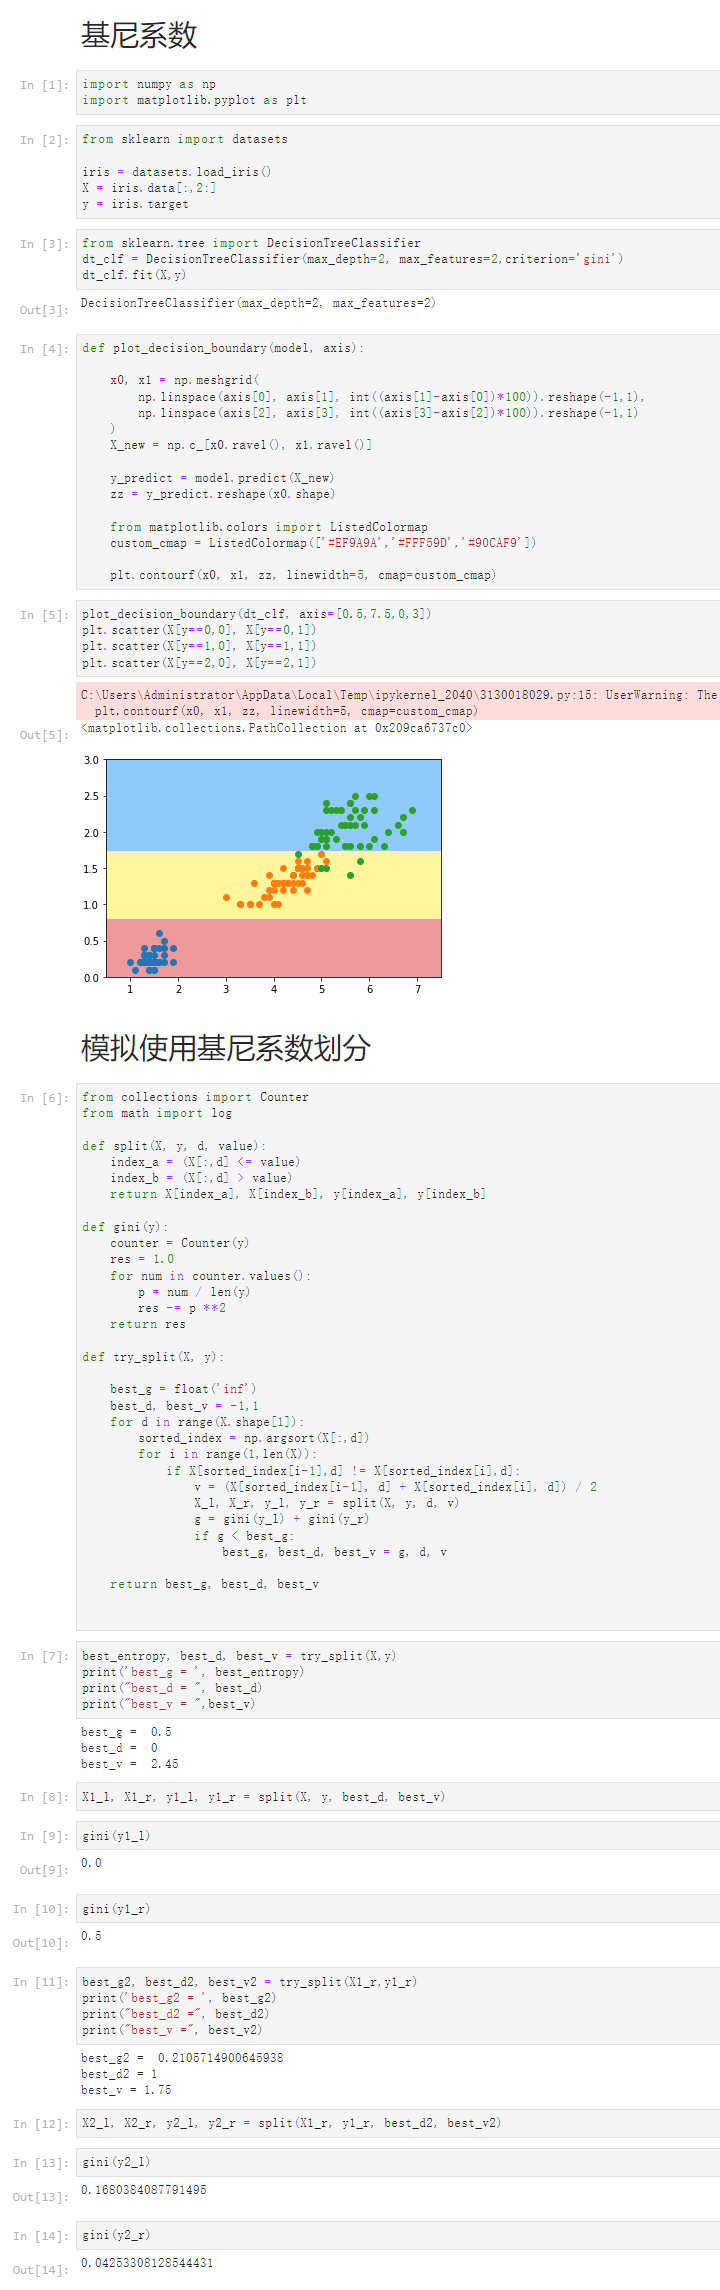
12-4 基尼系数


Notbook 示例
Notbook 源码
  1 基尼系数
  2 [1]
  3 import numpy as np
  4 import matplotlib.pyplot as plt
  5 [2]
  6 from sklearn import datasets
  7
  8 iris = datasets.load_iris()
  9 X = iris.data[:,2:]
 10 y = iris.target
 11 [3]
 12 from sklearn.tree import DecisionTreeClassifier
 13 dt_clf = DecisionTreeClassifier(max_depth=2, max_features=2,criterion='gini')
 14 dt_clf.fit(X,y)
 15 DecisionTreeClassifier(max_depth=2, max_features=2)
 16 [4]
 17 def plot_decision_boundary(model, axis):
 18
 19     x0, x1 = np.meshgrid(
 20         np.linspace(axis[0], axis[1], int((axis[1]-axis[0])*100)).reshape(-1,1),
 21         np.linspace(axis[2], axis[3], int((axis[3]-axis[2])*100)).reshape(-1,1)
 22     )
 23     X_new = np.c_[x0.ravel(), x1.ravel()]
 24
 25     y_predict = model.predict(X_new)
 26     zz = y_predict.reshape(x0.shape)
 27
 28     from matplotlib.colors import ListedColormap
 29     custom_cmap = ListedColormap(['#EF9A9A','#FFF59D','#90CAF9'])
 30
 31     plt.contourf(x0, x1, zz, linewidth=5, cmap=custom_cmap)
 32 [5]
 33 plot_decision_boundary(dt_clf, axis=[0.5,7.5,0,3])
 34 plt.scatter(X[y==0,0], X[y==0,1])
 35 plt.scatter(X[y==1,0], X[y==1,1])
 36 plt.scatter(X[y==2,0], X[y==2,1])
 37 C:\Users\Administrator\AppData\Local\Temp\ipykernel_2040\3130018029.py:15: UserWarning: The following kwargs were not used by contour: 'linewidth'
 38   plt.contourf(x0, x1, zz, linewidth=5, cmap=custom_cmap)
 39
 40 <matplotlib.collections.PathCollection at 0x209ca6737c0>
 41
 42 模拟使用基尼系数划分
 43 [6]
 44 from collections import Counter
 45 from math import log
 46
 47 def split(X, y, d, value):
 48     index_a = (X[:,d] <= value)
 49     index_b = (X[:,d] > value)
 50     return X[index_a], X[index_b], y[index_a], y[index_b]
 51
 52 def gini(y):
 53     counter = Counter(y)
 54     res = 1.0
 55     for num in counter.values():
 56         p = num / len(y)
 57         res -= p **2
 58     return res
 59
 60 def try_split(X, y):
 61
 62     best_g = float('inf')
 63     best_d, best_v = -1,1
 64     for d in range(X.shape[1]):
 65         sorted_index = np.argsort(X[:,d])
 66         for i in range(1,len(X)):
 67             if X[sorted_index[i-1],d] != X[sorted_index[i],d]:
 68                 v = (X[sorted_index[i-1], d] + X[sorted_index[i], d]) / 2
 69                 X_l, X_r, y_l, y_r = split(X, y, d, v)
 70                 g = gini(y_l) + gini(y_r)
 71                 if g < best_g:
 72                     best_g, best_d, best_v = g, d, v
 73
 74     return best_g, best_d, best_v
 75
 76
 77 [7]
 78 best_entropy, best_d, best_v = try_split(X,y)
 79 print('best_g = ', best_entropy)
 80 print("best_d = ", best_d)
 81 print("best_v = ",best_v)
 82 best_g =  0.5
 83 best_d =  0
 84 best_v =  2.45
 85
 86 [8]
 87 X1_l, X1_r, y1_l, y1_r = split(X, y, best_d, best_v)
 88 [9]
 89 gini(y1_l)
 90 0.0
 91 [10]
 92 gini(y1_r)
 93 0.5
 94 [11]
 95 best_g2, best_d2, best_v2 = try_split(X1_r,y1_r)
 96 print('best_g2 = ', best_g2)
 97 print("best_d2 =", best_d2)
 98 print("best_v =", best_v2)
 99 best_g2 =  0.2105714900645938
100 best_d2 = 1
101 best_v = 1.75
102
103 [12]
104 X2_l, X2_r, y2_l, y2_r = split(X1_r, y1_r, best_d2, best_v2)
105 [13]
106 gini(y2_l)
107 0.1680384087791495
108 [14]
109 gini(y2_r)
110 0.04253308128544431
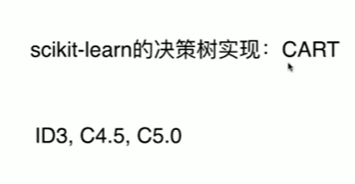
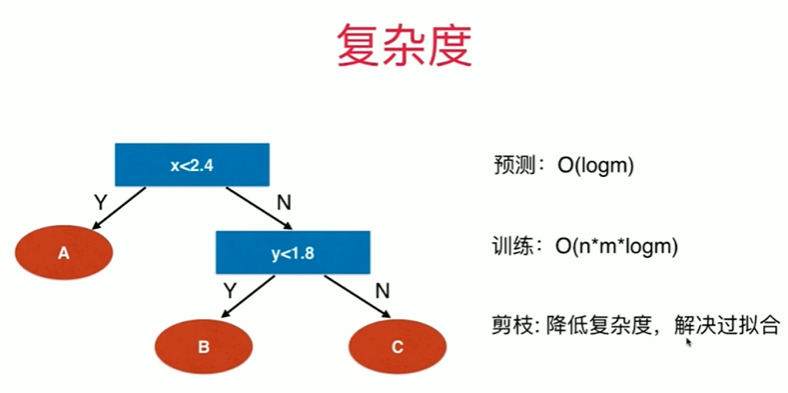
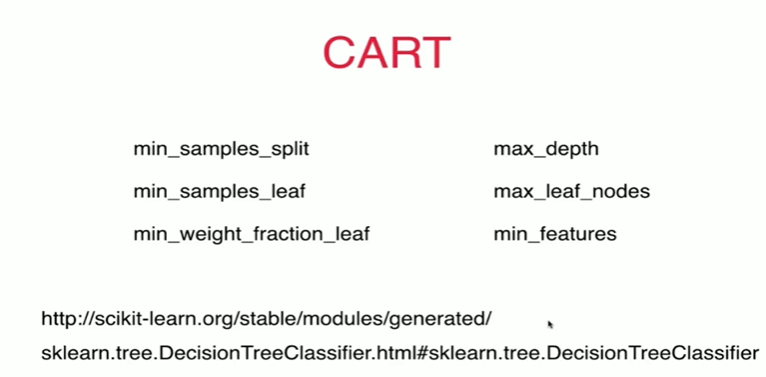
12-5 CART与决策树中的超参数

Notbook 示例
Notbook 源码
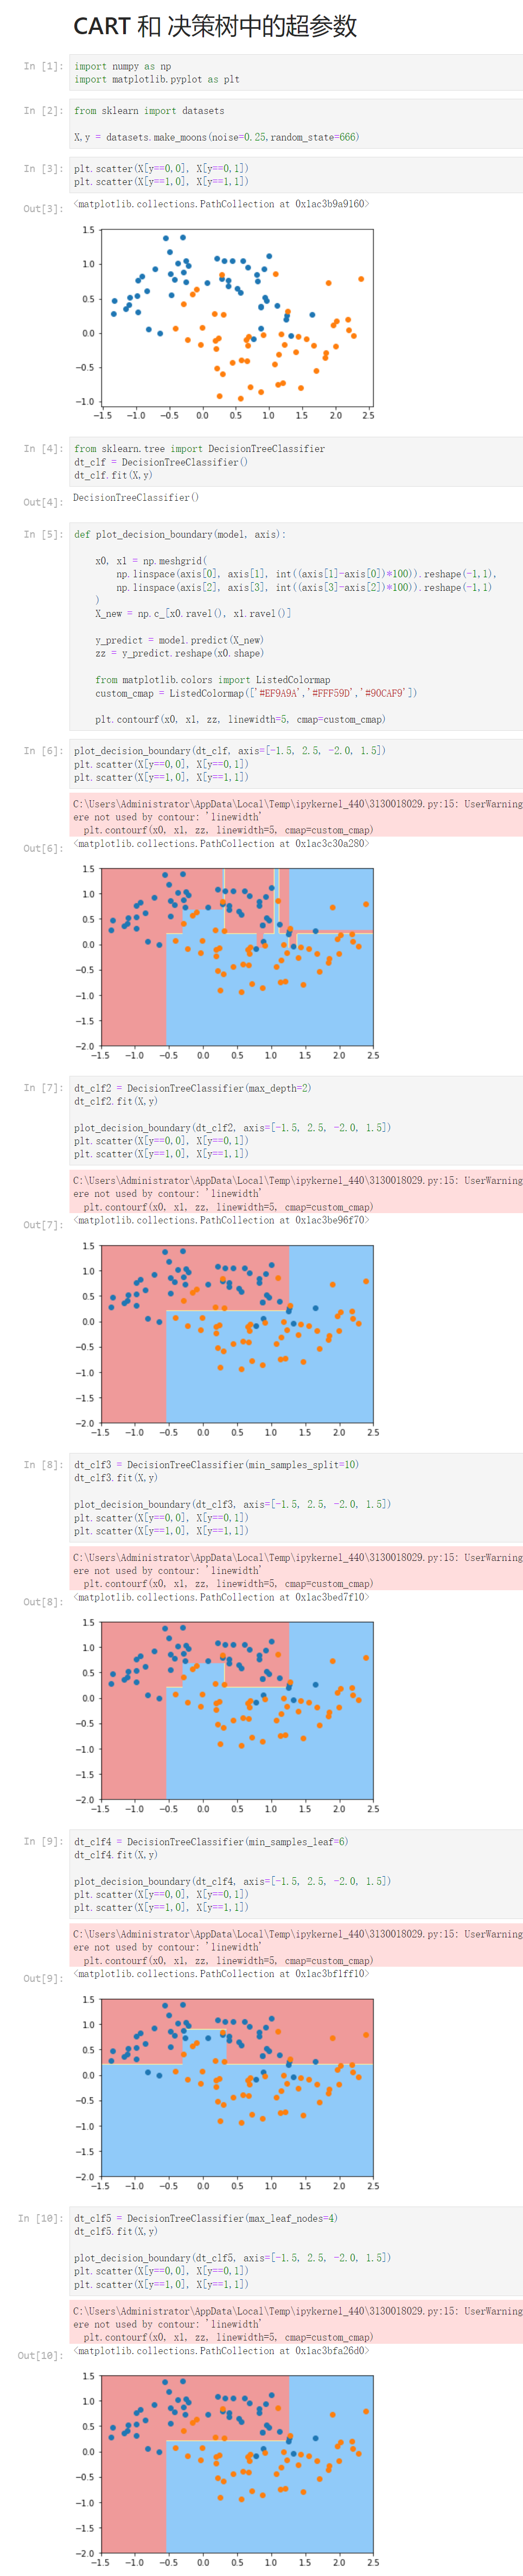
 1 CART 和 决策树中的超参数
 2 [1]
 3 import numpy as np
 4 import matplotlib.pyplot as plt
 5 [2]
 6 from sklearn import datasets
 7
 8 X,y = datasets.make_moons(noise=0.25,random_state=666)
 9 [3]
10 plt.scatter(X[y==0,0], X[y==0,1])
11 plt.scatter(X[y==1,0], X[y==1,1])
12 <matplotlib.collections.PathCollection at 0x1ac3b9a9160>
13
14 [4]
15 from sklearn.tree import DecisionTreeClassifier
16 dt_clf = DecisionTreeClassifier()
17 dt_clf.fit(X,y)
18 DecisionTreeClassifier()
19 [5]
20 def plot_decision_boundary(model, axis):
21
22     x0, x1 = np.meshgrid(
23         np.linspace(axis[0], axis[1], int((axis[1]-axis[0])*100)).reshape(-1,1),
24         np.linspace(axis[2], axis[3], int((axis[3]-axis[2])*100)).reshape(-1,1)
25     )
26     X_new = np.c_[x0.ravel(), x1.ravel()]
27
28     y_predict = model.predict(X_new)
29     zz = y_predict.reshape(x0.shape)
30
31     from matplotlib.colors import ListedColormap
32     custom_cmap = ListedColormap(['#EF9A9A','#FFF59D','#90CAF9'])
33
34     plt.contourf(x0, x1, zz, linewidth=5, cmap=custom_cmap)
35 [6]
36 plot_decision_boundary(dt_clf, axis=[-1.5, 2.5, -2.0, 1.5])
37 plt.scatter(X[y==0,0], X[y==0,1])
38 plt.scatter(X[y==1,0], X[y==1,1])
39 C:\Users\Administrator\AppData\Local\Temp\ipykernel_440\3130018029.py:15: UserWarning: The following kwargs were not used by contour: 'linewidth'
40   plt.contourf(x0, x1, zz, linewidth=5, cmap=custom_cmap)
41
42 <matplotlib.collections.PathCollection at 0x1ac3c30a280>
43
44 [7]
45 dt_clf2 = DecisionTreeClassifier(max_depth=2)
46 dt_clf2.fit(X,y)
47
48 plot_decision_boundary(dt_clf2, axis=[-1.5, 2.5, -2.0, 1.5])
49 plt.scatter(X[y==0,0], X[y==0,1])
50 plt.scatter(X[y==1,0], X[y==1,1])
51 C:\Users\Administrator\AppData\Local\Temp\ipykernel_440\3130018029.py:15: UserWarning: The following kwargs were not used by contour: 'linewidth'
52   plt.contourf(x0, x1, zz, linewidth=5, cmap=custom_cmap)
53
54 <matplotlib.collections.PathCollection at 0x1ac3be96f70>
55
56 [8]
57 dt_clf3 = DecisionTreeClassifier(min_samples_split=10)
58 dt_clf3.fit(X,y)
59
60 plot_decision_boundary(dt_clf3, axis=[-1.5, 2.5, -2.0, 1.5])
61 plt.scatter(X[y==0,0], X[y==0,1])
62 plt.scatter(X[y==1,0], X[y==1,1])
63 C:\Users\Administrator\AppData\Local\Temp\ipykernel_440\3130018029.py:15: UserWarning: The following kwargs were not used by contour: 'linewidth'
64   plt.contourf(x0, x1, zz, linewidth=5, cmap=custom_cmap)
65
66 <matplotlib.collections.PathCollection at 0x1ac3bed7f10>
67
68 [9]
69 dt_clf4 = DecisionTreeClassifier(min_samples_leaf=6)
70 dt_clf4.fit(X,y)
71
72 plot_decision_boundary(dt_clf4, axis=[-1.5, 2.5, -2.0, 1.5])
73 plt.scatter(X[y==0,0], X[y==0,1])
74 plt.scatter(X[y==1,0], X[y==1,1])
75 C:\Users\Administrator\AppData\Local\Temp\ipykernel_440\3130018029.py:15: UserWarning: The following kwargs were not used by contour: 'linewidth'
76   plt.contourf(x0, x1, zz, linewidth=5, cmap=custom_cmap)
77
78 <matplotlib.collections.PathCollection at 0x1ac3bf1ff10>
79
80 [10]
81 dt_clf5 = DecisionTreeClassifier(max_leaf_nodes=4)
82 dt_clf5.fit(X,y)
83
84 plot_decision_boundary(dt_clf5, axis=[-1.5, 2.5, -2.0, 1.5])
85 plt.scatter(X[y==0,0], X[y==0,1])
86 plt.scatter(X[y==1,0], X[y==1,1])
87 C:\Users\Administrator\AppData\Local\Temp\ipykernel_440\3130018029.py:15: UserWarning: The following kwargs were not used by contour: 'linewidth'
88   plt.contourf(x0, x1, zz, linewidth=5, cmap=custom_cmap)
89
90 <matplotlib.collections.PathCollection at 0x1ac3bfa26d0>
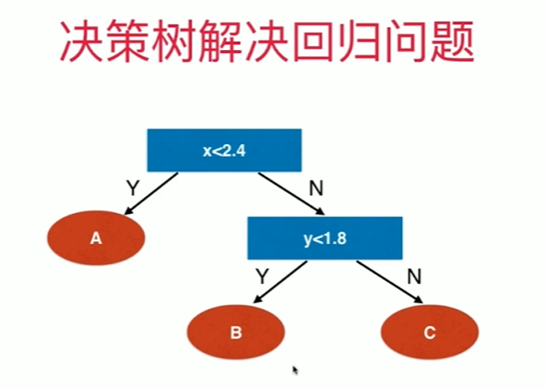
12-6 决策树解决回归问题

Notbook 示例
Notbook 源码
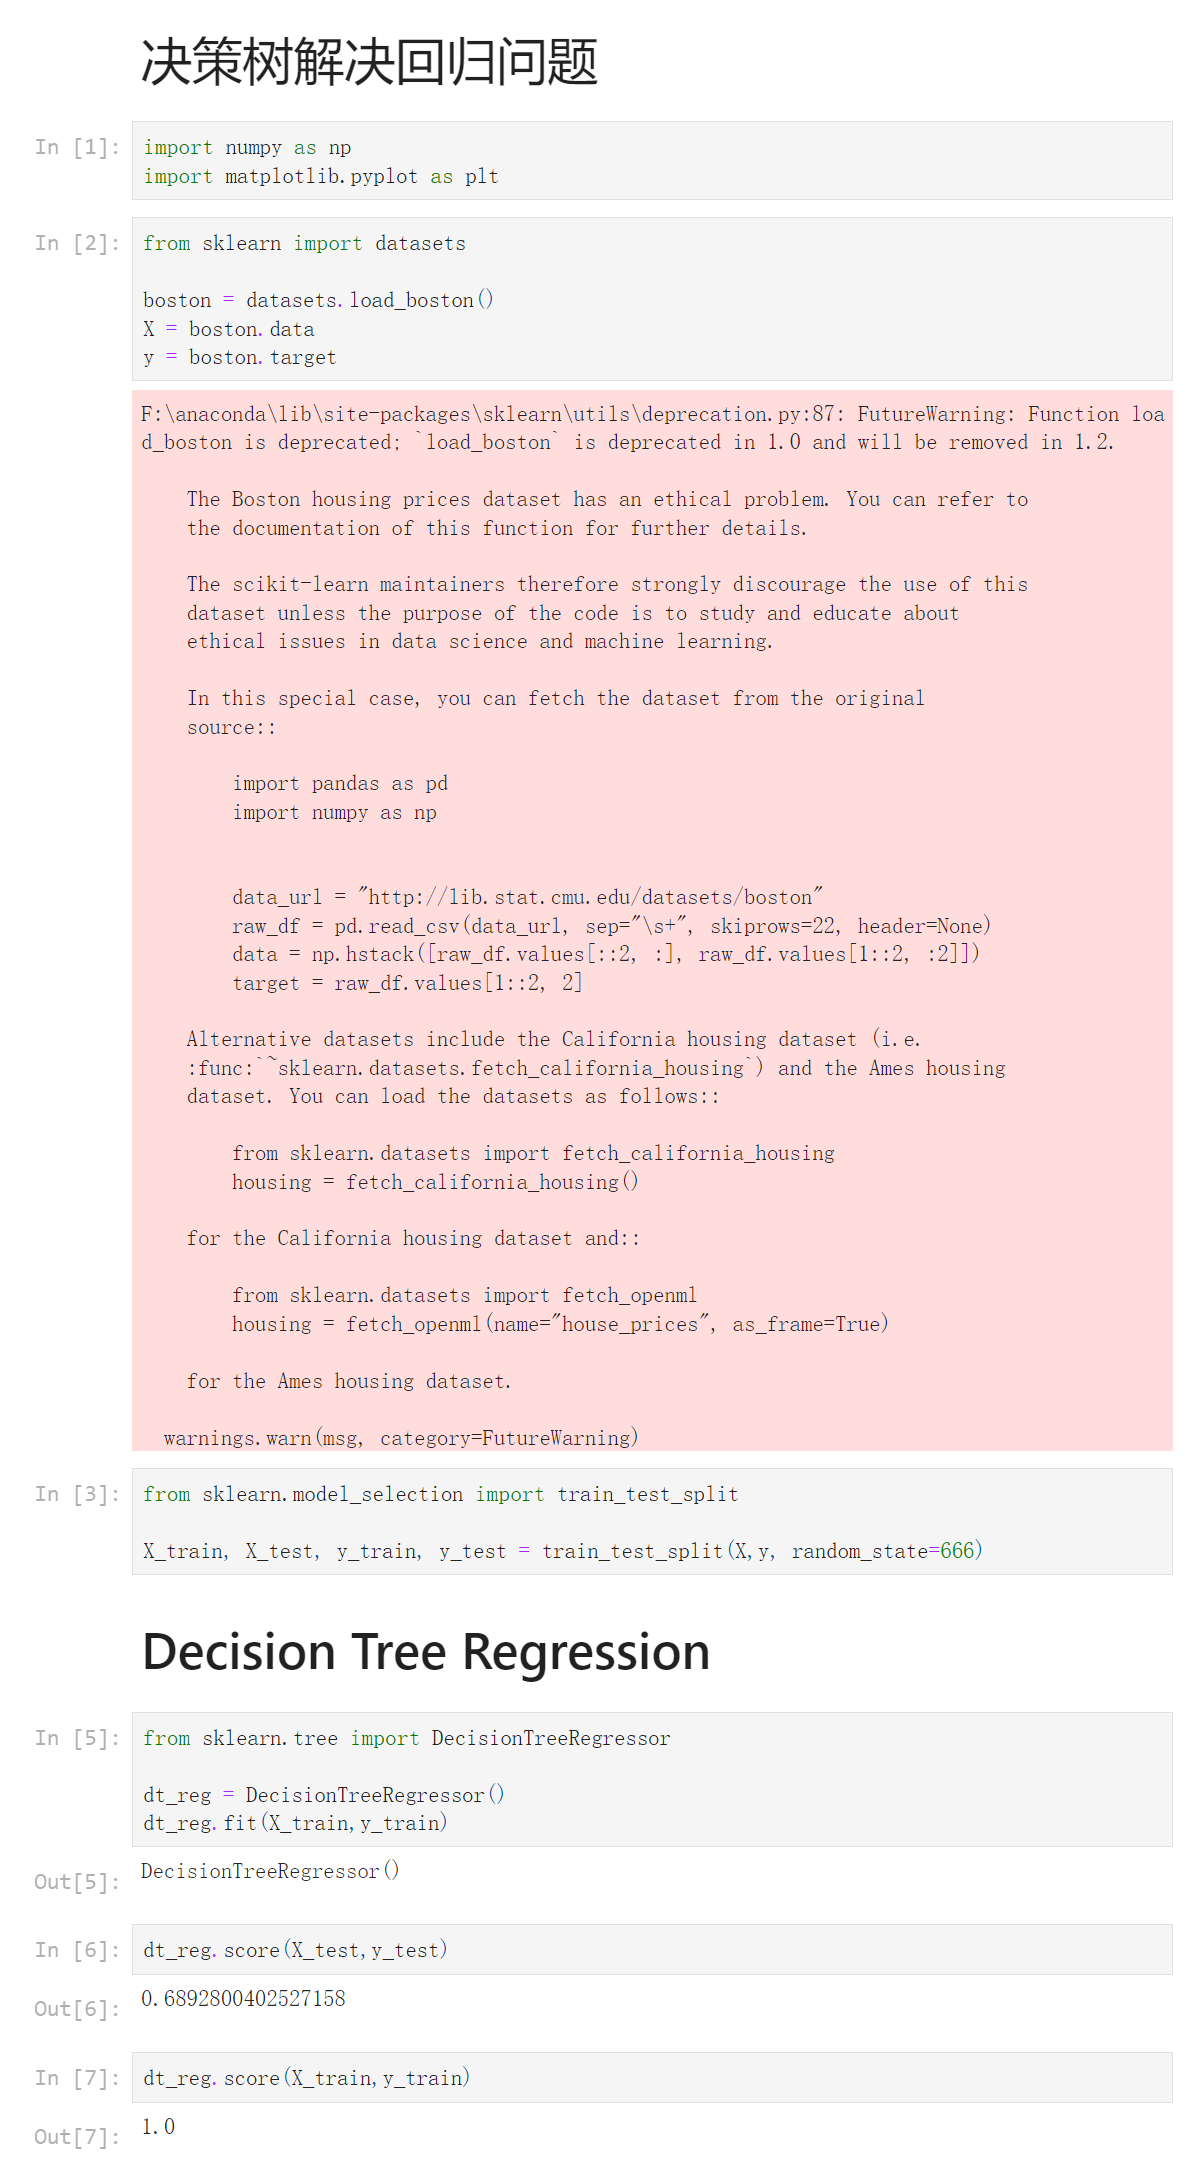
 1 决策树解决回归问题
 2 [1]
 3 import numpy as np
 4 import matplotlib.pyplot as plt
 5 [2]
 6 from sklearn import datasets
 7
 8 boston = datasets.load_boston()
 9 X = boston.data
10 y = boston.target
11 F:\anaconda\lib\site-packages\sklearn\utils\deprecation.py:87: FutureWarning: Function load_boston is deprecated; `load_boston` is deprecated in 1.0 and will be removed in 1.2.
12
13     The Boston housing prices dataset has an ethical problem. You can refer to
14     the documentation of this function for further details.
15
16     The scikit-learn maintainers therefore strongly discourage the use of this
17     dataset unless the purpose of the code is to study and educate about
18     ethical issues in data science and machine learning.
19
20     In this special case, you can fetch the dataset from the original
21     source::
22
23         import pandas as pd
24         import numpy as np
25
26
27         data_url = "http://lib.stat.cmu.edu/datasets/boston"
28         raw_df = pd.read_csv(data_url, sep="\s+", skiprows=22, header=None)
29         data = np.hstack([raw_df.values[::2, :], raw_df.values[1::2, :2]])
30         target = raw_df.values[1::2, 2]
31
32     Alternative datasets include the California housing dataset (i.e.
33     :func:`~sklearn.datasets.fetch_california_housing`) and the Ames housing
34     dataset. You can load the datasets as follows::
35
36         from sklearn.datasets import fetch_california_housing
37         housing = fetch_california_housing()
38
39     for the California housing dataset and::
40
41         from sklearn.datasets import fetch_openml
42         housing = fetch_openml(name="house_prices", as_frame=True)
43
44     for the Ames housing dataset.
45
46   warnings.warn(msg, category=FutureWarning)
47
48 [3]
49 from sklearn.model_selection import train_test_split
50
51 X_train, X_test, y_train, y_test = train_test_split(X,y, random_state=666)
52 Decision Tree Regression
53 [5]
54 from sklearn.tree import DecisionTreeRegressor
55
56 dt_reg = DecisionTreeRegressor()
57 dt_reg.fit(X_train,y_train)
58 DecisionTreeRegressor()
59 [6]
60 dt_reg.score(X_test,y_test)
61 0.6892800402527158
62 [7]
63 dt_reg.score(X_train,y_train)
64 1.0
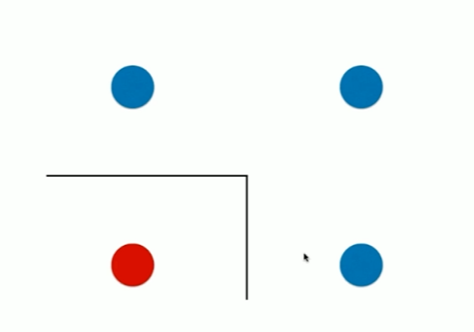
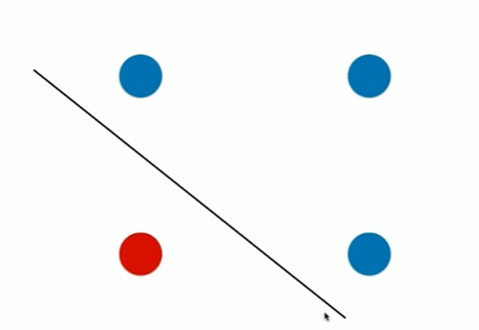
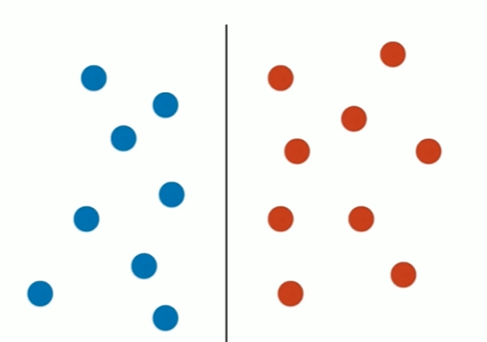
12-7 决策树的局限性

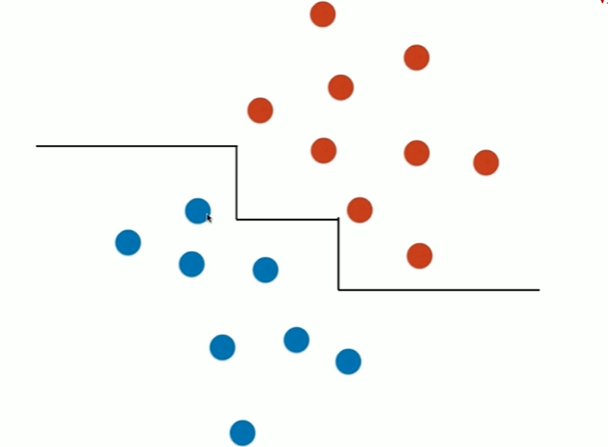

Notbook 示例
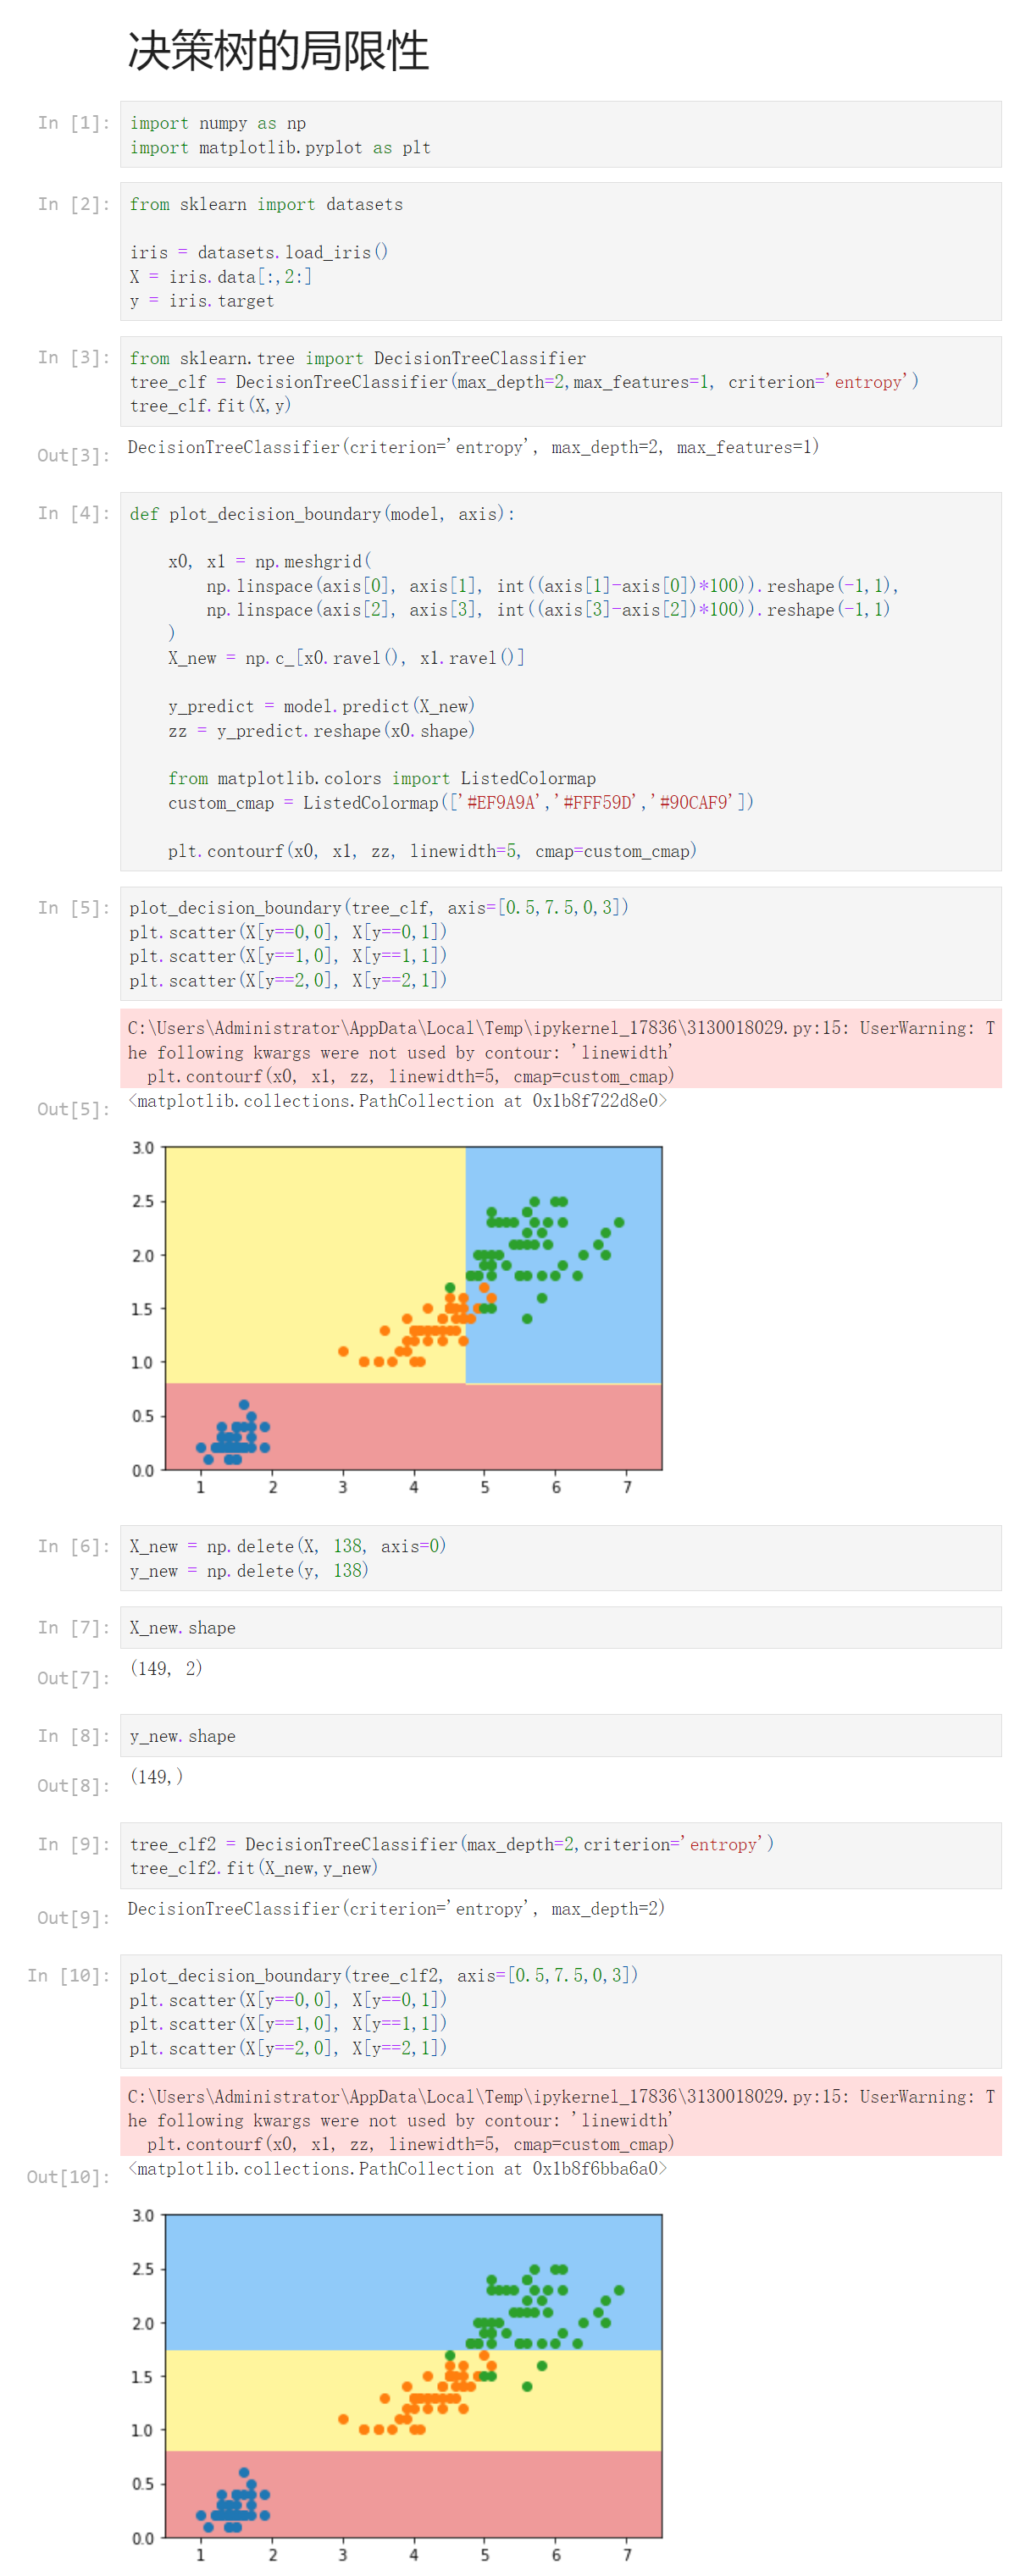
Notbook 源码
 1 决策树的局限性
 2 [1]
 3 import numpy as np
 4 import matplotlib.pyplot as plt
 5 [2]
 6 from sklearn import datasets
 7
 8 iris = datasets.load_iris()
 9 X = iris.data[:,2:]
10 y = iris.target
11 [3]
12 from sklearn.tree import DecisionTreeClassifier
13 tree_clf = DecisionTreeClassifier(max_depth=2,max_features=1, criterion='entropy')
14 tree_clf.fit(X,y)
15 DecisionTreeClassifier(criterion='entropy', max_depth=2, max_features=1)
16 [4]
17 def plot_decision_boundary(model, axis):
18
19     x0, x1 = np.meshgrid(
20         np.linspace(axis[0], axis[1], int((axis[1]-axis[0])*100)).reshape(-1,1),
21         np.linspace(axis[2], axis[3], int((axis[3]-axis[2])*100)).reshape(-1,1)
22     )
23     X_new = np.c_[x0.ravel(), x1.ravel()]
24
25     y_predict = model.predict(X_new)
26     zz = y_predict.reshape(x0.shape)
27
28     from matplotlib.colors import ListedColormap
29     custom_cmap = ListedColormap(['#EF9A9A','#FFF59D','#90CAF9'])
30
31     plt.contourf(x0, x1, zz, linewidth=5, cmap=custom_cmap)
32 [5]
33 plot_decision_boundary(tree_clf, axis=[0.5,7.5,0,3])
34 plt.scatter(X[y==0,0], X[y==0,1])
35 plt.scatter(X[y==1,0], X[y==1,1])
36 plt.scatter(X[y==2,0], X[y==2,1])
37 C:\Users\Administrator\AppData\Local\Temp\ipykernel_17836\3130018029.py:15: UserWarning: The following kwargs were not used by contour: 'linewidth'
38   plt.contourf(x0, x1, zz, linewidth=5, cmap=custom_cmap)
39
40 <matplotlib.collections.PathCollection at 0x1b8f722d8e0>
41
42 [6]
43 X_new = np.delete(X, 138, axis=0)
44 y_new = np.delete(y, 138)
45 [7]
46 X_new.shape
47 (149, 2)
48 [8]
49 y_new.shape
50 (149,)
51 [9]
52 tree_clf2 = DecisionTreeClassifier(max_depth=2,criterion='entropy')
53 tree_clf2.fit(X_new,y_new)
54 DecisionTreeClassifier(criterion='entropy', max_depth=2)
55 [10]
56 plot_decision_boundary(tree_clf2, axis=[0.5,7.5,0,3])
57 plt.scatter(X[y==0,0], X[y==0,1])
58 plt.scatter(X[y==1,0], X[y==1,1])
59 plt.scatter(X[y==2,0], X[y==2,1])
60 C:\Users\Administrator\AppData\Local\Temp\ipykernel_17836\3130018029.py:15: UserWarning: The following kwargs were not used by contour: 'linewidth'
61   plt.contourf(x0, x1, zz, linewidth=5, cmap=custom_cmap)
62
63 <matplotlib.collections.PathCollection at 0x1b8f6bba6a0>


 浙公网安备 33010602011771号