

echarts自定义legend图例
本次使用vue3、echarts版本使用5.4.1:执行命令:npm install echarts@5.4.1,即可安装
utils文件夹下定义echarts.ts,按需引入
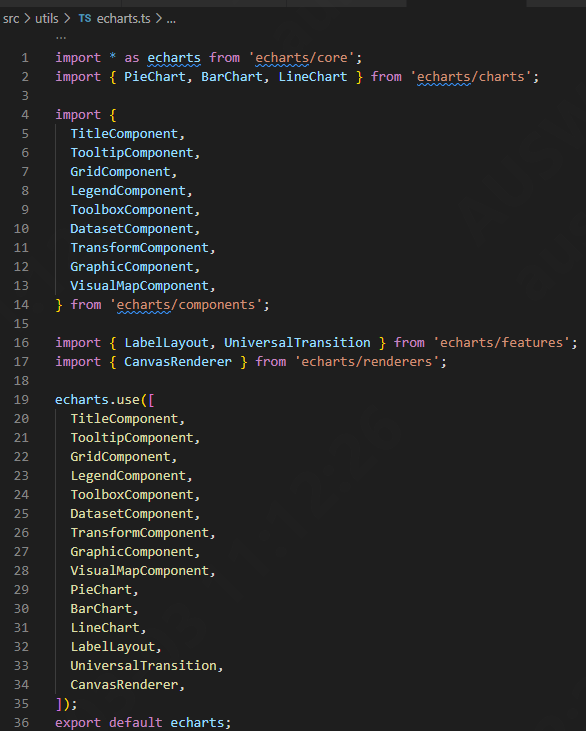
main.ts引入utils中定义的echarts.ts
import echarts form './utils/echarts';

const app = createApp(App);
app.config.globalProperties.$echarts=echarts;
具体代码参考如下:
<template>
  <div ref="chartRef" style="width: 300px;height: 300px;"><div>
</template>

<script lang="ts" setup>
import { ref, onMounted } from 'vue';
//vue引入echarts:
import echarts from '../../../utils/echarts';

  const chartRef = ref();
  const chartData = [
    {
      name: '启用',
      value: 0,
      percent: '0%'
    },
    {
      name: '禁用',
      value: 0,
      percent: '0%'
    }
  ]

  onMounted(() => {
    initChart();
  })

  // 提示框设置
  const toolTipSet = {
    show: true,
    padding: 3,
    textStyle: {
      fontSize: 12
    },
    extraCssText: 'box-shadow: 0 0 3px rgba(0, 0, 0, 0.3);',
    formatter: function(param){
      return param.seriesName + '</br>' + param.marker + ' ' + param.name + '<span style="margin-left: 20px;">' + param.value + '</span>';
    }
  }
  // 图例设置
  const legendSet = {
    orient: 'vertical',
    x: '6%',
    y: 'bottom',
    bottom: 0,
    itemGap: 17,
    itemWidth: 12,
    icon: 'circle',
    textStyle: {
      width: 100,
      rich: {
        a: {
          align: 'left',
          fontSize: 14,
          width: '100%',
          verticalAlign: 'bottom',
          fontFamily: 'sans-serif',
          color: '#000000a5'
        },
        b: {
          align: 'left',
          height: 17,
          width: '1%',
          backgroundColor: 'rgb(204, 204, 204)',
          verticalAlign: 'bottom',
        },
        c: {
          align: 'left',
          fontSize: 14,
          width: '100%',
          verticalAlign: 'bottom',
          fontFamily: '"Arial Normal", "Arial", sans-serif',
          color: 'rgb(204, 204, 204)'
        },
        d: {
          align: 'left',
          fontSize: 14,
          width: '100%',
          verticalAlign: 'bottom',
          fontFamily: '"Arial Normal", "Arial", sans-serif',
          color: '#000000a5'
        }
      }
    },
    formatter: function(name){
      let value, percent;
      for(let i=0; i< chartData.length; i++){
        if(chartData[i].name === name) {
          value = chartData[i].value;
          percent = chartData[i].percent;
        }
      }
      const arr = [
        '{a|' + name + '}',
        '{b|}' + ' ' + ' ',
        '{c|' + percent + '}',
        '{d|' + value + '}'
      ];
      return arr.join('');
    }
  }
  const seriesSet = {
    name: '监控状态',
    type: 'pie',
    center: ['50%', '36%'],
    radius: ['45%', '60%'],
    avoidLabelOverlap: false,
    itemStyle: {
      barBorderRadius: 10,
      borderColor: '#fff',
      borderWidth: 2
    },
    label: {
      show: true,
      position: 'center',
      formatter: '{b}',
      textStyle: {
        fontSize: 0
      }
    },
    emphasis: {
      label: {
        show: true,
        fontSize: 20,
        fontWeight: 'bold',
        textStyle: {
          rich: {
            a:{
              fontWeight: 'bold',
              fontSize: 20
            }
          }
        }
      },
    },
    data: chartData
  }

  function initChart() {
    const myChart = echarts.init(chartRef.value);
    const options = {
      tooltip: toolTipSet,
      legend: legendSet,
      series: seriesSet
    }
    myChart.setOption(options);
    window.addEventListener('resize', () => {
        myChart.resize();
    })
  }
</script>
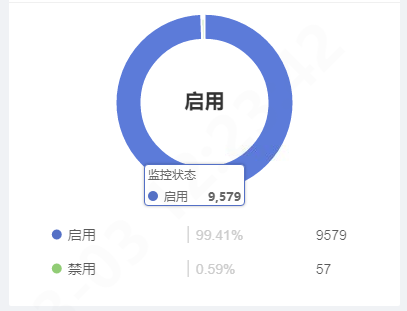
图表展示如下:

 浙公网安备 33010602011771号