结对第二次作业
| 这个作业属于哪个课程 | https://edu.cnblogs.com/campus/fzu/2020SpringW |
|---|---|
| 这个作业要求在哪里 | https://edu.cnblogs.com/campus/fzu/2020SpringW/homework/10456 |
| 结对学号 | 221701414,221701431 |
| 这个作业的目标 | 某次疫情统计可视化的实现 |
| 作业正文 | https://www.cnblogs.com/aahorse/p/12483117.html |
| 其他参考文献 |
零、项目已部署服务器
点击查看:http://www.zhengzhengzheng.club/front/index.html
一、Github 仓库地址和代码规范链接
- Github 仓库地址:https://github.com/jokercan/InfectStatisticWeb
- 代码规范链接:https://github.com/jokercan/InfectStatisticWeb/blob/master/codestyle.md
二、展示成品
-
即时爬取数据。可以选择当天至前二十天的日期。显示国家疫情数据。
-
选择日期,可以看到每个省份的确诊人数
-
选择日期,可以看到每个省份的累计确诊人数
-
国家级别的趋势图
-
点击省份可以进入到省份的详细信息
-
显示特定省份具体日期的疫情信息,同上
-
省份级别的趋势图
三、结对讨论过程
1.讨论实现技术
我们一开始写作业的时候,首先讨论了要用什么技术去实现这一次作业的功能。

2.决定作业牵头人
在决定所采用的的技术后,我们交流了各自的技能点,最后决定这次作业谁来牵头。

3.讨论前后端接口
对于作业的前后端交互接口,我们讨论后决定建立一个在线文档来交流。

4.设计细节交流
前端有个 bug

后端有个 bug

服务器经费问题大讨论

四、设计实现过程
前端
1.写 html 和 css
前端开始写作业时,首先实现了前台的静态页面
2.添加 echarts
通过阅读文档,将疫情地图和疫情趋势图添加进页面中
3.前后端交互
前后端交互通过接口,我们通过在线文档讨论了交互的细节
4.以地图为例说明过程
我们前台显示的地图是用 echarts 来实现的。我们的实现过程如下:
① 在 echarts 官网实例中,学习如何使用热力地图
② 在网上找中国热力地图的样例并学习
③ 将地图用到的 js 包导入到项目中
④ 发起 POST 请求,从后台获取数据,将数据添加到代码中
5.功能结构图
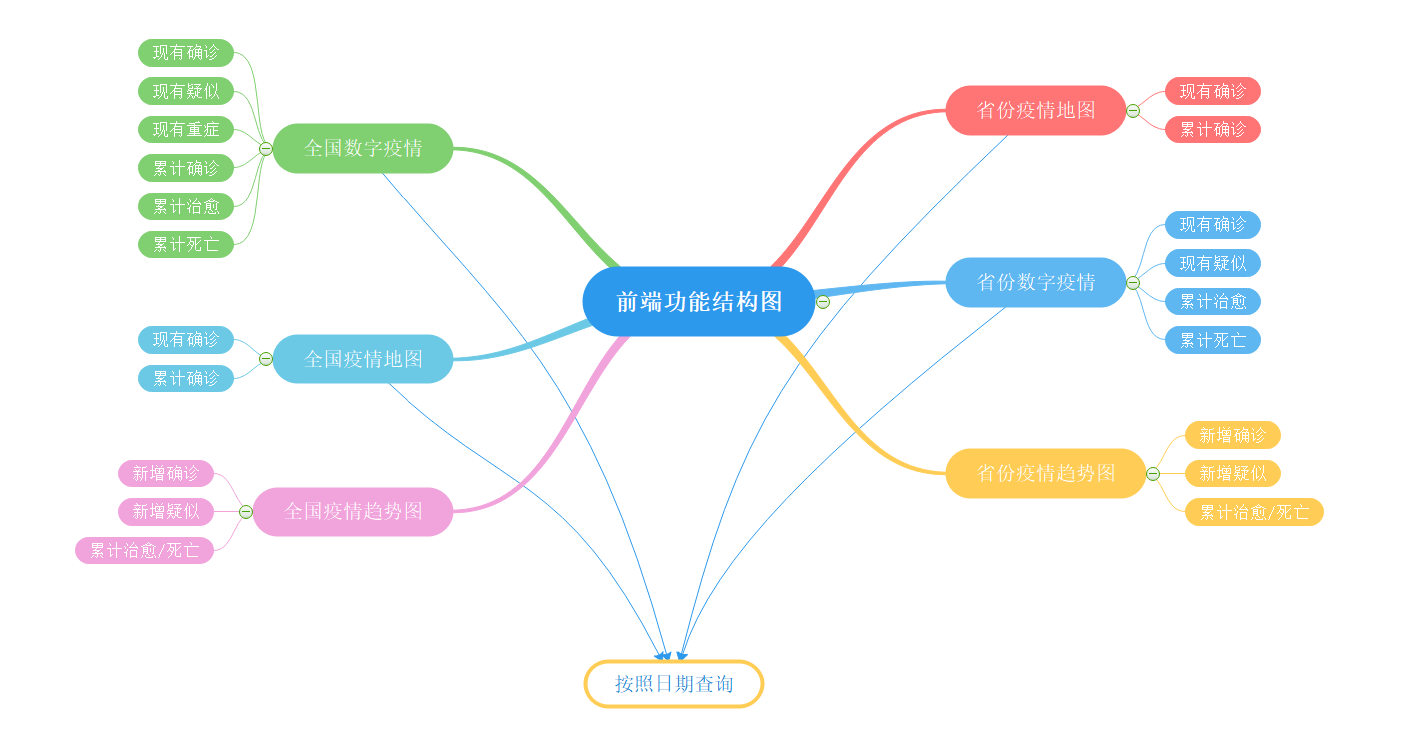
后端
1.确定项目基本结构
使用 springboot 作为基本框架,maven 做为包管理器,fastjson 用来封装 json 数据以及筛选 json 数据。
2.爬取数据
从网络上找到可爬取的接口进行爬取数据
3.前后端交互
前后端交互通过接口,我们通过在线文档讨论了交互的细节
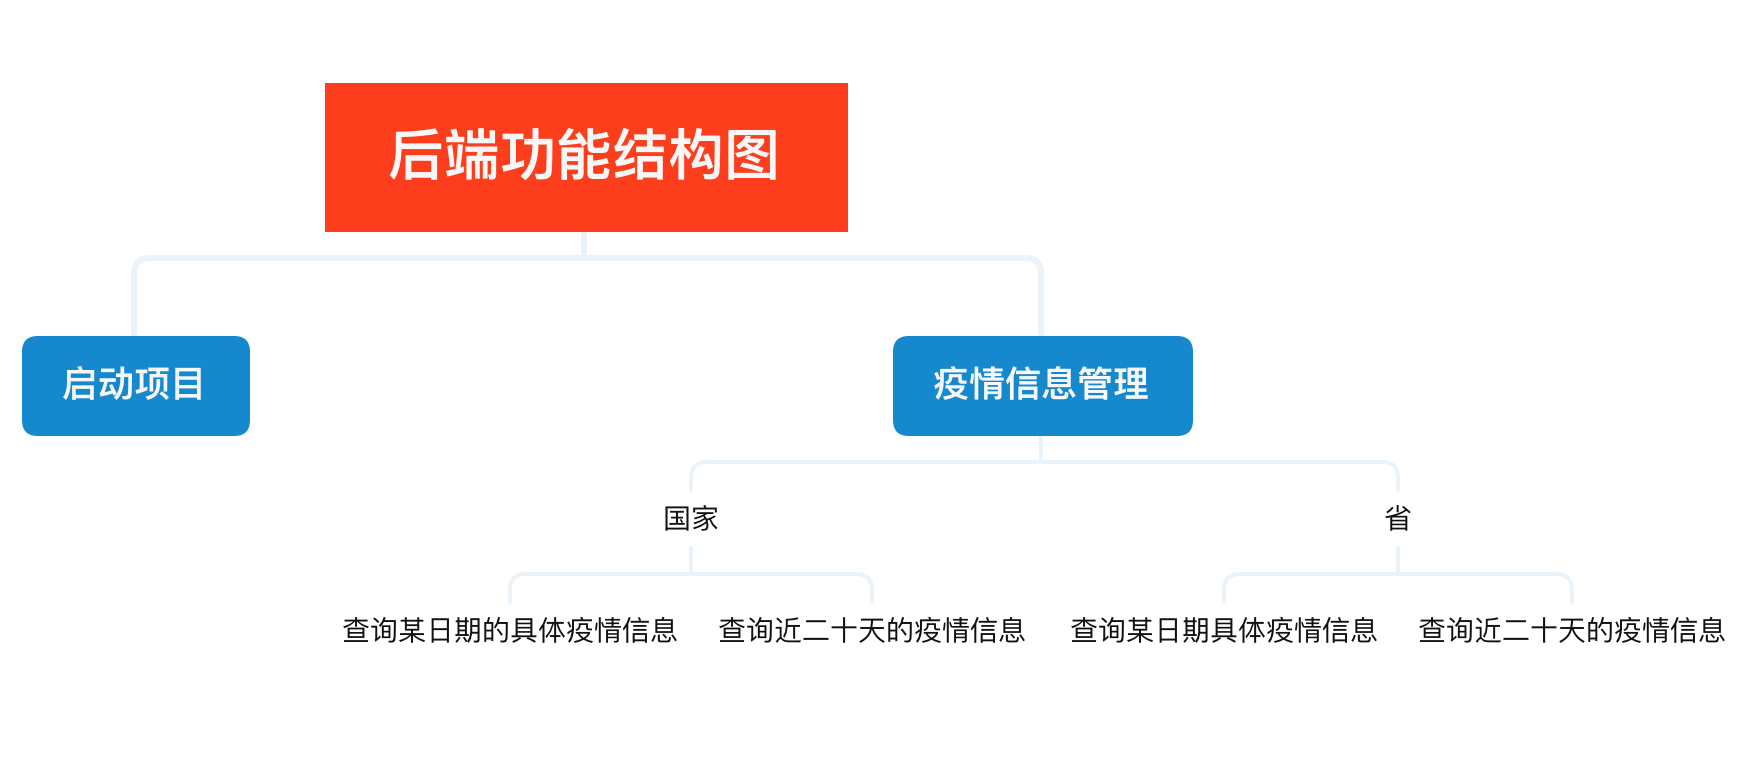
4.功能结构图
五、代码说明
后端代码描述(221701431)
后端这次的代码十分简单,无非是爬取到想要的数据进行分析筛选再传到前端
 public static String request(String httpUrl, String httpArg) {
    BufferedReader reader = null;
    String result = null;
    StringBuffer sbf = new StringBuffer();
    httpUrl = httpUrl + "?" + httpArg;

    try {
        URL url = new URL(httpUrl);
        HttpURLConnection connection = (HttpURLConnection) url
                .openConnection();
        connection.setRequestMethod("GET");
        InputStream is = connection.getInputStream();
        reader = new BufferedReader(new InputStreamReader(is, "UTF-8"));
        String strRead = null;
        while ((strRead = reader.readLine()) != null) {
            sbf.append(strRead);
            sbf.append("\r\n");
        }
        reader.close();
        result = sbf.toString();
    } catch (Exception e) {
        e.printStackTrace();
    }
    return result;
}
上述代码为取得某一网页接口的链接,然后返回接口所提供的所有值。
@Service
public class InfectServiceImpl implements InfectService {
@Value("${key}")
private String key;
public static HashMap<String , String> countryHashMap = new HashMap<>();
public static HashMap<String , String> provincesHashMap = new HashMap<>();

public void setDb(){
    String now = new DateGet().getNow();
    if (countryHashMap.size() == 0 || provincesHashMap.size() == 0 || !countryHashMap.containsKey(now) || !provincesHashMap.containsKey(now) ) {
        countryHashMap.clear(); provincesHashMap.clear();
        for (int j = 0; j < 20; j++) {
            String httpUrl = "http://api.tianapi.com/txapi/ncovcity/index";
            String jsonResult = new Info().request(httpUrl, "key=" + key + "&date=" + now);
            provincesHashMap.put(now, jsonResult);

            String httpUrlC = "http://api.tianapi.com/txapi/ncov/index";
            String jsonResultC = new Info().request(httpUrlC, "key=" + key + "&date=" + now);
            countryHashMap.put(now, jsonResultC);

            now = new DateGet().getDay(now, -1);
        }
    }
    System.out.println("set small DB success");
}
}
本来开始想和以前用 MySQL 进行数据存储,但这个数据实时更新,而且很少会用到很早的数据,所以就将时间限制在二十天之内,这样列表找关系就太辛苦了。用 Redis 又有些大材小用没用必要。因为这个数据不算很大,就直接在后台之中进行存储供查询,这样节省了数据存储的时间,也更符合实时更新的要求。
  public String getProvinceConfirmed(String date){
    String jsonResult = provincesHashMap.get(date);
    JSONObject jsonObject = JSON.parseObject(jsonResult);

    Object o = jsonObject.get("newslist");

    JSONArray jsonArray = JSON.parseArray(o + "");
    List<ProvinceCut> provinceCuts = new LinkedList<ProvinceCut>();
    for (int i = 0; i < jsonArray.size(); i++) {
        Object n1 = jsonArray.get(i);
        JSONObject jsonObject1 = JSON.parseObject(n1 + "");
        ProvinceCut provinceCut = new ProvinceCut();
        provinceCut.setName(String.valueOf(jsonObject1.get("provinceShortName")));
        provinceCut.setCurrentConfirmedCount(Integer.parseInt(String.valueOf(jsonObject1.get("confirmedCount"))));
        provinceCuts.add(provinceCut);
    }
    String js = JSON.toJSONString(provinceCuts);
    return js;
}
以上是对存储在 provinceHashMap 的数据使用 fastjson 进行相应的解析获得想要的数据。并通过 fastjson 封装数据后进行传送。
前端代码描述(221701414)
前端用到的框架都是现学的,写起来挺吃力。
下面以设置全国数字疫情为例,进行代码说明。
1、将数字疫情界面划分为一块,方便界面管理
2、因为这个界面涉及到很多重复的界面,所以用表格来进行展示
3、在原型阶段,我们对这个版块的字体大小、字体颜色有要求。其中,标题的字体大小偏大、但是颜色一致,内容的字体大小偏小、但是颜色不一致。所以,我们设计 class 属性来设置字体的大小,id 属性来单独设置字体的颜色。
4、在 js 中,我们首先通过 ajax 发起异步 GET 请求,从后台获取信息,然后将获取到的信息绑定到对应的标签元素中
<!-- 数字疫情板块 -->
<div class="bg" style="margin-top: 15px">
    <table class="table">
        <tr>
            <td><p class="type-title">现有确诊</p></td>
            <td><p class="type-title">现有疑似</p></td>
            <td><p class="type-title">现有重症</p></td>
        </tr>
        <tr>
            <td><p class="count-content" id="definite-count-content">123</p></td>
            <td><p class="count-content" id="suspected-count-content">123</p></td>
            <td><p class="count-content" id="severe-count-content">123</p></td>
        </tr>
        <tr>
            <td>
                <span class="count-change">昨日</span>
                <span class="count-change" id="definite-count-change">123</span>
            </td>
            <td>
                <span class="count-change">昨日</span>
                <span class="count-change" id="suspected-count-change">123</span>
            </td>
            <td>
                <span class="count-change">昨日</span>
                <span class="count-change" id="severe-count-change">123</span>
            </td>
        </tr>

        <!-- 此处代码有省略 -->

    </table>
</div>
/*
* 设置全国数字疫情
* */
function initNationalDigital(){
    $.ajax({
        type:'get',
        url:'http://localhost:8080/current',
        data:{
            date:$('#datetimepicker1').find("input").val()
        },
        dataType:'json',
        success:function(result){
            document.getElementById("definite-count-content").innerHTML=result["currentConfirmedCount"];
            document.getElementById("suspected-count-content").innerHTML=result["suspectedCount"];
            document.getElementById("severe-count-content").innerHTML=result["seriousCount"];
            document.getElementById("sum-definite-count-content").innerHTML=result["confirmedCount"];
            document.getElementById("sum-cure-count-content").innerHTML=result["curedCount"];
            document.getElementById("sum-dead-count-content").innerHTML=result["deadCount"];

            document.getElementById("definite-count-change").innerHTML=result["currentConfirmedIncr"]>0?"+"+result["currentConfirmedIncr"]:result["currentConfirmedIncr"];
            document.getElementById("suspected-count-change").innerHTML=result["suspectedIncr"]>0?"+"+result["suspectedIncr"]:result["suspectedIncr"];
            document.getElementById("severe-count-change").innerHTML=result["seriousIncr"]>0?"+"+result["seriousIncr"]:result["seriousIncr"];
            document.getElementById("sum-definite-count-change").innerHTML=result["confirmedIncr"]>0?"+"+result["confirmedIncr"]:result["confirmedIncr"];
            document.getElementById("sum-cure-count-change").innerHTML=result["curedIncr"]>0?"+"+result["curedIncr"]:result["curedIncr"];
            document.getElementById("sum-dead-count-change").innerHTML=result["deadIncr"]>0?"+"+result["deadIncr"]:result["deadIncr"];
        }
    });
}
.count-content{
    font-size: 16px;
}

.count-change{
    font-size: 10px;
}

#definite-count-content{
    font-size: large;
    color: rgb(253, 107, 92);
}

#definite-count-change{
    color: rgb(253, 107, 92);
}

#suspected-count-content{
    font-size: large;
    color: rgb(234, 146, 45);
}

#suspected-count-change{
    color: rgb(234, 146, 45);
}

#severe-count-content{
    font-size: large;
    color: rgb(73, 110, 158);
}

#severe-count-change{
    color: rgb(73, 110, 158);
}

#sum-definite-count-content{
    font-size: large;
    color: rgb(230, 52, 57);
}

#sum-definite-count-change{
    color: rgb(230, 52, 57);
}

#sum-cure-count-content{
    font-size: large;
    color: rgb(34, 174, 180);
}

#sum-cure-count-change{
    color: rgb(34, 174, 180);
}

#sum-dead-count-content{
    font-size: large;
    color: rgb(122, 124, 128);
}

#sum-dead-count-change{
    color: rgb(122, 124, 128);
}

.table{
    margin: 0;
    padding: 0;
}

.table tr td{
    text-align: center;
}
六、《构建之法阅读心得》、心路历程和收获及对队友的评价
阅读心得
1、对于构建之法第四章里面所要求的两人合作的要求,很遗憾我们并没有真正意义上的做到。虽然这一次作业是两人合作,但是碍于现实,我们是通过前后端分离实现功能的,两人的代码联系只有几个调用接口,代码并没有互通。也因为时间实在有限,代码复审、结对编程这种合作方法没有深刻的体验,这是一种遗憾。
2、在第五章提到的团队合作和流程这个对于我们接下来的团队项目将很有帮助。作为一个团队,要有一致的目标、明确的分工。首先这一点是最为关键的,在团队中要时刻注意和保持。
心路历程及收获
221701414
这次作业有一点体会非常深,就是不同语言的代码思维是共通的。虽然学习过 web 开发,但是一直都没有用 web 技术开发过项目,并且没用过 bootstrap、ajax、jQuery 等框架。在使用这些技术的过程中,却又一种行云流水的感觉。比方说,js 发起 GET 请求,虽然写法不同,但是请求的类型设置、url 设置、同步异步设置、访问成功回调,这些东西又额外的熟悉。我的体会就是,需要花时间去精通一门编程语言,而不是去了解更多的语言。
另外一个体会是,原来我没有学会 git 操作!没想到团队合作的代码会这么难搞,并且可能是网络的问题,GitHub 操作非常的慢。有时间,git 的知识需要马上补上。
221701431
这次的后端代码可以说难度并不是很大。主要难度在于数据的获取能力。刚刚开始我去到丁香医生和百度那边找寻数据,发现只能爬取到当天的数据,让我很苦恼(爬取到的东西可以见寒假作业 2里面拓展的 present 功能)。后面在 git 上发现了有人用 Python 爬取的历史数据,但因为数据不全也放弃。最后发现了一个天行的数据接口。利用爬虫可以爬取近三十天的数据。后面的开发也就一帆风顺。这次的开发让我感受到了数据的重要性,也让我增强了筛选信息的能力。
对队友的评价
221701414
我的队友是一个合格的后端选手,能快速的在网上爬取所需要的数据,并封装好交给前端。希望在团队项目中能进行更深入的合作。

221701431
我的队友是一个学习能力很强,细心优秀的人。值得信赖。能够找到我后端接口的错误并准确反馈。希望还能再次合作。


 浙公网安备 33010602011771号