Python网络爬虫对汽车团购报名的爬取及分析
一、选题背景
现如今汽车已逐步进入家庭中,对于一些准备购入新车的家庭,犹豫不决,不知道现在市场上与车友们推荐的哪些车,此次爬虫项目将对网上的团购排名进行爬取,更能简单直观的让大家依据个人情况来挑选自己中意的车辆详情。
二、设计方案
1.主题式网络爬虫名称
《python网络爬虫汽车团购报名的爬取及分析》
2.主题式网络爬虫爬取的内容与数据特征分析
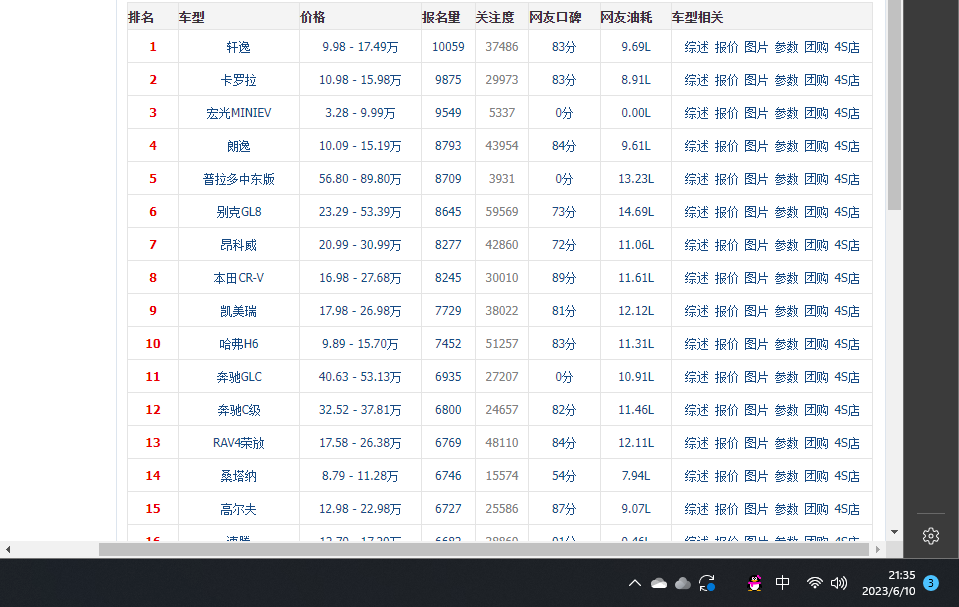
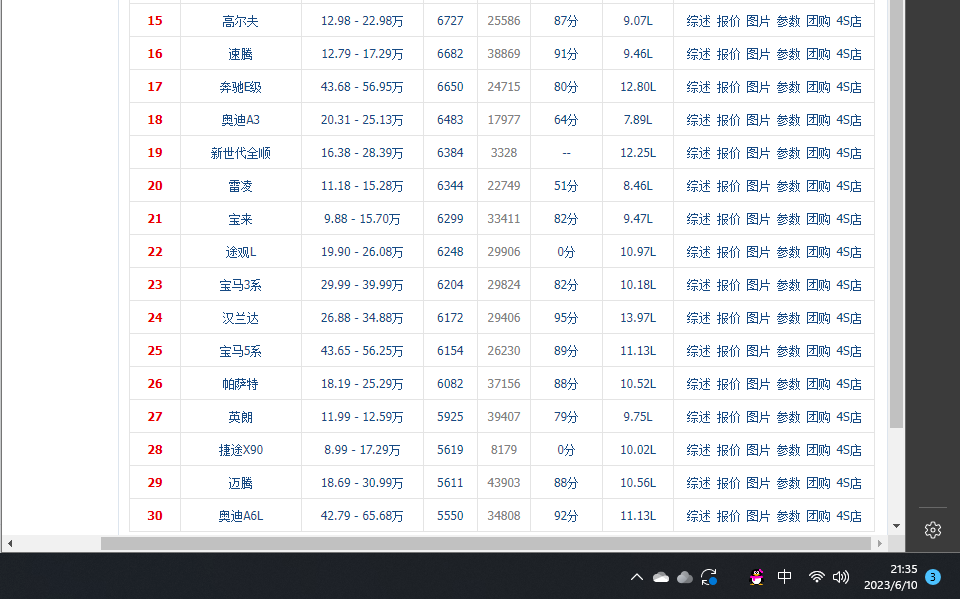
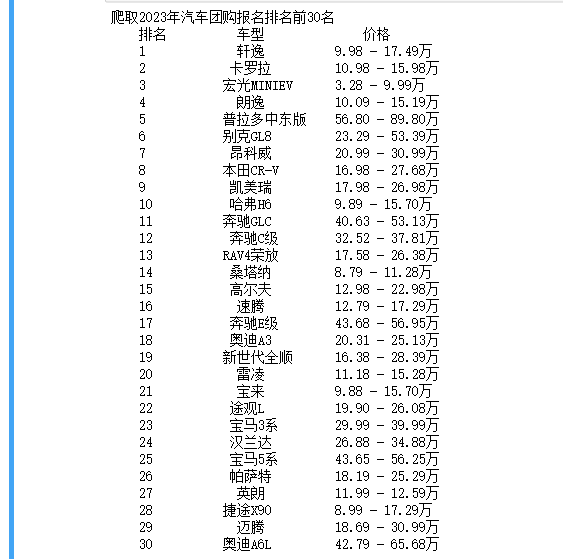
爬取内容:2023年的汽车团购报名的前30
数据特征分析:2023年的汽车团购报名的排行榜的数据可通过后续绘制直方图、饼图、散点图等观察数据的比例以及变化情况。
3.主题式网络爬虫设计方案概述(包括实现思路与技术难点)
实现思路:本次设计方案主要使用requests库爬取网页信息BeautifulSoup库来提取2023年的汽车团购报名的排行榜前30的信息。
技术难点:主要包括爬取2023年的汽车团购报名的排行榜网站和对页面的解析,以及对爬取出的数据进行数据可视化分析。
三、主题页面的结构与特征分析
1.2023年的汽车团购报名的排行榜
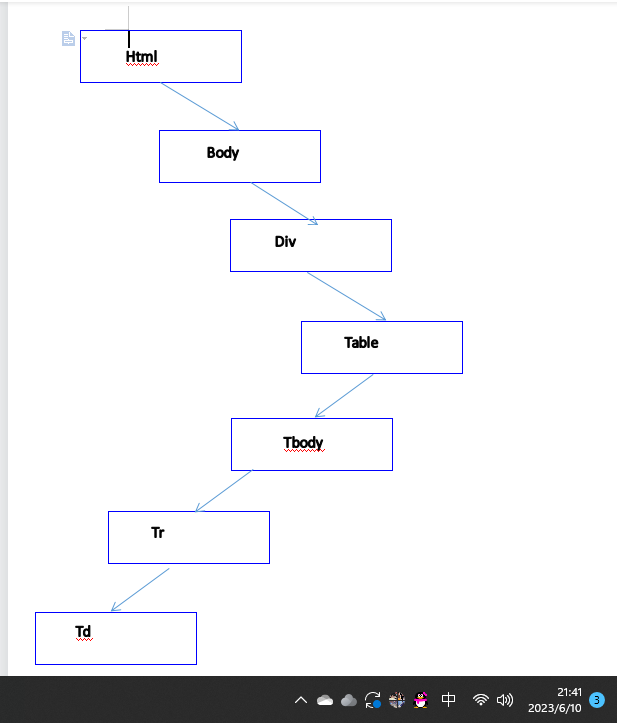
2.Htmls 页面解析:
2023年的汽车团购报名的排行榜源代码
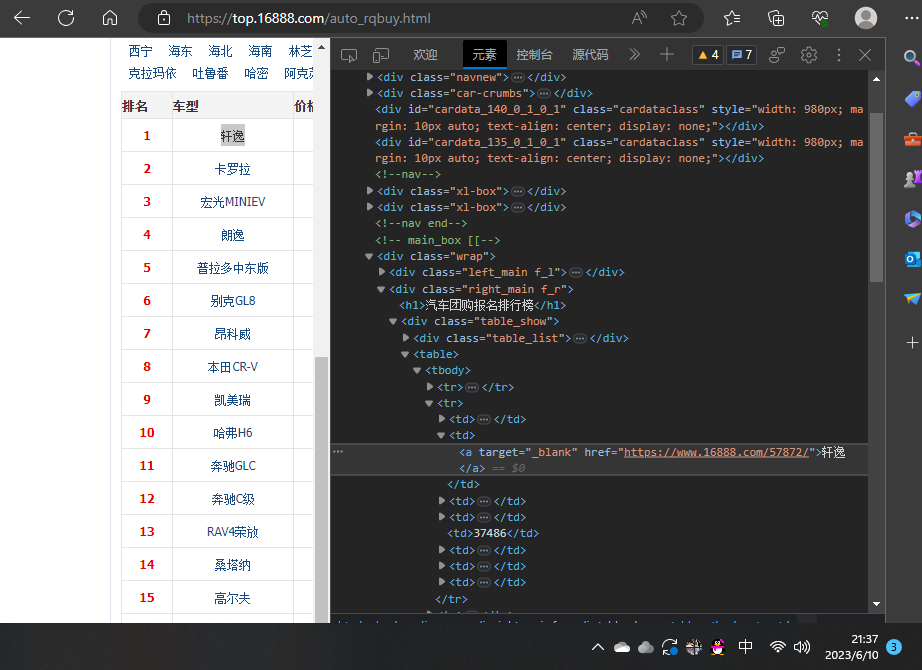
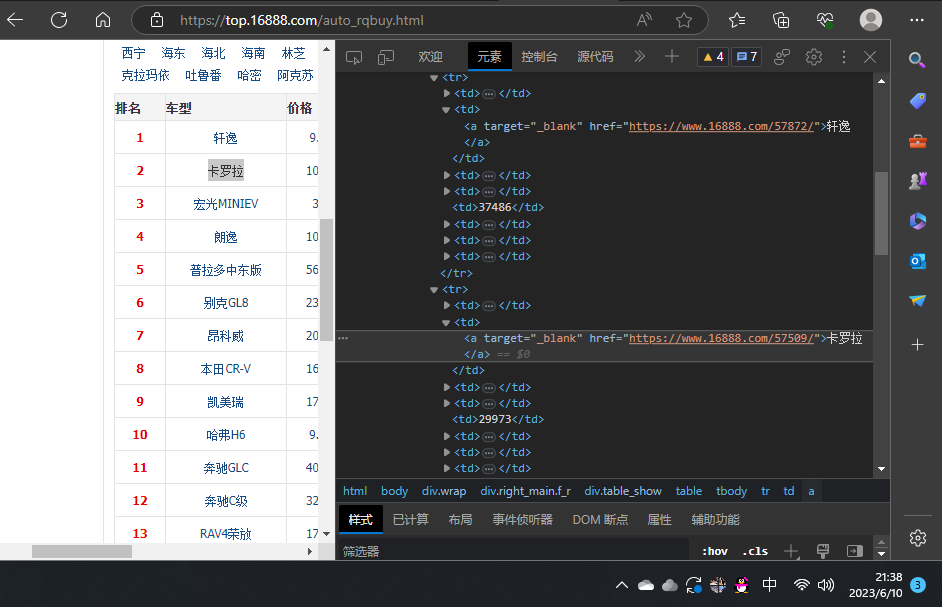
3.节点(标签)查找方法与遍历方法
查找方法:find_all(),select()
遍历方法:for循环
四、网络爬虫程序设计
1.数据爬取与采集
 1 import requests
 2 from bs4 import BeautifulSoup
 3 import bs4
 4 import matplotlib
 5 import pandas as pd
 6 import numpy as np
 7 import matplotlib.pyplot as plt
 8 from scipy.optimize import leastsq
 9 from scipy import log
10 from scipy.optimize import curve_fit
11 from sklearn.metrics import r2_score
12 from mpl_toolkits.mplot3d import Axes3D
13
14 print("爬取2023年汽车团购报名排名前30名")
15
16 def getHTMLText(url):  # 爬取页面中的信息
17     try:
18         r = requests.get(url, timeout=30)
19         r.raise_for_status()
20         r.encoding = r.apparent_encoding
21         return r.text
22     except:
23         return "产生异常"
24
25 def fillu(ulist, html):
26     soup = BeautifulSoup(html, 'html.parser')
27     for tr in soup.find_all('tr'):
28         if isinstance(tr, bs4.element.Tag):
29             tds = tr('td')
30             if tds == []:
31                 continue
32             ulist.append([tds[0].string.strip(),tds[1].string.strip(),  #将所需的数据加入到ulist的列表中
33                tds[2].string.strip(),tds[3].string.strip(),
34                tds[4].string.strip(),tds[5].string.strip().replace("分",""),
35                tds[6].string.strip().replace("L","")])
36
37 def printu(ulist, num):
38     print('{:^10}\t{:^6}\t{:^10}'.format('排名','车型','价格')) #格式化输出
39     for i in range(num):
40         u = ulist[i]
41         print('{:^10}\t{:^6}\t{:^10}'.format(u[0],u[1],u[2]))  #输出排名、车型、价格
42
43 uinfo = []
44 url = 'https://top.16888.com/auto_rqbuy.html'
45 html = getHTMLText(url)
46 fillu(uinfo, html)
47 printu(uinfo, 30)
48
49 pm=[]
50 cx=[]
51 jg=[]
52 bml=[]
53 gzd=[]
54 kb=[]
55 yh=[]
56 #统计排名,车型,价格,报名量,关注度,口碑,油耗
57 for j in uinfo:
58     pm.append(eval(j[0]))
59     cx.append(j[1])
60     jg.append(j[2])
61     bml.append(eval(j[3]))
62     gzd.append(eval(j[4]))
63     yh.append(eval(j[6]))
64     if j[5]=='--':
65         kb.append(0)
66     else:
67         kb.append(eval(j[5]))
68
69 #将排名,车型,价格,报名量,关注度,口碑,油耗写入CSV文件中
70 data=pd.DataFrame({'排名':pm,'车型':cx,
71                    '价格':jg,'报名量':bml,
72                    '关注度':gzd,'口碑':kb,
73                    '油耗(L)':yh})
74 data.to_csv("D://2023年汽车团购报名排行榜.csv", index=False)
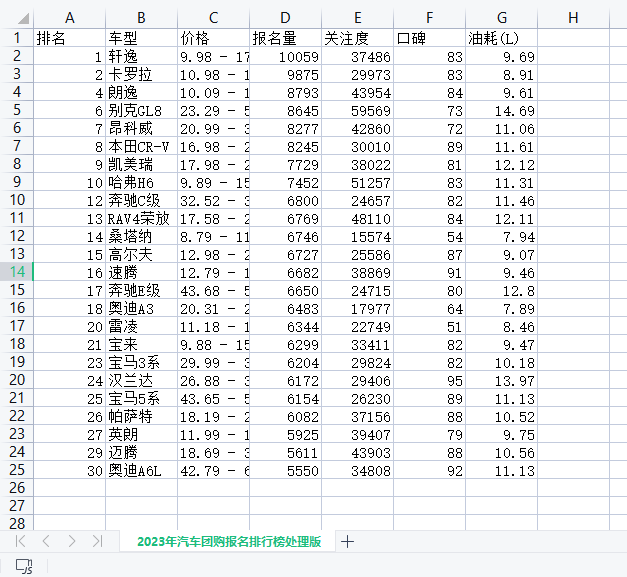
2.对文件数据进行清洗和处理
 1 #对文件进行清洗
 2 s=pd.DataFrame(pd.read_csv('D://2023年汽车团购报名排行榜.csv'))
 3 # 删除重复值
 4 s = s.drop_duplicates()
 5 #报名量,关注度,口碑,油耗都不能为0将为0的删掉
 6 s['报名量'].replace(0, np.nan, inplace=True)
 7 s['关注度'].replace(0, np.nan, inplace=True)
 8 s['口碑'].replace(0, np.nan, inplace=True)
 9 s['油耗(L)'].replace(0, np.nan, inplace=True)
10 # 删除空值行
11 s = s.dropna()
12 # 保存处理后的数据,以便于数据可视化
13 s.to_csv("D://2023年汽车团购报名排行榜处理版.csv", index=False)
14 #将清洗过的数据读取出来
15 n=pd.DataFrame(pd.read_csv('D://2023年汽车团购报名排行榜处理版.csv'))
处理前:

处理后:
3.数据分析与可视化(例如:数据柱形图、直方图、散点图、盒图、分布图)
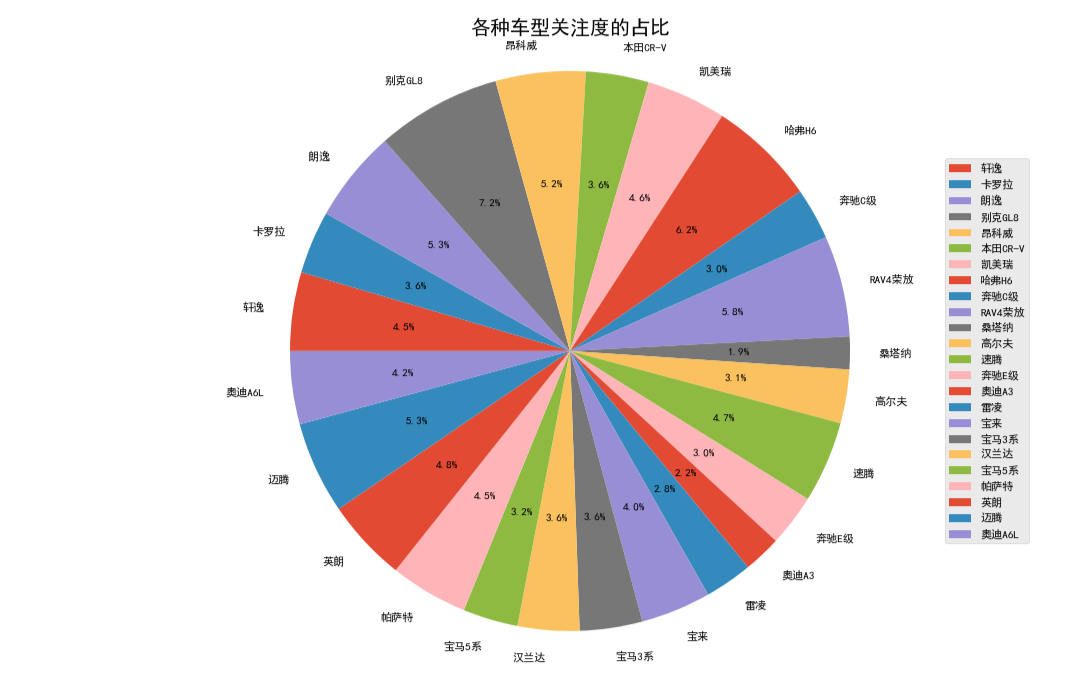
(1)饼图:
 1 plt.clf()  # 清除当前图形
 2
 3 plt.figure(figsize=(12, 8))
 4
 5 name = n['车型'].values
 6 rs = n['关注度'].values
 7 explode = np.zeros(len(rs))
 8
 9 patches, l_text, p_text = plt.pie(rs,
10                                   explode=explode,
11                                   labels=name,
12                                   autopct='%1.1f%%',
13                                   shadow=False,
14                                   pctdistance=0.6,
15                                   labeldistance=1.1,
16                                   startangle=180,
17                                   radius=1.2,
18                                   counterclock=False,
19                                   textprops={'fontsize': 8, 'color': 'black'}
20                                   )
21
22 plt.legend(patches, name, loc='center right', fontsize=8)
23 for t in p_text:
24     t.set_size(8)
25
26 for t in l_text:
27     t.set_size(8)
28
29 plt.rcParams['font.sans-serif'] = ['SimHei']
30 plt.axis('equal')
31 plt.title('各种车型关注度的占比')
32 plt.show()
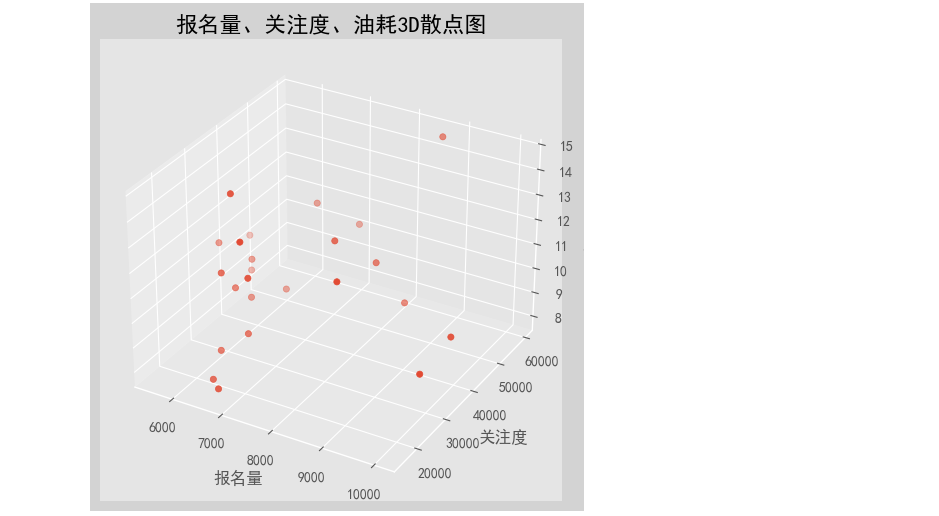
(2)散点图:
 1 import matplotlib.pyplot as plt
 2 from mpl_toolkits.mplot3d import Axes3D
 3
 4 fig = plt.figure("报名量、关注度、油耗的3D散点图", figsize=(8, 6), facecolor='lightgray')
 5 ax = fig.add_subplot(111, projection='3d')
 6
 7 x = n['报名量'].values
 8 y = n['关注度'].values
 9 z = n['油耗(L)'].values
10
11 ax.scatter(x, y, z, s=20, marker='o')
12 ax.set_xlabel('报名量')
13 ax.set_ylabel('关注度')
14 ax.set_zlabel('油耗(L)')
15 ax.set_title('报名量、关注度、油耗3D散点图', fontsize=16)
16
17 plt.show()
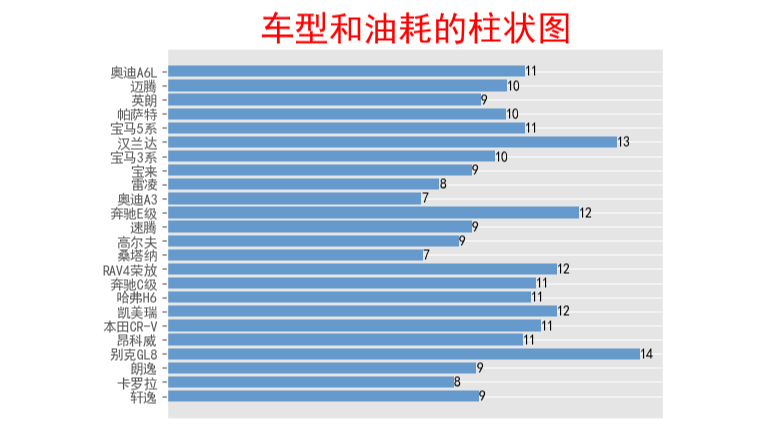
(3)柱状图:
 1 # 绘制车型和油耗的柱状图
 2 Xl=n['车型'].values
 3 Yl=n['油耗(L)'].values
 4 # 中文乱码和坐标轴负号处理。
 5 matplotlib.rc('font', family='SimHei', weight='bold')
 6 plt.rcParams['axes.unicode_minus'] = False
 7
 8 #绘图。
 9 fig, ax = plt.subplots()
10 b = ax.barh(range(len(Xl)), Yl, color='#6699CC')
11
12 #为横向水平的柱图右侧添加数据标签。
13 for rect in b:
14     w = rect.get_width()
15     ax.text(w, rect.get_y()+rect.get_height()/2, '%d' %
16             int(w), ha='left', va='center')
17
18 #设置Y轴纵坐标上的刻度线标签。
19 ax.set_yticks(range(len(Xl)))
20 ax.set_yticklabels(Xl)
21
22 #不要X横坐标上的label标签。
23 plt.xticks(())
24
25 plt.title('车型和油耗的柱状图', loc='center', fontsize='25',
26           fontweight='bold', color='red')
27
28 plt.show()
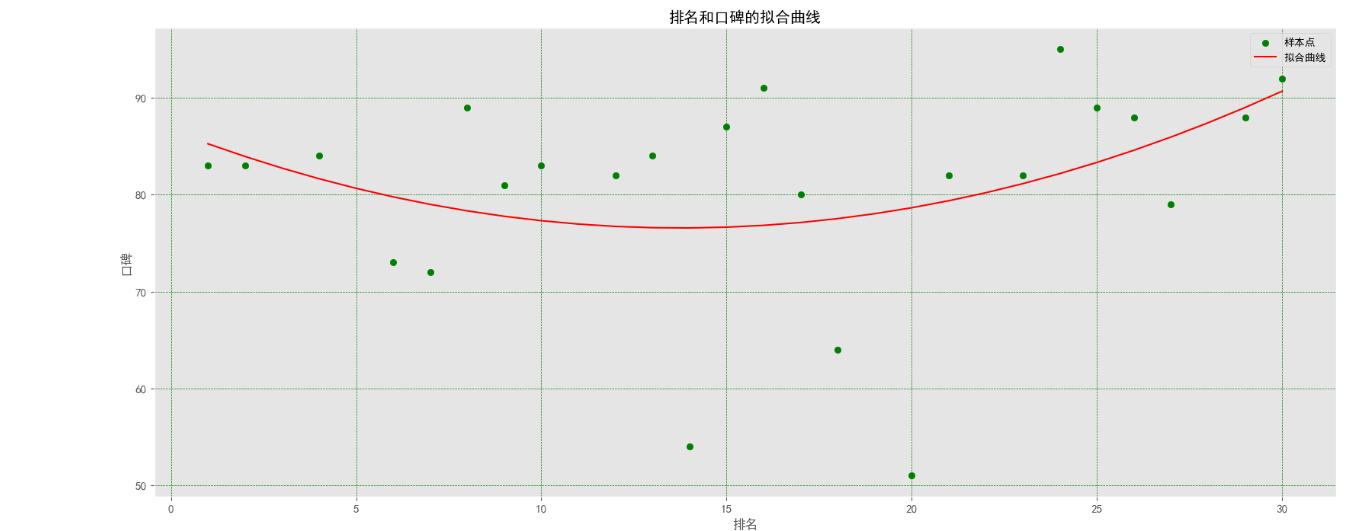
(4)排名和口碑拟合曲线图:
 1 # 绘制排名和口碑的拟合曲线
 2
 3 def func(params, x):
 4     a, b, c = params
 5     return a * x * x + b * x + c
 6
 7 def error(params, x, y):
 8     return func(params, x) - y
 9
10 pxx = n['排名'].values
11 pyy = n['口碑'].values
12 params0 = [5, 2, 10]
13 Para = leastsq(error, params0, args=(pxx, pyy))
14 a, b, c = Para[0]
15 plt.figure(figsize=(20, 8))
16 plt.tick_params(labelsize=11)
17 plt.scatter(pxx, pyy, color='green', label="样本点")
18 x = data['排名'].values
19 y = a * x * x + b * x + c
20 plt.plot(x, y, color='red', label='拟合曲线')
21 plt.xlabel('排名')
22 plt.ylabel('口碑')
23 plt.title('排名和口碑的拟合曲线')
24 plt.legend()
25 plt.grid(True, linestyle='--',
26          color='g', linewidth='0.5')
27 plt.rcParams['font.sans-serif'] = ['SimHei']
28 plt.show()
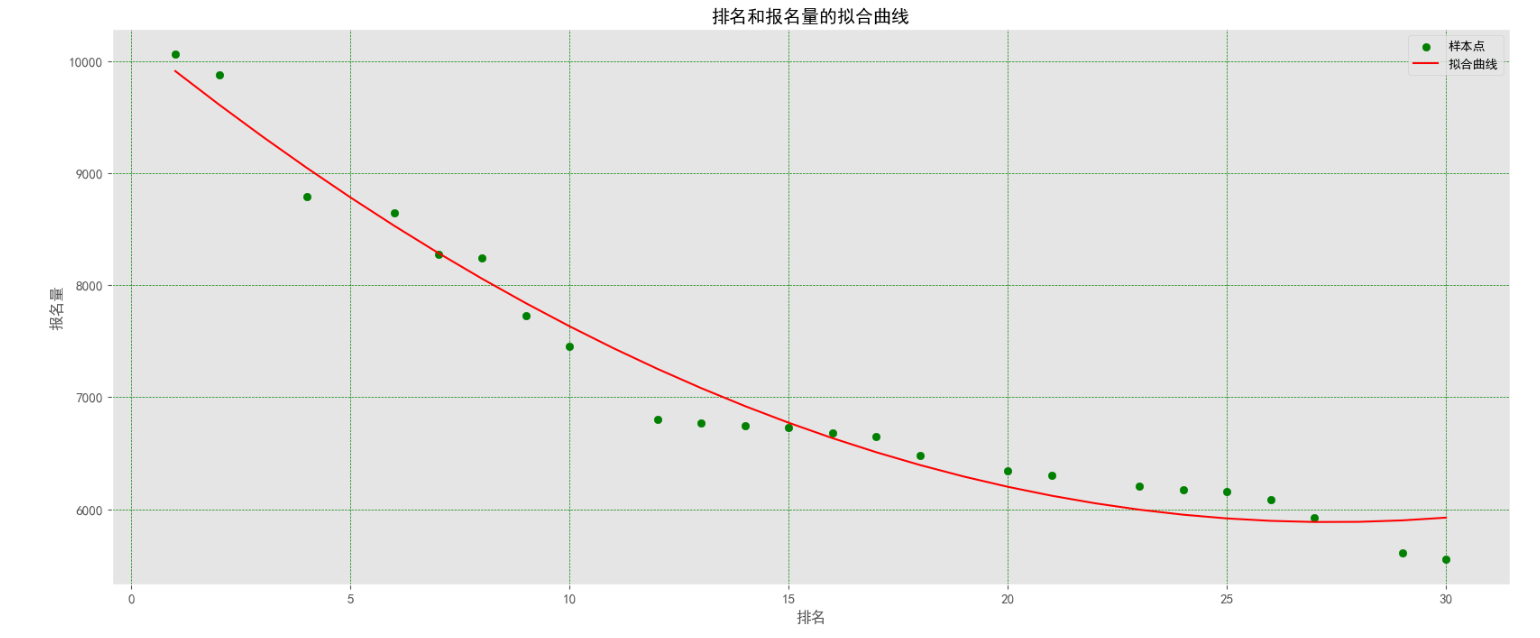
(5)排名和报名量拟合曲线图:
 1 # 绘制排名和报名量的拟合曲线
 2
 3 def func(params, x):
 4     a, b, c = params
 5     return a * x * x + b * x + c
 6
 7 def error(params, x, y):
 8     return func(params, x) - y
 9
10 px = n['排名'].values
11 py = n['报名量'].values
12 params0 = [5, 2, 10]
13 Para = leastsq(error, params0, args=(px, py))
14 a, b, c = Para[0]
15 plt.figure(figsize=(20, 8))
16 plt.tick_params(labelsize=11)
17 plt.scatter(px, py, color='green', label="样本点")
18 x = data['排名'].values
19 y = a * x * x + b * x + c
20 plt.plot(x, y, color='red', label='拟合曲线')
21 plt.xlabel('排名')
22 plt.ylabel('报名量')
23 plt.title('排名和报名量的拟合曲线')
24 plt.legend()
25 plt.grid(True, linestyle='--',
26          color='g', linewidth='0.5')
27 plt.rcParams['font.sans-serif'] = ['SimHei']
28 plt.show()
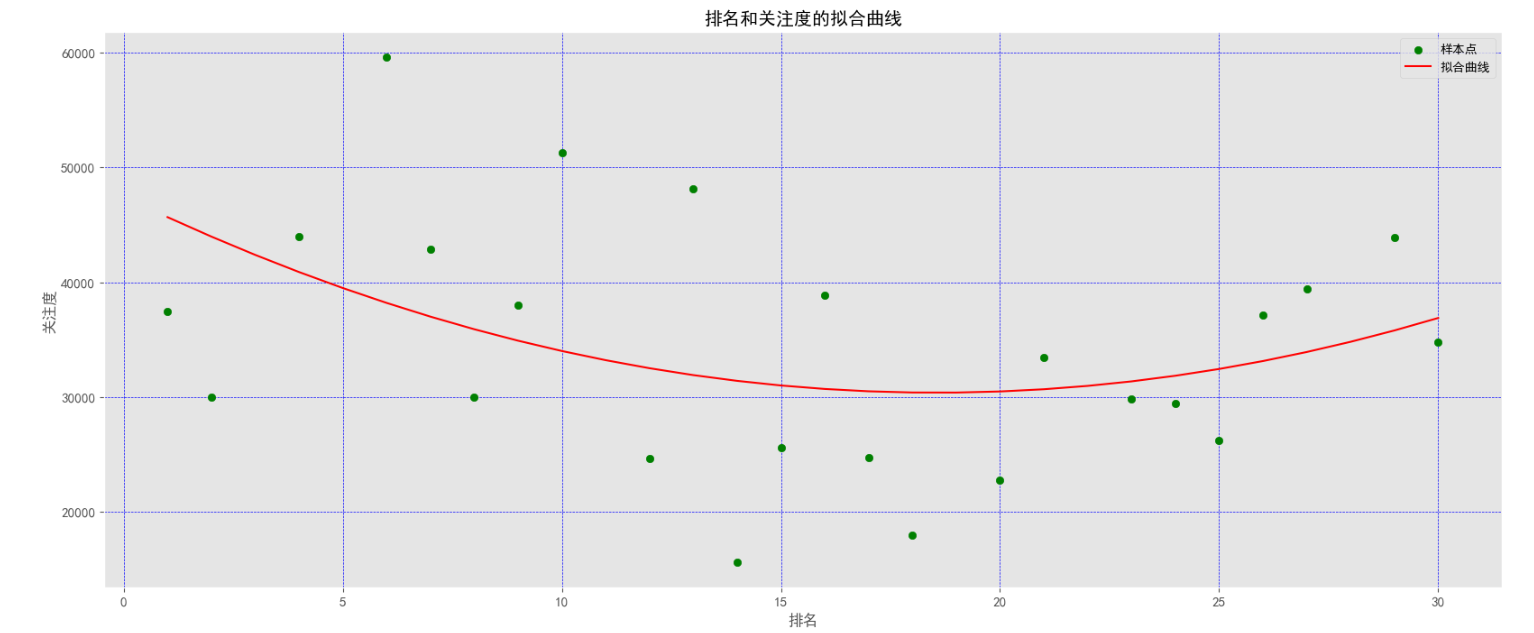
(6)排名和关注度拟合曲线图:
 1 # 绘制排名和关注度的拟合曲线
 2
 3 def func(params, x):
 4     a, b, c = params
 5     return a * x * x + b * x + c
 6
 7 def error(params, x, y):
 8     return func(params, x) - y
 9
10 xi = n['排名'].values
11 yi = n['关注度'].values
12 params0 = [5, 2, 10]
13 Para = leastsq(error, params0, args=(xi, yi))
14 a, b, c = Para[0]
15 plt.figure(figsize=(20, 8))
16 plt.tick_params(labelsize=11)
17 plt.scatter(xi, yi, color='green', label="样本点")
18 x = data['排名'].values
19 y = a * x * x + b * x + c
20 plt.plot(x, y, color='red', label='拟合曲线')
21 plt.xlabel('排名')
22 plt.ylabel('关注度')
23 plt.title('排名和关注度的拟合曲线')
24 plt.legend()
25 plt.grid(True, linestyle='--',
26          color='b', linewidth='0.5')
27 plt.rcParams['font.sans-serif'] = ['SimHei']
28 plt.show()
五、将以上各部分的代码汇总,附上完整程序代码
  1 import requests
  2 from bs4 import BeautifulSoup
  3 import bs4
  4 import matplotlib
  5 import pandas as pd
  6 import numpy as np
  7 import matplotlib.pyplot as plt
  8 from scipy.optimize import leastsq
  9 from scipy import log
 10 from scipy.optimize import curve_fit
 11 from sklearn.metrics import r2_score
 12 from mpl_toolkits.mplot3d import Axes3D
 13
 14 print("爬取2023年汽车团购报名排名前30名")
 15
 16 def getHTMLText(url):  # 爬取页面中的信息
 17     try:
 18         r = requests.get(url, timeout=30)
 19         r.raise_for_status()
 20         r.encoding = r.apparent_encoding
 21         return r.text
 22     except:
 23         return "产生异常"
 24
 25 def fillu(ulist, html):
 26     soup = BeautifulSoup(html, 'html.parser')
 27     for tr in soup.find_all('tr'):
 28         if isinstance(tr, bs4.element.Tag):
 29             tds = tr('td')
 30             if tds == []:
 31                 continue
 32             ulist.append([tds[0].string.strip(),tds[1].string.strip(),  #将所需的数据加入到ulist的列表中
 33                tds[2].string.strip(),tds[3].string.strip(),
 34                tds[4].string.strip(),tds[5].string.strip().replace("分",""),
 35                tds[6].string.strip().replace("L","")])
 36
 37 def printu(ulist, num):
 38     print('{:^10}\t{:^6}\t{:^10}'.format('排名','车型','价格')) #格式化输出
 39     for i in range(num):
 40         u = ulist[i]
 41         print('{:^10}\t{:^6}\t{:^10}'.format(u[0],u[1],u[2]))  #输出排名、车型、价格
 42
 43 uinfo = []
 44 url = 'https://top.16888.com/auto_rqbuy.html'
 45 html = getHTMLText(url)
 46 fillu(uinfo, html)
 47 printu(uinfo, 30)
 48
 49 pm=[]
 50 cx=[]
 51 jg=[]
 52 bml=[]
 53 gzd=[]
 54 kb=[]
 55 yh=[]
 56 #统计排名,车型,价格,报名量,关注度,口碑,油耗
 57 for j in uinfo:
 58     pm.append(eval(j[0]))
 59     cx.append(j[1])
 60     jg.append(j[2])
 61     bml.append(eval(j[3]))
 62     gzd.append(eval(j[4]))
 63     yh.append(eval(j[6]))
 64     if j[5]=='--':
 65         kb.append(0)
 66     else:
 67         kb.append(eval(j[5]))
 68
 69 #将排名,车型,价格,报名量,关注度,口碑,油耗写入CSV文件中
 70 data=pd.DataFrame({'排名':pm,'车型':cx,
 71                    '价格':jg,'报名量':bml,
 72                    '关注度':gzd,'口碑':kb,
 73                    '油耗(L)':yh})
 74 data.to_csv("D://2023年汽车团购报名排行榜.csv", index=False)
 75
 76 #对文件进行清洗
 77 s=pd.DataFrame(pd.read_csv('D://2023年汽车团购报名排行榜.csv'))
 78 # 删除重复值
 79 s = s.drop_duplicates()
 80 #报名量,关注度,口碑,油耗都不能为0将为0的删掉
 81 s['报名量'].replace(0, np.nan, inplace=True)
 82 s['关注度'].replace(0, np.nan, inplace=True)
 83 s['口碑'].replace(0, np.nan, inplace=True)
 84 s['油耗(L)'].replace(0, np.nan, inplace=True)
 85 # 删除空值行
 86 s = s.dropna()
 87 # 保存处理后的数据,以便于数据可视化
 88 s.to_csv("D://2023年汽车团购报名排行榜处理版.csv", index=False)
 89 #将清洗过的数据读取出来
 90 n=pd.DataFrame(pd.read_csv('D://2023年汽车团购报名排行榜处理版.csv'))
 91
 92 plt.clf()  # 清除当前图形
 93
 94 plt.figure(figsize=(12, 8))
 95
 96 name = n['车型'].values
 97 rs = n['关注度'].values
 98 explode = np.zeros(len(rs))
 99
100 patches, l_text, p_text = plt.pie(rs,
101                                   explode=explode,
102                                   labels=name,
103                                   autopct='%1.1f%%',
104                                   shadow=False,
105                                   pctdistance=0.6,
106                                   labeldistance=1.1,
107                                   startangle=180,
108                                   radius=1.2,
109                                   counterclock=False,
110                                   textprops={'fontsize': 8, 'color': 'black'}
111                                   )
112
113 plt.legend(patches, name, loc='center right', fontsize=8)
114 for t in p_text:
115     t.set_size(8)
116
117 for t in l_text:
118     t.set_size(8)
119
120 plt.rcParams['font.sans-serif'] = ['SimHei']
121 plt.axis('equal')
122 plt.title('各种车型关注度的占比')
123 plt.show()
124
125 import matplotlib.pyplot as plt
126 from mpl_toolkits.mplot3d import Axes3D
127
128 fig = plt.figure("报名量、关注度、油耗的3D散点图", figsize=(8, 6), facecolor='lightgray')
129 ax = fig.add_subplot(111, projection='3d')
130
131 x = n['报名量'].values
132 y = n['关注度'].values
133 z = n['油耗(L)'].values
134
135 ax.scatter(x, y, z, s=20, marker='o')
136 ax.set_xlabel('报名量')
137 ax.set_ylabel('关注度')
138 ax.set_zlabel('油耗(L)')
139 ax.set_title('报名量、关注度、油耗3D散点图', fontsize=16)
140
141 plt.show()
142
143 # 绘制车型和油耗的柱状图
144 Xl=n['车型'].values
145 Yl=n['油耗(L)'].values
146 # 中文乱码和坐标轴负号处理。
147 matplotlib.rc('font', family='SimHei', weight='bold')
148 plt.rcParams['axes.unicode_minus'] = False
149
150 #绘图。
151 fig, ax = plt.subplots()
152 b = ax.barh(range(len(Xl)), Yl, color='#6699CC')
153
154 #为横向水平的柱图右侧添加数据标签。
155 for rect in b:
156     w = rect.get_width()
157     ax.text(w, rect.get_y()+rect.get_height()/2, '%d' %
158             int(w), ha='left', va='center')
159
160 #设置Y轴纵坐标上的刻度线标签。
161 ax.set_yticks(range(len(Xl)))
162 ax.set_yticklabels(Xl)
163
164 #不要X横坐标上的label标签。

165 plt.xticks(())
166
167 plt.title('车型和油耗的柱状图', loc='center', fontsize='25',
168           fontweight='bold', color='red')
169
170 plt.show()
171
172 # 绘制排名和口碑的拟合曲线
173
174 def func(params, x):
175     a, b, c = params
176     return a * x * x + b * x + c
177
178 def error(params, x, y):
179     return func(params, x) - y
180
181 pxx = n['排名'].values
182 pyy = n['口碑'].values
183 params0 = [5, 2, 10]
184 Para = leastsq(error, params0, args=(pxx, pyy))
185 a, b, c = Para[0]
186 plt.figure(figsize=(20, 8))
187 plt.tick_params(labelsize=11)
188 plt.scatter(pxx, pyy, color='green', label="样本点")
189 x = data['排名'].values
190 y = a * x * x + b * x + c
191 plt.plot(x, y, color='red', label='拟合曲线')
192 plt.xlabel('排名')
193 plt.ylabel('口碑')
194 plt.title('排名和口碑的拟合曲线')
195 plt.legend()
196 plt.grid(True, linestyle='--',
197          color='g', linewidth='0.5')
198 plt.rcParams['font.sans-serif'] = ['SimHei']
199 plt.show()
200
201 # 绘制排名和报名量的拟合曲线
202
203 def func(params, x):
204     a, b, c = params
205     return a * x * x + b * x + c
206
207 def error(params, x, y):
208     return func(params, x) - y
209
210 px = n['排名'].values
211 py = n['报名量'].values
212 params0 = [5, 2, 10]
213 Para = leastsq(error, params0, args=(px, py))
214 a, b, c = Para[0]
215 plt.figure(figsize=(20, 8))
216 plt.tick_params(labelsize=11)
217 plt.scatter(px, py, color='green', label="样本点")
218 x = data['排名'].values
219 y = a * x * x + b * x + c
220 plt.plot(x, y, color='red', label='拟合曲线')
221 plt.xlabel('排名')
222 plt.ylabel('报名量')
223 plt.title('排名和报名量的拟合曲线')
224 plt.legend()
225 plt.grid(True, linestyle='--',
226          color='g', linewidth='0.5')
227 plt.rcParams['font.sans-serif'] = ['SimHei']
228 plt.show()
229
230 # 绘制排名和关注度的拟合曲线
231
232 def func(params, x):
233     a, b, c = params
234     return a * x * x + b * x + c
235
236 def error(params, x, y):
237     return func(params, x) - y
238
239 xi = n['排名'].values
240 yi = n['关注度'].values
241 params0 = [5, 2, 10]
242 Para = leastsq(error, params0, args=(xi, yi))
243 a, b, c = Para[0]
244 plt.figure(figsize=(20, 8))
245 plt.tick_params(labelsize=11)
246 plt.scatter(xi, yi, color='green', label="样本点")
247 x = data['排名'].values
248 y = a * x * x + b * x + c
249 plt.plot(x, y, color='red', label='拟合曲线')
250 plt.xlabel('排名')
251 plt.ylabel('关注度')
252 plt.title('排名和关注度的拟合曲线')
253 plt.legend()
254 plt.grid(True, linestyle='--',
255          color='b', linewidth='0.5')
256 plt.rcParams['font.sans-serif'] = ['SimHei']
257 plt.show()
六、总结
对主题数据的分析与可视化,能够将数据变得更加直观清晰,能够更好的对数据进行信息提取。此次排名可以看出团购汽车的排名和关注度是成正相关的,吸引大众的不仅仅是汽车的品牌也有对汽车的综合评分。 此次任务虽然说是完成了,但是还是有很多不足,在完成此设计的过程中,我学到了很多,无论是网页的解析还是整体的思路都得到了很大的改善,尤其是学会了耐心,在完成设计的这段时间,代码报错,越改越错已是家常便饭,让我逐渐从开始的焦虑到坦然接受显示,通过各种途径去修改代码,而且在设计过程中我也参考了网上的一些教程,从中发现了自己很多的缺漏,并且给了我一些全新的思路。由于我设计经验不足,在初始制定爬取计划并不完善,在整个过程中,对知识掌握的不足导致于更多的需要在视频及朋友间寻求帮助才能够完成任务。但是在其中也是学到了很多东西,对编程这一方向有了更多兴趣。

 浙公网安备 33010602011771号