
调试控制条视图
Use the Debug console
工具chevron_rightFlutter 和 Dart 的开发者工具 (DevTools) 概览chevron_rightUse the Debug console
The DevTools Debug console allows you to watch an application's standard output (stdout), evaluate expressions for a paused or running app in debug mode, and analyze inbound and outbound references for objects.
info提示
This page is up to date for DevTools 2.23.0.
The Debug console is available from the Inspector, Debugger, and Memory views.
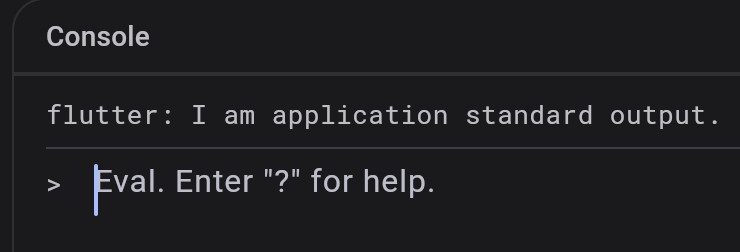
Watch application output
The console shows the application's standard output (stdout):
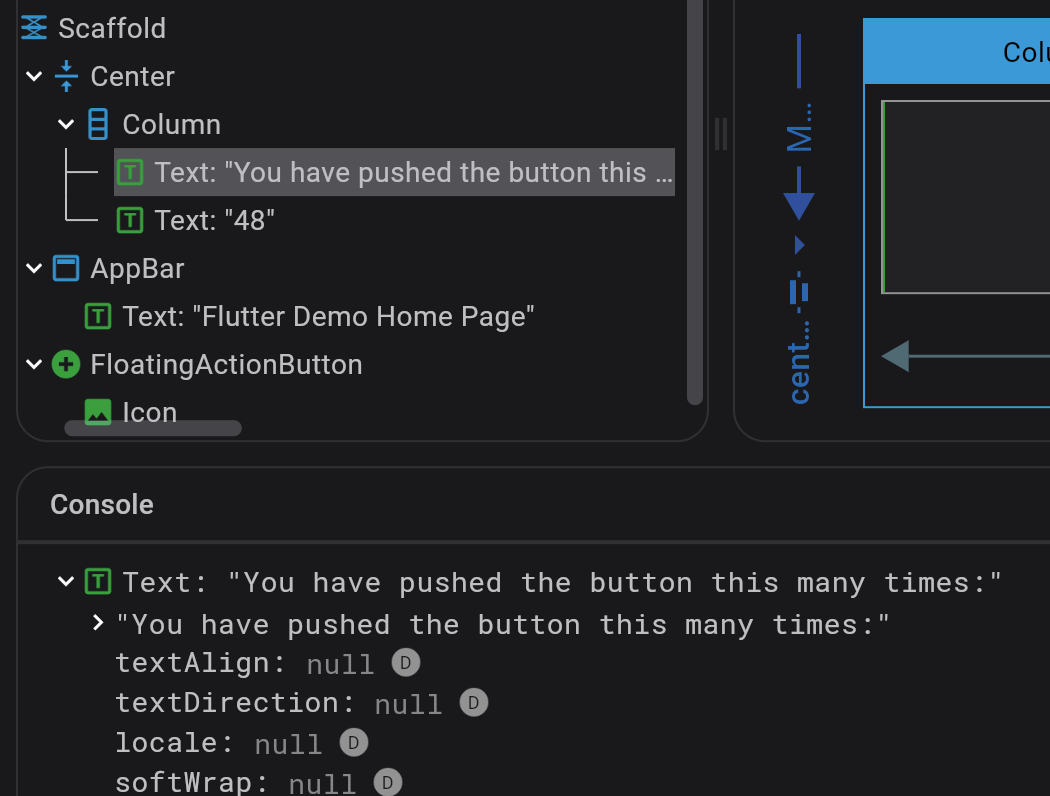
Explore inspected widgets
If you click a widget on the Inspector screen, the variable for this widget displays in the Console:
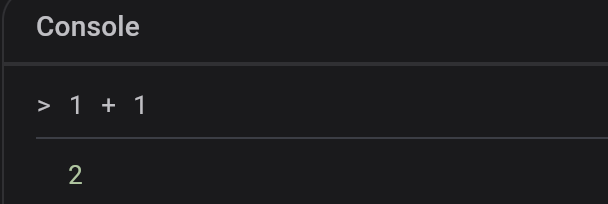
Evaluate expressions
In the console, you can evaluate expressions for a paused or running application, assuming that you are running your app in debug mode:
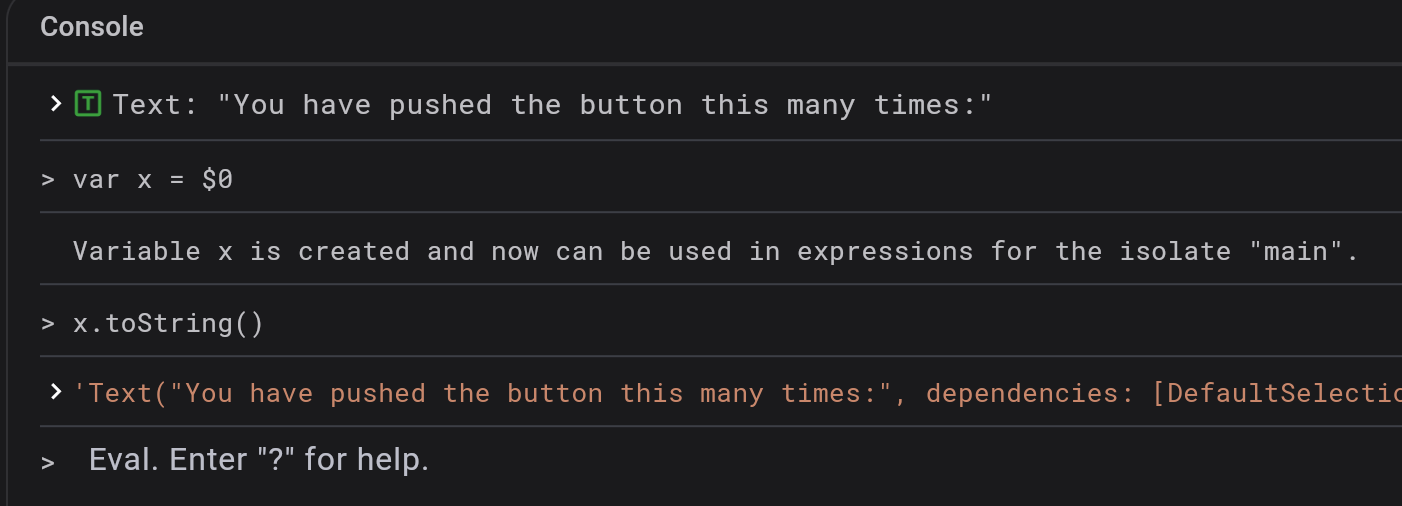
To assign an evaluated object to a variable, use $0, $1 (through $5) in the form of var x = $0:
Browse heap snapshot
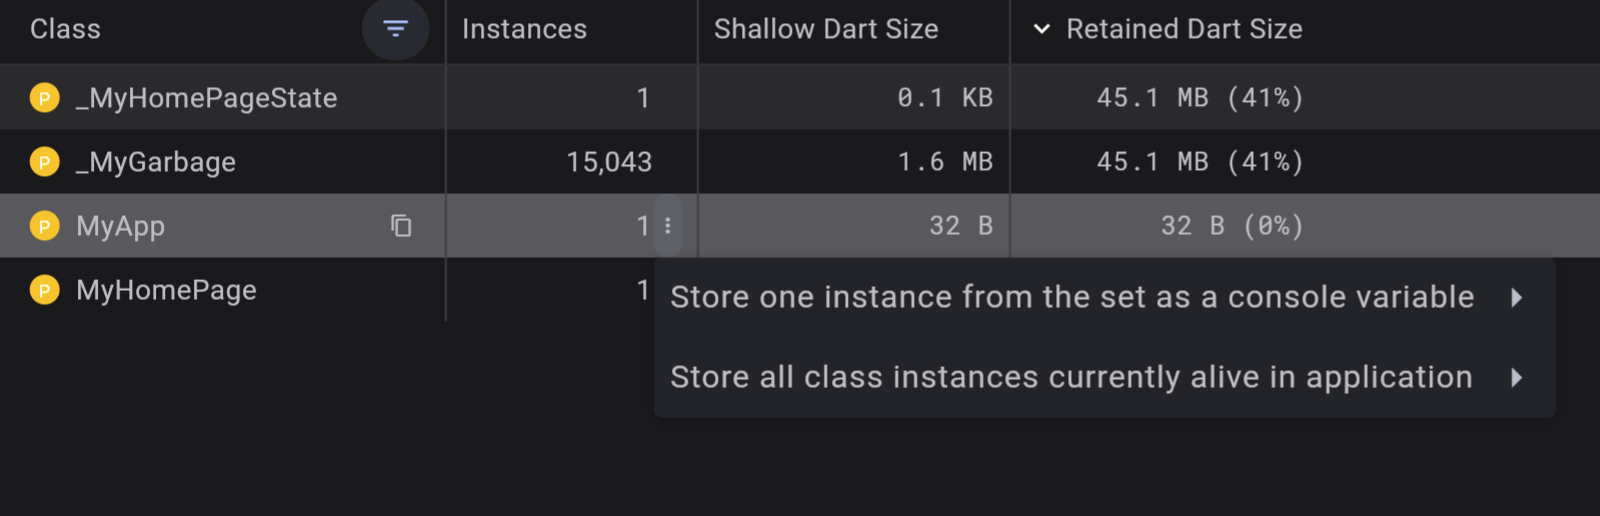
To drop a variable to the console from a heap snapshot, do the following:
- Navigate to Devtools > Memory > Diff Snapshots.
- Record a memory heap snapshot.
- Click on the context menu
[⋮]to view the number of Instances for the desired Class. - Select whether you want to store a single instance as a console variable, or whether you want to store all currently alive instances in the app.
The Console screen displays both live and static inbound and outbound references, as well as field values:

 浙公网安备 33010602011771号